Request Free Sample ×

Kindly complete the form below to receive a free sample of this Report

* Please use a valid business email

Leading companies partner with us for data-driven Insights

clients tt-cursor
Hero Background

South Korea Industrial Networking Solutions Market

ID: MRFR/ICT/63423-HCR
200 Pages
Nirmit Biswas
Last Updated: April 06, 2026

South Korea Industrial Networking Solutions Market Size, Share and Research Report: By Component (Technologies, Services), By Application (Remote monitoring, Asset tracking and management, Supply chain management, Real time streaming and video, Emergency and incident management, Predictive maintenance), By Deployment (Cloud, On premises) and By Networking type (Wireless networking, Wireline networking)- Industry Forecast to 2035

Share:
Download PDF ×

We do not share your information with anyone. However, we may send you emails based on your report interest from time to time. You may contact us at any time to opt-out.

South Korea Industrial Networking Solutions Market Infographic
Purchase Options
  1. SECTION I: EXECUTIVE SUMMARY AND KEY HIGHLIGHTS |
    1. 1.1 EXECUTIVE SUMMARY | |
      1. 1.1.1 Market Overview | |
      2. 1.1.2 Key Findings | |
      3. 1.1.3 Market Segmentation | |
      4. 1.1.4 Competitive Landscape | |
      5. 1.1.5 Challenges and Opportunities | |
      6. 1.1.6 Future Outlook 2
  2. SECTION II: SCOPING, METHODOLOGY AND MARKET STRUCTURE |
    1. 2.1 MARKET INTRODUCTION | |
      1. 2.1.1 Definition | |
      2. 2.1.2 Scope of the study | | |
        1. 2.1.2.1 Research Objective | | |
        2. 2.1.2.2 Assumption | | |
        3. 2.1.2.3 Limitations |
    2. 2.2 RESEARCH METHODOLOGY | |
      1. 2.2.1 Overview | |
      2. 2.2.2 Data Mining | |
      3. 2.2.3 Secondary Research | |
      4. 2.2.4 Primary Research | | |
        1. 2.2.4.1 Primary Interviews and Information Gathering Process | | |
        2. 2.2.4.2 Breakdown of Primary Respondents | |
      5. 2.2.5 Forecasting Model | |
      6. 2.2.6 Market Size Estimation | | |
        1. 2.2.6.1 Bottom-Up Approach | | |
        2. 2.2.6.2 Top-Down Approach | |
      7. 2.2.7 Data Triangulation | |
      8. 2.2.8 Validation 3
  3. SECTION III: QUALITATIVE ANALYSIS |
    1. 3.1 MARKET DYNAMICS | |
      1. 3.1.1 Overview | |
      2. 3.1.2 Drivers | |
      3. 3.1.3 Restraints | |
      4. 3.1.4 Opportunities |
    2. 3.2 MARKET FACTOR ANALYSIS | |
      1. 3.2.1 Value chain Analysis | |
      2. 3.2.2 Porter's Five Forces Analysis | | |
        1. 3.2.2.1 Bargaining Power of Suppliers | | |
        2. 3.2.2.2 Bargaining Power of Buyers | | |
        3. 3.2.2.3 Threat of New Entrants | | |
        4. 3.2.2.4 Threat of Substitutes | | |
        5. 3.2.2.5 Intensity of Rivalry | |
      3. 3.2.3 COVID-19 Impact Analysis | | |
        1. 3.2.3.1 Market Impact Analysis | | |
        2. 3.2.3.2 Regional Impact | | |
        3. 3.2.3.3 Opportunity and Threat Analysis 4
  4. SECTION IV: QUANTITATIVE ANALYSIS |
    1. 4.1 Information and Communications Technology, BY Component (USD Million) | |
      1. 4.1.1 Hardware | |
      2. 4.1.2 Services |
    2. 4.2 Information and Communications Technology, BY Applications (USD Million) | |
      1. 4.2.1 Remote monitoring | |
      2. 4.2.2 Asset tracking and management | |
      3. 4.2.3 Real-time diagnostics and repair | |
      4. 4.2.4 Supply chain management | |
      5. 4.2.5 Predictive maintenance | |
      6. 4.2.6 Emergency & incident management |
    3. 4.3 Information and Communications Technology, BY Deployment (USD Million) | |
      1. 4.3.1 Cloud | |
      2. 4.3.2 On Premises |
    4. 4.4 Information and Communications Technology, BY Networking Type (USD Million) | |
      1. 4.4.1 Wireless networking | |
      2. 4.4.2 Wireline networking 5
  5. SECTION V: COMPETITIVE ANALYSIS |
    1. 5.1 Competitive Landscape | |
      1. 5.1.1 Overview | |
      2. 5.1.2 Competitive Analysis | |
      3. 5.1.3 Market share Analysis | |
      4. 5.1.4 Major Growth Strategy in the Information and Communications Technology | |
      5. 5.1.5 Competitive Benchmarking | |
      6. 5.1.6 Leading Players in Terms of Number of Developments in the Information and Communications Technology | |
      7. 5.1.7 Key developments and growth strategies | | |
        1. 5.1.7.1 New Product Launch/Service Deployment | | |
        2. 5.1.7.2 Merger & Acquisitions | | |
        3. 5.1.7.3 Joint Ventures | |
      8. 5.1.8 Major Players Financial Matrix | | |
        1. 5.1.8.1 Sales and Operating Income | | |
        2. 5.1.8.2 Major Players R&D Expenditure. 2023 |
    2. 5.2 Company Profiles | |
      1. 5.2.1 Siemens (DE) | | |
        1. 5.2.1.1 Financial Overview | | |
        2. 5.2.1.2 Products Offered | | |
        3. 5.2.1.3 Key Developments | | |
        4. 5.2.1.4 SWOT Analysis | | |
        5. 5.2.1.5 Key Strategies | |
      2. 5.2.2 Cisco Systems (US) | | |
        1. 5.2.2.1 Financial Overview | | |
        2. 5.2.2.2 Products Offered | | |
        3. 5.2.2.3 Key Developments | | |
        4. 5.2.2.4 SWOT Analysis | | |
        5. 5.2.2.5 Key Strategies | |
      3. 5.2.3 Rockwell Automation (US) | | |
        1. 5.2.3.1 Financial Overview | | |
        2. 5.2.3.2 Products Offered | | |
        3. 5.2.3.3 Key Developments | | |
        4. 5.2.3.4 SWOT Analysis | | |
        5. 5.2.3.5 Key Strategies | |
      4. 5.2.4 Schneider Electric (FR) | | |
        1. 5.2.4.1 Financial Overview | | |
        2. 5.2.4.2 Products Offered | | |
        3. 5.2.4.3 Key Developments | | |
        4. 5.2.4.4 SWOT Analysis | | |
        5. 5.2.4.5 Key Strategies | |
      5. 5.2.5 Moxa (TW) | | |
        1. 5.2.5.1 Financial Overview | | |
        2. 5.2.5.2 Products Offered | | |
        3. 5.2.5.3 Key Developments | | |
        4. 5.2.5.4 SWOT Analysis | | |
        5. 5.2.5.5 Key Strategies | |
      6. 5.2.6 Hirschmann (DE) | | |
        1. 5.2.6.1 Financial Overview | | |
        2. 5.2.6.2 Products Offered | | |
        3. 5.2.6.3 Key Developments | | |
        4. 5.2.6.4 SWOT Analysis | | |
        5. 5.2.6.5 Key Strategies | |
      7. 5.2.7 Belden (US) | | |
        1. 5.2.7.1 Financial Overview | | |
        2. 5.2.7.2 Products Offered | | |
        3. 5.2.7.3 Key Developments | | |
        4. 5.2.7.4 SWOT Analysis | | |
        5. 5.2.7.5 Key Strategies | |
      8. 5.2.8 Phoenix Contact (DE) | | |
        1. 5.2.8.1 Financial Overview | | |
        2. 5.2.8.2 Products Offered | | |
        3. 5.2.8.3 Key Developments | | |
        4. 5.2.8.4 SWOT Analysis | | |
        5. 5.2.8.5 Key Strategies | |
      9. 5.2.9 Advantech (TW) | | |
        1. 5.2.9.1 Financial Overview | | |
        2. 5.2.9.2 Products Offered | | |
        3. 5.2.9.3 Key Developments | | |
        4. 5.2.9.4 SWOT Analysis | | |
        5. 5.2.9.5 Key Strategies | |
      10. 5.2.10 Honeywell (US) | | |
        1. 5.2.10.1 Financial Overview | | |
        2. 5.2.10.2 Products Offered | | |
        3. 5.2.10.3 Key Developments | | |
        4. 5.2.10.4 SWOT Analysis | | |
        5. 5.2.10.5 Key Strategies |
    3. 5.3 Appendix | |
      1. 5.3.1 References | |
      2. 5.3.2 Related Reports 6 LIST OF FIGURES |
    4. 6.1 MARKET SYNOPSIS |
    5. 6.2 SOUTH KOREA MARKET ANALYSIS BY COMPONENT |
    6. 6.3 SOUTH KOREA MARKET ANALYSIS BY APPLICATIONS |
    7. 6.4 SOUTH KOREA MARKET ANALYSIS BY DEPLOYMENT |
    8. 6.5 SOUTH KOREA MARKET ANALYSIS BY NETWORKING TYPE |
    9. 6.6 KEY BUYING CRITERIA OF INFORMATION AND COMMUNICATIONS TECHNOLOGY |
    10. 6.7 RESEARCH PROCESS OF MRFR |
    11. 6.8 DRO ANALYSIS OF INFORMATION AND COMMUNICATIONS TECHNOLOGY |
    12. 6.9 DRIVERS IMPACT ANALYSIS: INFORMATION AND COMMUNICATIONS TECHNOLOGY |
    13. 6.10 RESTRAINTS IMPACT ANALYSIS: INFORMATION AND COMMUNICATIONS TECHNOLOGY |
    14. 6.11 SUPPLY / VALUE CHAIN: INFORMATION AND COMMUNICATIONS TECHNOLOGY |
    15. 6.12 INFORMATION AND COMMUNICATIONS TECHNOLOGY, BY COMPONENT, 2024 (% SHARE) |
    16. 6.13 INFORMATION AND COMMUNICATIONS TECHNOLOGY, BY COMPONENT, 2024 TO 2035 (USD Million) |
    17. 6.14 INFORMATION AND COMMUNICATIONS TECHNOLOGY, BY APPLICATIONS, 2024 (% SHARE) |
    18. 6.15 INFORMATION AND COMMUNICATIONS TECHNOLOGY, BY APPLICATIONS, 2024 TO 2035 (USD Million) |
    19. 6.16 INFORMATION AND COMMUNICATIONS TECHNOLOGY, BY DEPLOYMENT, 2024 (% SHARE) |
    20. 6.17 INFORMATION AND COMMUNICATIONS TECHNOLOGY, BY DEPLOYMENT, 2024 TO 2035 (USD Million) |
    21. 6.18 INFORMATION AND COMMUNICATIONS TECHNOLOGY, BY NETWORKING TYPE, 2024 (% SHARE) |
    22. 6.19 INFORMATION AND COMMUNICATIONS TECHNOLOGY, BY NETWORKING TYPE, 2024 TO 2035 (USD Million) |
    23. 6.20 BENCHMARKING OF MAJOR COMPETITORS 7 LIST OF TABLES |
    24. 7.1 LIST OF ASSUMPTIONS | |
      1. 7.1.1 |
    25. 7.2 South Korea MARKET SIZE ESTIMATES; FORECAST | |
      1. 7.2.1 BY COMPONENT, 2025-2035 (USD Million) | |
      2. 7.2.2 BY APPLICATIONS, 2025-2035 (USD Million) | |
      3. 7.2.3 BY DEPLOYMENT, 2025-2035 (USD Million) | |
      4. 7.2.4 BY NETWORKING TYPE, 2025-2035 (USD Million) |
    26. 7.3 PRODUCT LAUNCH/PRODUCT DEVELOPMENT/APPROVAL | |
      1. 7.3.1 |
    27. 7.4 ACQUISITION/PARTNERSHIP | |

South Korea Information and Communications Technology Market Segmentation

Information and Communications Technology By Component (USD Million, 2025-2035)
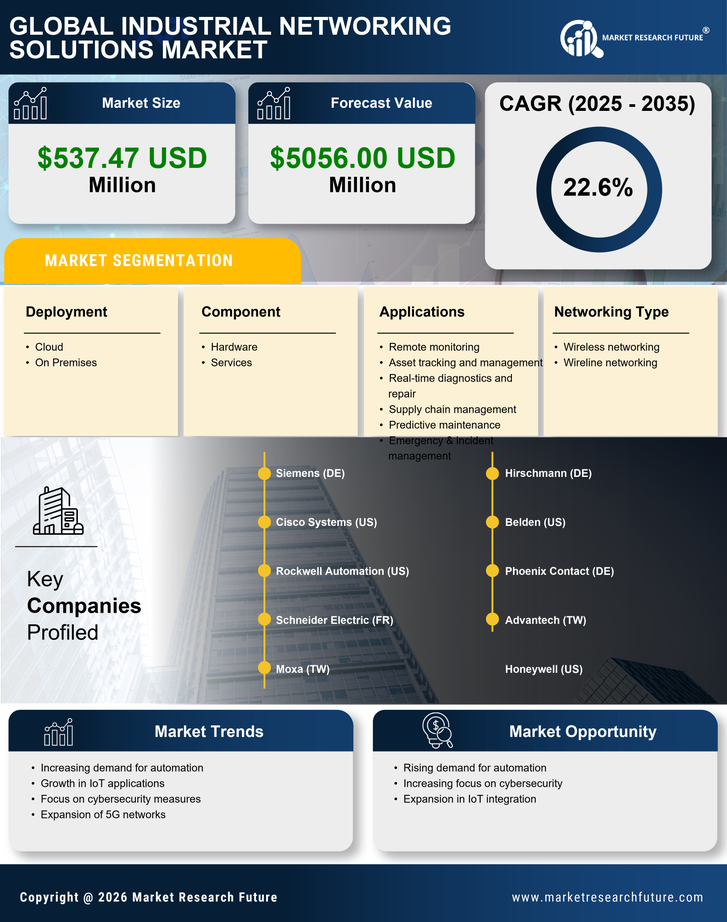
  • Hardware
  • Services

Information and Communications Technology By Applications (USD Million, 2025-2035)

  • Remote monitoring
  • Asset tracking and management
  • Real-time diagnostics and repair
  • Supply chain management
  • Predictive maintenance
  • Emergency & incident management

Information and Communications Technology By Deployment (USD Million, 2025-2035)

  • Cloud
  • On Premises

Information and Communications Technology By Networking Type (USD Million, 2025-2035)

  • Wireless networking
  • Wireline networking

Compare Licence

×
Features License Type
Single User Multiuser License Enterprise User
Price $4,950 $5,950 $7,250
Maximum User Access Limit 1 User Upto 10 Users Unrestricted Access Throughout the Organization
Free Customization
Direct Access to Analyst
Deliverable Format
Platform Access
Discount on Next Purchase 10% 15% 15%
Printable Versions