Request Free Sample ×

Kindly complete the form below to receive a free sample of this Report

* Please use a valid business email

Leading companies partner with us for data-driven Insights

clients tt-cursor
Hero Background

South Korea Industrial Ethernet Market

ID: MRFR/ICT/63715-HCR
200 Pages
Aarti Dhapte
Last Updated: February 06, 2026

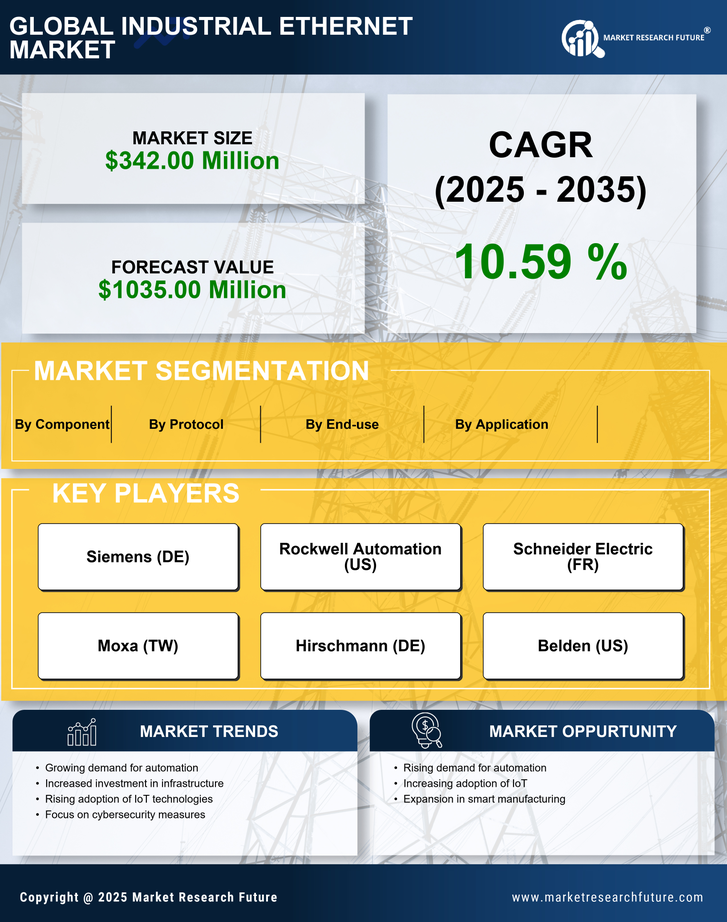
South Korea Industrial Ethernet Market Size, Share and Trends Analysis Report By Component (Hardware, Software, Services), By Protocol (HSE, Sercos III, Ethernet/IP, Modbus TCP/IP, Gigabit Wi-Fi, Ethernet TCP/IP, Powerlink, EtherCAT, CC-Link IE) and By Industry Vertical (Aerospace & Defense, Energy & Power, Pharmaceutical, Oil & Gas, Food & Beverages, Chemical, Automotive, Others)- Forecast to 2035

Share:
Download PDF ×

We do not share your information with anyone. However, we may send you emails based on your report interest from time to time. You may contact us at any time to opt-out.

South Korea Industrial Ethernet Market Infographic
Purchase Options
  1. 1 SECTION I: EXECUTIVE SUMMARY AND KEY HIGHLIGHTS
    1. 1.1 EXECUTIVE SUMMARY
      1. 1.1.1 Market Overview
      2. 1.1.2 Key Findings
      3. 1.1.3 Market Segmentation
      4. 1.1.4 Competitive Landscape
      5. 1.1.5 Challenges and Opportunities
      6. 1.1.6 Future Outlook
  2. 2 SECTION II: SCOPING, METHODOLOGY AND MARKET STRUCTURE
    1. 2.1 MARKET INTRODUCTION
      1. 2.1.1 Definition
      2. 2.1.2 Scope of the study
        1. 2.1.2.1 Research Objective
        2. 2.1.2.2 Assumption
        3. 2.1.2.3 Limitations
    2. 2.2 RESEARCH METHODOLOGY
      1. 2.2.1 Overview
      2. 2.2.2 Data Mining
      3. 2.2.3 Secondary Research
      4. 2.2.4 Primary Research
        1. 2.2.4.1 Primary Interviews and Information Gathering Process
        2. 2.2.4.2 Breakdown of Primary Respondents
      5. 2.2.5 Forecasting Model
      6. 2.2.6 Market Size Estimation
        1. 2.2.6.1 Bottom-Up Approach
        2. 2.2.6.2 Top-Down Approach
      7. 2.2.7 Data Triangulation
      8. 2.2.8 Validation
  3. 3 SECTION III: QUALITATIVE ANALYSIS
    1. 3.1 MARKET DYNAMICS
      1. 3.1.1 Overview
      2. 3.1.2 Drivers
      3. 3.1.3 Restraints
      4. 3.1.4 Opportunities
    2. 3.2 MARKET FACTOR ANALYSIS
      1. 3.2.1 Value chain Analysis
      2. 3.2.2 Porter's Five Forces Analysis
        1. 3.2.2.1 Bargaining Power of Suppliers
        2. 3.2.2.2 Bargaining Power of Buyers
        3. 3.2.2.3 Threat of New Entrants
        4. 3.2.2.4 Threat of Substitutes
        5. 3.2.2.5 Intensity of Rivalry
      3. 3.2.3 COVID-19 Impact Analysis
        1. 3.2.3.1 Market Impact Analysis
        2. 3.2.3.2 Regional Impact
        3. 3.2.3.3 Opportunity and Threat Analysis
  4. 4 SECTION IV: QUANTITATIVE ANALYSIS
    1. 4.1 Information and Communications Technology, BY Protocol (USD Million)
      1. 4.1.1 Ethernet/IP
      2. 4.1.2 PROFINET
      3. 4.1.3 EtherCAT
      4. 4.1.4 Modbus TCP
      5. 4.1.5 SERCOS
    2. 4.2 Information and Communications Technology, BY Application (USD Million)
      1. 4.2.1 Manufacturing Automation
      2. 4.2.2 Process Automation
      3. 4.2.3 Transportation Systems
      4. 4.2.4 Energy and Utilities
      5. 4.2.5 Building Automation
    3. 4.3 Information and Communications Technology, BY End-use (USD Million)
      1. 4.3.1 Automotive
      2. 4.3.2 Electronics
      3. 4.3.3 Oil and Gas
      4. 4.3.4 Food and Beverage
      5. 4.3.5 Pharmaceuticals
    4. 4.4 Information and Communications Technology, BY Component (USD Million)
      1. 4.4.1 Switches
      2. 4.4.2 Routers
      3. 4.4.3 Cables
      4. 4.4.4 Gateways
      5. 4.4.5 I/O Devices
  5. 5 SECTION V: COMPETITIVE ANALYSIS
    1. 5.1 Competitive Landscape
      1. 5.1.1 Overview
      2. 5.1.2 Competitive Analysis
      3. 5.1.3 Market share Analysis
      4. 5.1.4 Major Growth Strategy in the Information and Communications Technology
      5. 5.1.5 Competitive Benchmarking
      6. 5.1.6 Leading Players in Terms of Number of Developments in the Information and Communications Technology
      7. 5.1.7 Key developments and growth strategies
        1. 5.1.7.1 New Product Launch/Service Deployment
        2. 5.1.7.2 Merger & Acquisitions
        3. 5.1.7.3 Joint Ventures
      8. 5.1.8 Major Players Financial Matrix
        1. 5.1.8.1 Sales and Operating Income
        2. 5.1.8.2 Major Players R&D Expenditure. 2023
    2. 5.2 Company Profiles
      1. 5.2.1 Siemens (DE)
        1. 5.2.1.1 Financial Overview
        2. 5.2.1.2 Products Offered
        3. 5.2.1.3 Key Developments
        4. 5.2.1.4 SWOT Analysis
        5. 5.2.1.5 Key Strategies
      2. 5.2.2 Rockwell Automation (US)
        1. 5.2.2.1 Financial Overview
        2. 5.2.2.2 Products Offered
        3. 5.2.2.3 Key Developments
        4. 5.2.2.4 SWOT Analysis
        5. 5.2.2.5 Key Strategies
      3. 5.2.3 Schneider Electric (FR)
        1. 5.2.3.1 Financial Overview
        2. 5.2.3.2 Products Offered
        3. 5.2.3.3 Key Developments
        4. 5.2.3.4 SWOT Analysis
        5. 5.2.3.5 Key Strategies
      4. 5.2.4 Moxa (TW)
        1. 5.2.4.1 Financial Overview
        2. 5.2.4.2 Products Offered
        3. 5.2.4.3 Key Developments
        4. 5.2.4.4 SWOT Analysis
        5. 5.2.4.5 Key Strategies
      5. 5.2.5 Hirschmann (DE)
        1. 5.2.5.1 Financial Overview
        2. 5.2.5.2 Products Offered
        3. 5.2.5.3 Key Developments
        4. 5.2.5.4 SWOT Analysis
        5. 5.2.5.5 Key Strategies
      6. 5.2.6 Belden (US)
        1. 5.2.6.1 Financial Overview
        2. 5.2.6.2 Products Offered
        3. 5.2.6.3 Key Developments
        4. 5.2.6.4 SWOT Analysis
        5. 5.2.6.5 Key Strategies
      7. 5.2.7 Phoenix Contact (DE)
        1. 5.2.7.1 Financial Overview
        2. 5.2.7.2 Products Offered
        3. 5.2.7.3 Key Developments
        4. 5.2.7.4 SWOT Analysis
        5. 5.2.7.5 Key Strategies
      8. 5.2.8 Advantech (TW)
        1. 5.2.8.1 Financial Overview
        2. 5.2.8.2 Products Offered
        3. 5.2.8.3 Key Developments
        4. 5.2.8.4 SWOT Analysis
        5. 5.2.8.5 Key Strategies
      9. 5.2.9 Cisco (US)
        1. 5.2.9.1 Financial Overview
        2. 5.2.9.2 Products Offered
        3. 5.2.9.3 Key Developments
        4. 5.2.9.4 SWOT Analysis
        5. 5.2.9.5 Key Strategies
    3. 5.3 Appendix
      1. 5.3.1 References
      2. 5.3.2 Related Reports
  6. 6 LIST OF FIGURES
    1. 6.1 MARKET SYNOPSIS
    2. 6.2 SOUTH KOREA MARKET ANALYSIS BY PROTOCOL
    3. 6.3 SOUTH KOREA MARKET ANALYSIS BY APPLICATION
    4. 6.4 SOUTH KOREA MARKET ANALYSIS BY END-USE
    5. 6.5 SOUTH KOREA MARKET ANALYSIS BY COMPONENT
    6. 6.6 KEY BUYING CRITERIA OF INFORMATION AND COMMUNICATIONS TECHNOLOGY
    7. 6.7 RESEARCH PROCESS OF MRFR
    8. 6.8 DRO ANALYSIS OF INFORMATION AND COMMUNICATIONS TECHNOLOGY
    9. 6.9 DRIVERS IMPACT ANALYSIS: INFORMATION AND COMMUNICATIONS TECHNOLOGY
    10. 6.10 RESTRAINTS IMPACT ANALYSIS: INFORMATION AND COMMUNICATIONS TECHNOLOGY
    11. 6.11 SUPPLY / VALUE CHAIN: INFORMATION AND COMMUNICATIONS TECHNOLOGY
    12. 6.12 INFORMATION AND COMMUNICATIONS TECHNOLOGY, BY PROTOCOL, 2024 (% SHARE)
    13. 6.13 INFORMATION AND COMMUNICATIONS TECHNOLOGY, BY PROTOCOL, 2024 TO 2035 (USD Million)
    14. 6.14 INFORMATION AND COMMUNICATIONS TECHNOLOGY, BY APPLICATION, 2024 (% SHARE)
    15. 6.15 INFORMATION AND COMMUNICATIONS TECHNOLOGY, BY APPLICATION, 2024 TO 2035 (USD Million)
    16. 6.16 INFORMATION AND COMMUNICATIONS TECHNOLOGY, BY END-USE, 2024 (% SHARE)
    17. 6.17 INFORMATION AND COMMUNICATIONS TECHNOLOGY, BY END-USE, 2024 TO 2035 (USD Million)
    18. 6.18 INFORMATION AND COMMUNICATIONS TECHNOLOGY, BY COMPONENT, 2024 (% SHARE)
    19. 6.19 INFORMATION AND COMMUNICATIONS TECHNOLOGY, BY COMPONENT, 2024 TO 2035 (USD Million)
    20. 6.20 BENCHMARKING OF MAJOR COMPETITORS
  7. 7 LIST OF TABLES
    1. 7.1 LIST OF ASSUMPTIONS
  8. 7.1.1
    1. 7.2 South Korea MARKET SIZE ESTIMATES; FORECAST
      1. 7.2.1 BY PROTOCOL, 2025-2035 (USD Million)
      2. 7.2.2 BY APPLICATION, 2025-2035 (USD Million)
      3. 7.2.3 BY END-USE, 2025-2035 (USD Million)
      4. 7.2.4 BY COMPONENT, 2025-2035 (USD Million)
    2. 7.3 PRODUCT LAUNCH/PRODUCT DEVELOPMENT/APPROVAL
  9. 7.3.1
    1. 7.4 ACQUISITION/PARTNERSHIP
  10. 7.4.1

South Korea Information and Communications Technology Market Segmentation

Information and Communications Technology By Protocol (USD Million, 2025-2035)

  • Ethernet/IP
  • PROFINET
  • EtherCAT
  • Modbus TCP
  • SERCOS

Information and Communications Technology By Application (USD Million, 2025-2035)

  • Manufacturing Automation
  • Process Automation
  • Transportation Systems
  • Energy and Utilities
  • Building Automation

Information and Communications Technology By End-use (USD Million, 2025-2035)

  • Automotive
  • Electronics
  • Oil and Gas
  • Food and Beverage
  • Pharmaceuticals

Information and Communications Technology By Component (USD Million, 2025-2035)

  • Switches
  • Routers
  • Cables
  • Gateways
  • I/O Devices

Compare Licence

×
Features License Type
Single User Multiuser License Enterprise User
Price $4,950 $5,950 $7,250
Maximum User Access Limit 1 User Upto 10 Users Unrestricted Access Throughout the Organization
Free Customization
Direct Access to Analyst
Deliverable Format
Platform Access
Discount on Next Purchase 10% 15% 15%
Printable Versions