South Korea Construction Market Segmentation
Construction By Type (USD Million, 2025-2035)
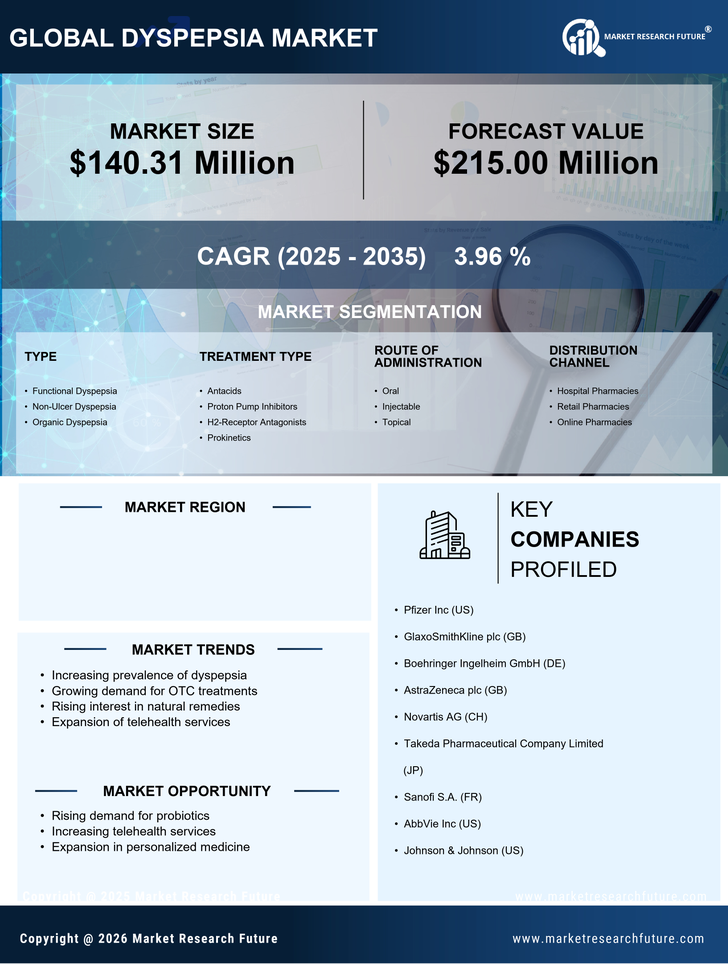
- Functional Dyspepsia
- Non-Ulcer Dyspepsia
- Organic Dyspepsia
Construction By Treatment Type (USD Million, 2025-2035)
- Antacids
- Proton Pump Inhibitors
- H2-Receptor Antagonists
- Prokinetics
Construction By Route of Administration (USD Million, 2025-2035)
- Oral
- Injectable
- Topical
Construction By Distribution Channel (USD Million, 2025-2035)
- Hospital Pharmacies
- Retail Pharmacies
- Online Pharmacies