Request Free Sample ×

Kindly complete the form below to receive a free sample of this Report

* Please use a valid business email

Leading companies partner with us for data-driven Insights

clients tt-cursor
Hero Background

South America Sturge Weber Syndrome Market

ID: MRFR/HC/51518-HCR
200 Pages
Vikita Thakur
Last Updated: March 28, 2026

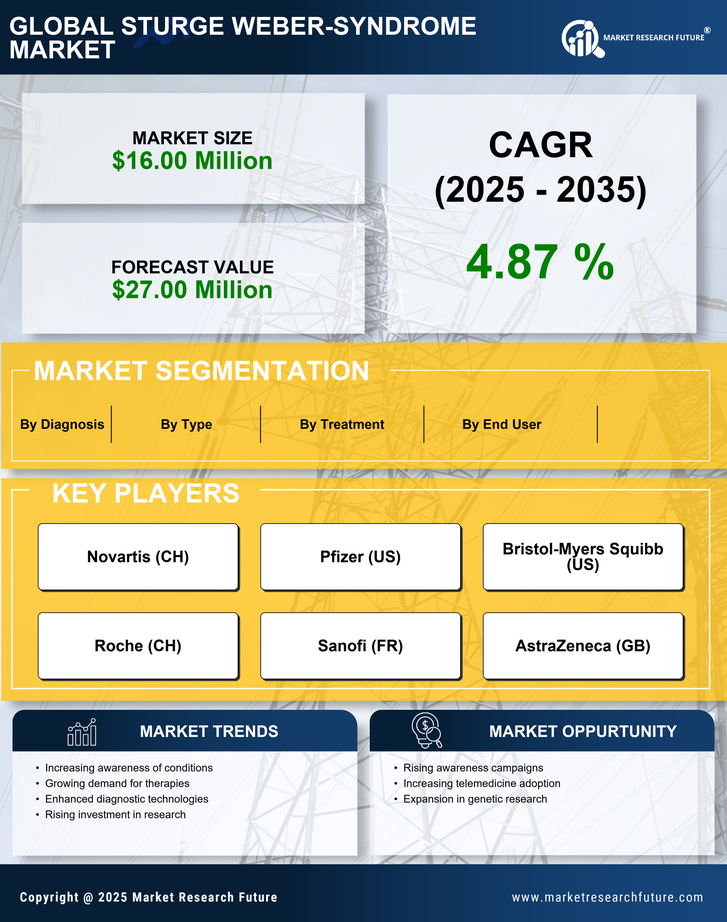
South America Sturge-Weber Syndrome Market Research Report By Type (Type I, Type II, Type III), By End User (Clinics and Hospitals, Diagnostic Centres, Others), By Diagnosis (Electroencephalogram (EEG), Skull Radiography, Computer Tomography (CT) Scan, Magnetic Resonance Imaging (MRI)), By Treatment (Surgical Procedure, Laser Therapy, Medication), By Medication Type (Antiglaucoma, Carbonic Anhydrase Inhibitors, Beta Antagonist Eye Drops, Latanoprost, Antiepileptic), and By Regional (Brazil, Mexico, Argentina, Rest of South America) -Forecast to 2035

Share:
Download PDF ×

We do not share your information with anyone. However, we may send you emails based on your report interest from time to time. You may contact us at any time to opt-out.

South America Sturge Weber Syndrome Market Infographic
Purchase Options
  1. 1 SECTION I: EXECUTIVE SUMMARY AND KEY HIGHLIGHTS
    1. 1.1 EXECUTIVE SUMMARY
      1. 1.1.1 Market Overview
      2. 1.1.2 Key Findings
      3. 1.1.3 Market Segmentation
      4. 1.1.4 Competitive Landscape
      5. 1.1.5 Challenges and Opportunities
      6. 1.1.6 Future Outlook
  2. 2 SECTION II: SCOPING, METHODOLOGY AND MARKET STRUCTURE
    1. 2.1 MARKET INTRODUCTION
      1. 2.1.1 Definition
      2. 2.1.2 Scope of the study
        1. 2.1.2.1 Research Objective
        2. 2.1.2.2 Assumption
        3. 2.1.2.3 Limitations
    2. 2.2 RESEARCH METHODOLOGY
      1. 2.2.1 Overview
      2. 2.2.2 Data Mining
      3. 2.2.3 Secondary Research
      4. 2.2.4 Primary Research
        1. 2.2.4.1 Primary Interviews and Information Gathering Process
        2. 2.2.4.2 Breakdown of Primary Respondents
      5. 2.2.5 Forecasting Model
      6. 2.2.6 Market Size Estimation
        1. 2.2.6.1 Bottom-Up Approach
        2. 2.2.6.2 Top-Down Approach
      7. 2.2.7 Data Triangulation
      8. 2.2.8 Validation
  3. 3 SECTION III: QUALITATIVE ANALYSIS
    1. 3.1 MARKET DYNAMICS
      1. 3.1.1 Overview
      2. 3.1.2 Drivers
      3. 3.1.3 Restraints
      4. 3.1.4 Opportunities
    2. 3.2 MARKET FACTOR ANALYSIS
      1. 3.2.1 Value chain Analysis
      2. 3.2.2 Porter's Five Forces Analysis
        1. 3.2.2.1 Bargaining Power of Suppliers
        2. 3.2.2.2 Bargaining Power of Buyers
        3. 3.2.2.3 Threat of New Entrants
        4. 3.2.2.4 Threat of Substitutes
        5. 3.2.2.5 Intensity of Rivalry
      3. 3.2.3 COVID-19 Impact Analysis
        1. 3.2.3.1 Market Impact Analysis
        2. 3.2.3.2 Regional Impact
        3. 3.2.3.3 Opportunity and Threat Analysis
  4. 4 SECTION IV: QUANTITATIVE ANALYSIS
    1. 4.1 Healthcare, BY Type (USD Million)
      1. 4.1.1 Type 1
      2. 4.1.2 Type 2
      3. 4.1.3 Type 3
    2. 4.2 Healthcare, BY End User (USD Million)
      1. 4.2.1 Diagnostic Centres
      2. 4.2.2 Clinics and Hospitals
      3. 4.2.3 Others
    3. 4.3 Healthcare, BY Treatment (USD Million)
      1. 4.3.1 Surgical Procedure
      2. 4.3.2 Laser Therapy
    4. 4.4 Healthcare, BY Diagnosis (USD Million)
      1. 4.4.1 Skull Radiography
      2. 4.4.2 Magnetic Resonance Imaging (MRI)
      3. 4.4.3 Electroencephalogram
      4. 4.4.4 Computed Topography
  5. 5 SECTION V: COMPETITIVE ANALYSIS
    1. 5.1 Competitive Landscape
      1. 5.1.1 Overview
      2. 5.1.2 Competitive Analysis
      3. 5.1.3 Market share Analysis
      4. 5.1.4 Major Growth Strategy in the Healthcare
      5. 5.1.5 Competitive Benchmarking
      6. 5.1.6 Leading Players in Terms of Number of Developments in the Healthcare
      7. 5.1.7 Key developments and growth strategies
        1. 5.1.7.1 New Product Launch/Service Deployment
        2. 5.1.7.2 Merger & Acquisitions
        3. 5.1.7.3 Joint Ventures
      8. 5.1.8 Major Players Financial Matrix
        1. 5.1.8.1 Sales and Operating Income
        2. 5.1.8.2 Major Players R&D Expenditure. 2023
    2. 5.2 Company Profiles
      1. 5.2.1 Novartis (CH)
        1. 5.2.1.1 Financial Overview
        2. 5.2.1.2 Products Offered
        3. 5.2.1.3 Key Developments
        4. 5.2.1.4 SWOT Analysis
        5. 5.2.1.5 Key Strategies
      2. 5.2.2 Pfizer (US)
        1. 5.2.2.1 Financial Overview
        2. 5.2.2.2 Products Offered
        3. 5.2.2.3 Key Developments
        4. 5.2.2.4 SWOT Analysis
        5. 5.2.2.5 Key Strategies
      3. 5.2.3 Bristol-Myers Squibb (US)
        1. 5.2.3.1 Financial Overview
        2. 5.2.3.2 Products Offered
        3. 5.2.3.3 Key Developments
        4. 5.2.3.4 SWOT Analysis
        5. 5.2.3.5 Key Strategies
      4. 5.2.4 Roche (CH)
        1. 5.2.4.1 Financial Overview
        2. 5.2.4.2 Products Offered
        3. 5.2.4.3 Key Developments
        4. 5.2.4.4 SWOT Analysis
        5. 5.2.4.5 Key Strategies
      5. 5.2.5 Sanofi (FR)
        1. 5.2.5.1 Financial Overview
        2. 5.2.5.2 Products Offered
        3. 5.2.5.3 Key Developments
        4. 5.2.5.4 SWOT Analysis
        5. 5.2.5.5 Key Strategies
      6. 5.2.6 AstraZeneca (GB)
        1. 5.2.6.1 Financial Overview
        2. 5.2.6.2 Products Offered
        3. 5.2.6.3 Key Developments
        4. 5.2.6.4 SWOT Analysis
        5. 5.2.6.5 Key Strategies
      7. 5.2.7 Eli Lilly and Company (US)
        1. 5.2.7.1 Financial Overview
        2. 5.2.7.2 Products Offered
        3. 5.2.7.3 Key Developments
        4. 5.2.7.4 SWOT Analysis
        5. 5.2.7.5 Key Strategies
      8. 5.2.8 Teva Pharmaceutical Industries (IL)
        1. 5.2.8.1 Financial Overview
        2. 5.2.8.2 Products Offered
        3. 5.2.8.3 Key Developments
        4. 5.2.8.4 SWOT Analysis
        5. 5.2.8.5 Key Strategies
    3. 5.3 Appendix
      1. 5.3.1 References
      2. 5.3.2 Related Reports
  6. 6 LIST OF FIGURES
    1. 6.1 MARKET SYNOPSIS
    2. 6.2 SOUTH AMERICA MARKET ANALYSIS BY TYPE
    3. 6.3 SOUTH AMERICA MARKET ANALYSIS BY END USER
    4. 6.4 SOUTH AMERICA MARKET ANALYSIS BY TREATMENT
    5. 6.5 SOUTH AMERICA MARKET ANALYSIS BY DIAGNOSIS
    6. 6.6 KEY BUYING CRITERIA OF HEALTHCARE
    7. 6.7 RESEARCH PROCESS OF MRFR
    8. 6.8 DRO ANALYSIS OF HEALTHCARE
    9. 6.9 DRIVERS IMPACT ANALYSIS: HEALTHCARE
    10. 6.10 RESTRAINTS IMPACT ANALYSIS: HEALTHCARE
    11. 6.11 SUPPLY / VALUE CHAIN: HEALTHCARE
    12. 6.12 HEALTHCARE, BY TYPE, 2024 (% SHARE)
    13. 6.13 HEALTHCARE, BY TYPE, 2024 TO 2035 (USD Million)
    14. 6.14 HEALTHCARE, BY END USER, 2024 (% SHARE)
    15. 6.15 HEALTHCARE, BY END USER, 2024 TO 2035 (USD Million)
    16. 6.16 HEALTHCARE, BY TREATMENT, 2024 (% SHARE)
    17. 6.17 HEALTHCARE, BY TREATMENT, 2024 TO 2035 (USD Million)
    18. 6.18 HEALTHCARE, BY DIAGNOSIS, 2024 (% SHARE)
    19. 6.19 HEALTHCARE, BY DIAGNOSIS, 2024 TO 2035 (USD Million)
    20. 6.20 BENCHMARKING OF MAJOR COMPETITORS
  7. 7 LIST OF TABLES
    1. 7.1 LIST OF ASSUMPTIONS
  8. 7.1.1
    1. 7.2 South America MARKET SIZE ESTIMATES; FORECAST
      1. 7.2.1 BY TYPE, 2025-2035 (USD Million)
      2. 7.2.2 BY END USER, 2025-2035 (USD Million)
      3. 7.2.3 BY TREATMENT, 2025-2035 (USD Million)
      4. 7.2.4 BY DIAGNOSIS, 2025-2035 (USD Million)
    2. 7.3 PRODUCT LAUNCH/PRODUCT DEVELOPMENT/APPROVAL
  9. 7.3.1
    1. 7.4 ACQUISITION/PARTNERSHIP
  10. 7.4.1

South America Healthcare Market Segmentation

Healthcare By Type (USD Million, 2025-2035)

  • Type 1
  • Type 2
  • Type 3

Healthcare By End User (USD Million, 2025-2035)

  • Diagnostic Centres
  • Clinics and Hospitals
  • Others

Healthcare By Treatment (USD Million, 2025-2035)

  • Surgical Procedure
  • Laser Therapy

Healthcare By Diagnosis (USD Million, 2025-2035)

  • Skull Radiography
  • Magnetic Resonance Imaging (MRI)
  • Electroencephalogram
  • Computed Topography

Compare Licence

×
Features License Type
Single User Multiuser License Enterprise User
Price $4,950 $5,950 $7,250
Maximum User Access Limit 1 User Upto 10 Users Unrestricted Access Throughout the Organization
Free Customization
Direct Access to Analyst
Deliverable Format
Platform Access
Discount on Next Purchase 10% 15% 15%
Printable Versions