Request Free Sample ×

Kindly complete the form below to receive a free sample of this Report

* Please use a valid business email

Leading companies partner with us for data-driven Insights

clients tt-cursor
Hero Background

South America Soft Tissue Repair Market

ID: MRFR/HC/48886-HCR
200 Pages
Vikita Thakur
Last Updated: April 06, 2026

South America Soft Tissue Repair Market Research Report By Application (Orthopedics, Cardiovascular, Neurology, General Surgery), By Material (Sutures, Mesh, Adhesives, Grafts), By Procedure Type (Open Surgery, Minimally Invasive Surgery, Robotic Surgery), By End Use (Hospitals, Ambulatory Surgical Centers, Specialty Clinics) and By Regional (Brazil, Mexico, Argentina, Rest of South America) - Growth & Industry Forecast 2025 To 2035

Share:
Download PDF ×

We do not share your information with anyone. However, we may send you emails based on your report interest from time to time. You may contact us at any time to opt-out.

South America Soft Tissue Repair Market Infographic
Purchase Options
  1. 1 SECTION I: EXECUTIVE SUMMARY AND KEY HIGHLIGHTS
  2.   1.1 EXECUTIVE SUMMARY
  3.     1.1.1 Market Overview
  4.     1.1.2 Key Findings
  5.     1.1.3 Market Segmentation
  6.     1.1.4 Competitive Landscape
  7.     1.1.5 Challenges and Opportunities
  8.     1.1.6 Future Outlook
  9. 2 SECTION II: SCOPING, METHODOLOGY AND MARKET STRUCTURE
  10.   2.1 MARKET INTRODUCTION
  11.     2.1.1 Definition
  12.     2.1.2 Scope of the study
  13.       2.1.2.1 Research Objective
  14.       2.1.2.2 Assumption
  15.       2.1.2.3 Limitations
  16.   2.2 RESEARCH METHODOLOGY
  17.     2.2.1 Overview
  18.     2.2.2 Data Mining
  19.     2.2.3 Secondary Research
  20.     2.2.4 Primary Research
  21.       2.2.4.1 Primary Interviews and Information Gathering Process
  22.       2.2.4.2 Breakdown of Primary Respondents
  23.     2.2.5 Forecasting Model
  24.     2.2.6 Market Size Estimation
  25.       2.2.6.1 Bottom-Up Approach
  26.       2.2.6.2 Top-Down Approach
  27.     2.2.7 Data Triangulation
  28.     2.2.8 Validation
  29. 3 SECTION III: QUALITATIVE ANALYSIS
  30.   3.1 MARKET DYNAMICS
  31.     3.1.1 Overview
  32.     3.1.2 Drivers
  33.     3.1.3 Restraints
  34.     3.1.4 Opportunities
  35.   3.2 MARKET FACTOR ANALYSIS
  36.     3.2.1 Value chain Analysis
  37.     3.2.2 Porter's Five Forces Analysis
  38.       3.2.2.1 Bargaining Power of Suppliers
  39.       3.2.2.2 Bargaining Power of Buyers
  40.       3.2.2.3 Threat of New Entrants
  41.       3.2.2.4 Threat of Substitutes
  42.       3.2.2.5 Intensity of Rivalry
  43.     3.2.3 COVID-19 Impact Analysis
  44.       3.2.3.1 Market Impact Analysis
  45.       3.2.3.2 Regional Impact
  46.       3.2.3.3 Opportunity and Threat Analysis
  47. 4 SECTION IV: QUANTITATIVE ANALYSIS
  48.   4.1 Healthcare, BY Application (USD Billion)
  49.     4.1.1 Orthopedic Surgery
  50.     4.1.2 General Surgery
  51.     4.1.3 Plastic Surgery
  52.     4.1.4 Trauma Surgery
  53.   4.2 Healthcare, BY Product Type (USD Billion)
  54.     4.2.1 Sutures
  55.     4.2.2 Staples
  56.     4.2.3 Tissue Adhesives
  57.     4.2.4 Wound Closure Strips
  58.   4.3 Healthcare, BY End Use (USD Billion)
  59.     4.3.1 Hospitals
  60.     4.3.2 Ambulatory Surgical Centers
  61.     4.3.3 Specialty Clinics
  62.   4.4 Healthcare, BY Material Type (USD Billion)
  63.     4.4.1 Natural Materials
  64.     4.4.2 Synthetic Materials
  65.     4.4.3 Biodegradable Materials
  66.   4.5 Healthcare, BY Distribution Channel (USD Billion)
  67.     4.5.1 Direct Sales
  68.     4.5.2 Online Sales
  69.     4.5.3 Distributors
  70. 5 SECTION V: COMPETITIVE ANALYSIS
  71.   5.1 Competitive Landscape
  72.     5.1.1 Overview
  73.     5.1.2 Competitive Analysis
  74.     5.1.3 Market share Analysis
  75.     5.1.4 Major Growth Strategy in the Healthcare
  76.     5.1.5 Competitive Benchmarking
  77.     5.1.6 Leading Players in Terms of Number of Developments in the Healthcare
  78.     5.1.7 Key developments and growth strategies
  79.       5.1.7.1 New Product Launch/Service Deployment
  80.       5.1.7.2 Merger & Acquisitions
  81.       5.1.7.3 Joint Ventures
  82.     5.1.8 Major Players Financial Matrix
  83.       5.1.8.1 Sales and Operating Income
  84.       5.1.8.2 Major Players R&D Expenditure. 2023
  85.   5.2 Company Profiles
  86.     5.2.1 Medtronic (US)
  87.       5.2.1.1 Financial Overview
  88.       5.2.1.2 Products Offered
  89.       5.2.1.3 Key Developments
  90.       5.2.1.4 SWOT Analysis
  91.       5.2.1.5 Key Strategies
  92.     5.2.2 Johnson & Johnson (US)
  93.       5.2.2.1 Financial Overview
  94.       5.2.2.2 Products Offered
  95.       5.2.2.3 Key Developments
  96.       5.2.2.4 SWOT Analysis
  97.       5.2.2.5 Key Strategies
  98.     5.2.3 Stryker (US)
  99.       5.2.3.1 Financial Overview
  100.       5.2.3.2 Products Offered
  101.       5.2.3.3 Key Developments
  102.       5.2.3.4 SWOT Analysis
  103.       5.2.3.5 Key Strategies
  104.     5.2.4 Smith & Nephew (GB)
  105.       5.2.4.1 Financial Overview
  106.       5.2.4.2 Products Offered
  107.       5.2.4.3 Key Developments
  108.       5.2.4.4 SWOT Analysis
  109.       5.2.4.5 Key Strategies
  110.     5.2.5 B. Braun Melsungen AG (DE)
  111.       5.2.5.1 Financial Overview
  112.       5.2.5.2 Products Offered
  113.       5.2.5.3 Key Developments
  114.       5.2.5.4 SWOT Analysis
  115.       5.2.5.5 Key Strategies
  116.     5.2.6 Zimmer Biomet (US)
  117.       5.2.6.1 Financial Overview
  118.       5.2.6.2 Products Offered
  119.       5.2.6.3 Key Developments
  120.       5.2.6.4 SWOT Analysis
  121.       5.2.6.5 Key Strategies
  122.     5.2.7 Boston Scientific (US)
  123.       5.2.7.1 Financial Overview
  124.       5.2.7.2 Products Offered
  125.       5.2.7.3 Key Developments
  126.       5.2.7.4 SWOT Analysis
  127.       5.2.7.5 Key Strategies
  128.     5.2.8 Conmed Corporation (US)
  129.       5.2.8.1 Financial Overview
  130.       5.2.8.2 Products Offered
  131.       5.2.8.3 Key Developments
  132.       5.2.8.4 SWOT Analysis
  133.       5.2.8.5 Key Strategies
  134.   5.3 Appendix
  135.     5.3.1 References
  136.     5.3.2 Related Reports
  137. 6 LIST OF FIGURES
  138.   6.1 MARKET SYNOPSIS
  139.   6.2 SOUTH AMERICA MARKET ANALYSIS BY APPLICATION
  140.   6.3 SOUTH AMERICA MARKET ANALYSIS BY PRODUCT TYPE
  141.   6.4 SOUTH AMERICA MARKET ANALYSIS BY END USE
  142.   6.5 SOUTH AMERICA MARKET ANALYSIS BY MATERIAL TYPE
  143.   6.6 SOUTH AMERICA MARKET ANALYSIS BY DISTRIBUTION CHANNEL
  144.   6.7 KEY BUYING CRITERIA OF HEALTHCARE
  145.   6.8 RESEARCH PROCESS OF MRFR
  146.   6.9 DRO ANALYSIS OF HEALTHCARE
  147.   6.10 DRIVERS IMPACT ANALYSIS: HEALTHCARE
  148.   6.11 RESTRAINTS IMPACT ANALYSIS: HEALTHCARE
  149.   6.12 SUPPLY / VALUE CHAIN: HEALTHCARE
  150.   6.13 HEALTHCARE, BY APPLICATION, 2024 (% SHARE)
  151.   6.14 HEALTHCARE, BY APPLICATION, 2024 TO 2035 (USD Billion)
  152.   6.15 HEALTHCARE, BY PRODUCT TYPE, 2024 (% SHARE)
  153.   6.16 HEALTHCARE, BY PRODUCT TYPE, 2024 TO 2035 (USD Billion)
  154.   6.17 HEALTHCARE, BY END USE, 2024 (% SHARE)
  155.   6.18 HEALTHCARE, BY END USE, 2024 TO 2035 (USD Billion)
  156.   6.19 HEALTHCARE, BY MATERIAL TYPE, 2024 (% SHARE)
  157.   6.20 HEALTHCARE, BY MATERIAL TYPE, 2024 TO 2035 (USD Billion)
  158.   6.21 HEALTHCARE, BY DISTRIBUTION CHANNEL, 2024 (% SHARE)
  159.   6.22 HEALTHCARE, BY DISTRIBUTION CHANNEL, 2024 TO 2035 (USD Billion)
  160.   6.23 BENCHMARKING OF MAJOR COMPETITORS
  161. 7 LIST OF TABLES
  162.   7.1 LIST OF ASSUMPTIONS
  163.     7.1.1
  164.   7.2 South America MARKET SIZE ESTIMATES; FORECAST
  165.     7.2.1 BY APPLICATION, 2026-2035 (USD Billion)
  166.     7.2.2 BY PRODUCT TYPE, 2026-2035 (USD Billion)
  167.     7.2.3 BY END USE, 2026-2035 (USD Billion)
  168.     7.2.4 BY MATERIAL TYPE, 2026-2035 (USD Billion)
  169.     7.2.5 BY DISTRIBUTION CHANNEL, 2026-2035 (USD Billion)
  170.   7.3 PRODUCT LAUNCH/PRODUCT DEVELOPMENT/APPROVAL
  171.     7.3.1
  172.   7.4 ACQUISITION/PARTNERSHIP
  173.     7.4.1

South America Healthcare Market Segmentation

Healthcare By Application (USD Billion, 2022-2035)
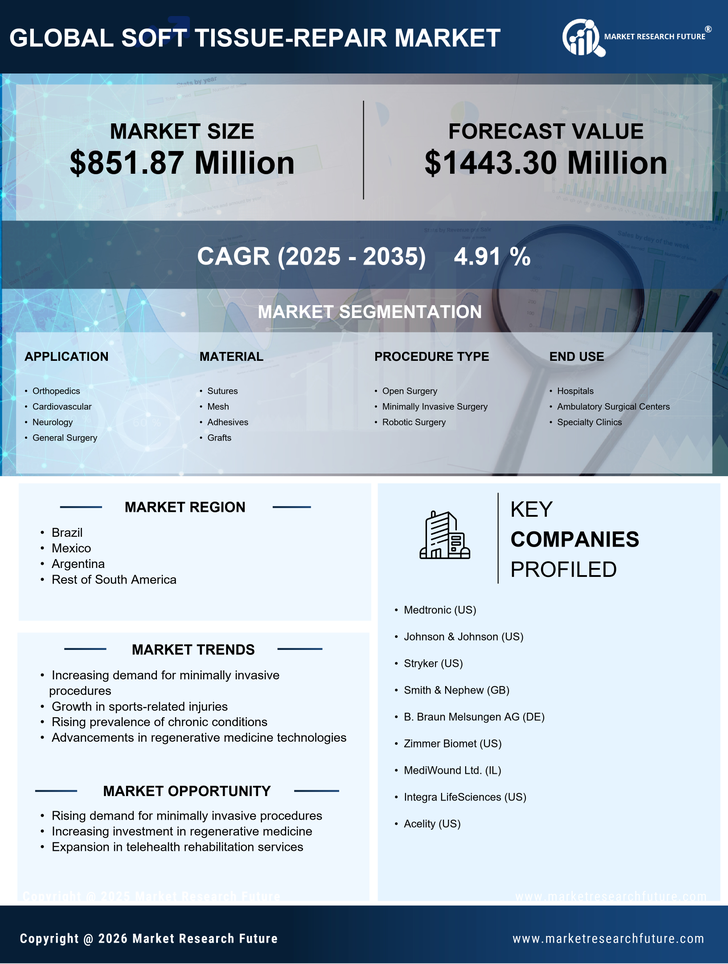
  • Orthopedic Surgery
  • General Surgery
  • Plastic Surgery
  • Trauma Surgery

Healthcare By Product Type (USD Billion, 2022-2035)

  • Sutures
  • Staples
  • Tissue Adhesives
  • Wound Closure Strips

Healthcare By End Use (USD Billion, 2022-2035)

  • Hospitals
  • Ambulatory Surgical Centers
  • Specialty Clinics

Healthcare By Material Type (USD Billion, 2022-2035)

  • Natural Materials
  • Synthetic Materials
  • Biodegradable Materials

Healthcare By Distribution Channel (USD Billion, 2022-2035)

  • Direct Sales
  • Online Sales
  • Distributors

Compare Licence

×
Features License Type
Single User Multiuser License Enterprise User
Price $4,950 $5,950 $7,250
Maximum User Access Limit 1 User Upto 10 Users Unrestricted Access Throughout the Organization
Free Customization
Direct Access to Analyst
Deliverable Format
Platform Access
Discount on Next Purchase 10% 15% 15%
Printable Versions