Request Free Sample ×

Kindly complete the form below to receive a free sample of this Report

* Please use a valid business email

Leading companies partner with us for data-driven Insights

clients tt-cursor
Hero Background

South America Interventional Radiology Products Market

ID: MRFR/HC/49721-HCR
200 Pages
Rahul Gotadki
Last Updated: February 06, 2026

South America Interventional Radiology Products Market Research Report By Product Type (Catheters, Guide Wires, Embolic Agents, Radiology Visualization Systems, Ablation Devices), By Procedure Type (Angiography, Biliary Interventions, Biopsy, Drainage Procedures, Ablation), By End User (Hospitals, Ambulatory Surgical Centers, Diagnostic Imaging Centers), By Application (Oncology, Cardiology, Urology, Neurology) and By Regional (Brazil, Mexico, Argentina, Rest of South America) - Growth & Industry Forecast 2025 To 2035

Share:
Download PDF ×

We do not share your information with anyone. However, we may send you emails based on your report interest from time to time. You may contact us at any time to opt-out.

South America Interventional Radiology Products Market Infographic
Purchase Options
  1. 1 SECTION I: EXECUTIVE SUMMARY AND KEY HIGHLIGHTS
  2.   1.1 EXECUTIVE SUMMARY
  3.     1.1.1 Market Overview
  4.     1.1.2 Key Findings
  5.     1.1.3 Market Segmentation
  6.     1.1.4 Competitive Landscape
  7.     1.1.5 Challenges and Opportunities
  8.     1.1.6 Future Outlook
  9. 2 SECTION II: SCOPING, METHODOLOGY AND MARKET STRUCTURE
  10.   2.1 MARKET INTRODUCTION
  11.     2.1.1 Definition
  12.     2.1.2 Scope of the study
  13.       2.1.2.1 Research Objective
  14.       2.1.2.2 Assumption
  15.       2.1.2.3 Limitations
  16.   2.2 RESEARCH METHODOLOGY
  17.     2.2.1 Overview
  18.     2.2.2 Data Mining
  19.     2.2.3 Secondary Research
  20.     2.2.4 Primary Research
  21.       2.2.4.1 Primary Interviews and Information Gathering Process
  22.       2.2.4.2 Breakdown of Primary Respondents
  23.     2.2.5 Forecasting Model
  24.     2.2.6 Market Size Estimation
  25.       2.2.6.1 Bottom-Up Approach
  26.       2.2.6.2 Top-Down Approach
  27.     2.2.7 Data Triangulation
  28.     2.2.8 Validation
  29. 3 SECTION III: QUALITATIVE ANALYSIS
  30.   3.1 MARKET DYNAMICS
  31.     3.1.1 Overview
  32.     3.1.2 Drivers
  33.     3.1.3 Restraints
  34.     3.1.4 Opportunities
  35.   3.2 MARKET FACTOR ANALYSIS
  36.     3.2.1 Value chain Analysis
  37.     3.2.2 Porter's Five Forces Analysis
  38.       3.2.2.1 Bargaining Power of Suppliers
  39.       3.2.2.2 Bargaining Power of Buyers
  40.       3.2.2.3 Threat of New Entrants
  41.       3.2.2.4 Threat of Substitutes
  42.       3.2.2.5 Intensity of Rivalry
  43.     3.2.3 COVID-19 Impact Analysis
  44.       3.2.3.1 Market Impact Analysis
  45.       3.2.3.2 Regional Impact
  46.       3.2.3.3 Opportunity and Threat Analysis
  47. 4 SECTION IV: QUANTITATIVE ANALYSIS
  48.   4.1 Medical Device, BY Product Type (USD Million)
  49.     4.1.1 Catheters
  50.     4.1.2 Guide Wires
  51.     4.1.3 Embolic Agents
  52.     4.1.4 Radiology Visualization Systems
  53.     4.1.5 Ablation Devices
  54.   4.2 Medical Device, BY Procedure Type (USD Million)
  55.     4.2.1 Angiography
  56.     4.2.2 Biliary Interventions
  57.     4.2.3 Biopsy
  58.     4.2.4 Drainage Procedures
  59.     4.2.5 Ablation
  60.   4.3 Medical Device, BY End User (USD Million)
  61.     4.3.1 Hospitals
  62.     4.3.2 Ambulatory Surgical Centers
  63.     4.3.3 Diagnostic Imaging Centers
  64.   4.4 Medical Device, BY Application (USD Million)
  65.     4.4.1 Oncology
  66.     4.4.2 Cardiology
  67.     4.4.3 Urology
  68.     4.4.4 Neurology
  69. 5 SECTION V: COMPETITIVE ANALYSIS
  70.   5.1 Competitive Landscape
  71.     5.1.1 Overview
  72.     5.1.2 Competitive Analysis
  73.     5.1.3 Market share Analysis
  74.     5.1.4 Major Growth Strategy in the Medical Device
  75.     5.1.5 Competitive Benchmarking
  76.     5.1.6 Leading Players in Terms of Number of Developments in the Medical Device
  77.     5.1.7 Key developments and growth strategies
  78.       5.1.7.1 New Product Launch/Service Deployment
  79.       5.1.7.2 Merger & Acquisitions
  80.       5.1.7.3 Joint Ventures
  81.     5.1.8 Major Players Financial Matrix
  82.       5.1.8.1 Sales and Operating Income
  83.       5.1.8.2 Major Players R&D Expenditure. 2023
  84.   5.2 Company Profiles
  85.     5.2.1 Medtronic (US)
  86.       5.2.1.1 Financial Overview
  87.       5.2.1.2 Products Offered
  88.       5.2.1.3 Key Developments
  89.       5.2.1.4 SWOT Analysis
  90.       5.2.1.5 Key Strategies
  91.     5.2.2 Boston Scientific (US)
  92.       5.2.2.1 Financial Overview
  93.       5.2.2.2 Products Offered
  94.       5.2.2.3 Key Developments
  95.       5.2.2.4 SWOT Analysis
  96.       5.2.2.5 Key Strategies
  97.     5.2.3 Siemens Healthineers (DE)
  98.       5.2.3.1 Financial Overview
  99.       5.2.3.2 Products Offered
  100.       5.2.3.3 Key Developments
  101.       5.2.3.4 SWOT Analysis
  102.       5.2.3.5 Key Strategies
  103.     5.2.4 Johnson & Johnson (US)
  104.       5.2.4.1 Financial Overview
  105.       5.2.4.2 Products Offered
  106.       5.2.4.3 Key Developments
  107.       5.2.4.4 SWOT Analysis
  108.       5.2.4.5 Key Strategies
  109.     5.2.5 Abbott Laboratories (US)
  110.       5.2.5.1 Financial Overview
  111.       5.2.5.2 Products Offered
  112.       5.2.5.3 Key Developments
  113.       5.2.5.4 SWOT Analysis
  114.       5.2.5.5 Key Strategies
  115.     5.2.6 Bayer AG (DE)
  116.       5.2.6.1 Financial Overview
  117.       5.2.6.2 Products Offered
  118.       5.2.6.3 Key Developments
  119.       5.2.6.4 SWOT Analysis
  120.       5.2.6.5 Key Strategies
  121.     5.2.7 Terumo Corporation (JP)
  122.       5.2.7.1 Financial Overview
  123.       5.2.7.2 Products Offered
  124.       5.2.7.3 Key Developments
  125.       5.2.7.4 SWOT Analysis
  126.       5.2.7.5 Key Strategies
  127.     5.2.8 Cook Medical (US)
  128.       5.2.8.1 Financial Overview
  129.       5.2.8.2 Products Offered
  130.       5.2.8.3 Key Developments
  131.       5.2.8.4 SWOT Analysis
  132.       5.2.8.5 Key Strategies
  133.     5.2.9 Philips Healthcare (NL)
  134.       5.2.9.1 Financial Overview
  135.       5.2.9.2 Products Offered
  136.       5.2.9.3 Key Developments
  137.       5.2.9.4 SWOT Analysis
  138.       5.2.9.5 Key Strategies
  139.   5.3 Appendix
  140.     5.3.1 References
  141.     5.3.2 Related Reports
  142. 6 LIST OF FIGURES
  143.   6.1 MARKET SYNOPSIS
  144.   6.2 SOUTH AMERICA MARKET ANALYSIS BY PRODUCT TYPE
  145.   6.3 SOUTH AMERICA MARKET ANALYSIS BY PROCEDURE TYPE
  146.   6.4 SOUTH AMERICA MARKET ANALYSIS BY END USER
  147.   6.5 SOUTH AMERICA MARKET ANALYSIS BY APPLICATION
  148.   6.6 KEY BUYING CRITERIA OF MEDICAL DEVICE
  149.   6.7 RESEARCH PROCESS OF MRFR
  150.   6.8 DRO ANALYSIS OF MEDICAL DEVICE
  151.   6.9 DRIVERS IMPACT ANALYSIS: MEDICAL DEVICE
  152.   6.10 RESTRAINTS IMPACT ANALYSIS: MEDICAL DEVICE
  153.   6.11 SUPPLY / VALUE CHAIN: MEDICAL DEVICE
  154.   6.12 MEDICAL DEVICE, BY PRODUCT TYPE, 2024 (% SHARE)
  155.   6.13 MEDICAL DEVICE, BY PRODUCT TYPE, 2024 TO 2035 (USD Million)
  156.   6.14 MEDICAL DEVICE, BY PROCEDURE TYPE, 2024 (% SHARE)
  157.   6.15 MEDICAL DEVICE, BY PROCEDURE TYPE, 2024 TO 2035 (USD Million)
  158.   6.16 MEDICAL DEVICE, BY END USER, 2024 (% SHARE)
  159.   6.17 MEDICAL DEVICE, BY END USER, 2024 TO 2035 (USD Million)
  160.   6.18 MEDICAL DEVICE, BY APPLICATION, 2024 (% SHARE)
  161.   6.19 MEDICAL DEVICE, BY APPLICATION, 2024 TO 2035 (USD Million)
  162.   6.20 BENCHMARKING OF MAJOR COMPETITORS
  163. 7 LIST OF TABLES
  164.   7.1 LIST OF ASSUMPTIONS
  165.     7.1.1
  166.   7.2 South America MARKET SIZE ESTIMATES; FORECAST
  167.     7.2.1 BY PRODUCT TYPE, 2025-2035 (USD Million)
  168.     7.2.2 BY PROCEDURE TYPE, 2025-2035 (USD Million)
  169.     7.2.3 BY END USER, 2025-2035 (USD Million)
  170.     7.2.4 BY APPLICATION, 2025-2035 (USD Million)
  171.   7.3 PRODUCT LAUNCH/PRODUCT DEVELOPMENT/APPROVAL
  172.     7.3.1
  173.   7.4 ACQUISITION/PARTNERSHIP
  174.     7.4.1

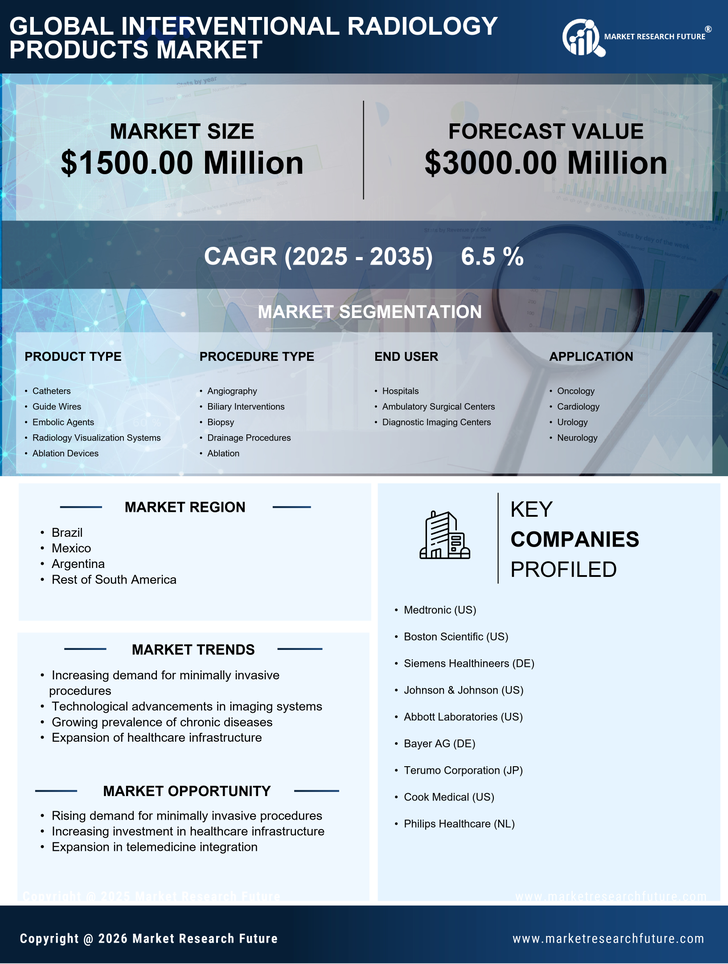
South America Medical Device Market Segmentation

Medical Device By Product Type (USD Million, 2025-2035)

  • Catheters
  • Guide Wires
  • Embolic Agents
  • Radiology Visualization Systems
  • Ablation Devices

Medical Device By Procedure Type (USD Million, 2025-2035)

  • Angiography
  • Biliary Interventions
  • Biopsy
  • Drainage Procedures
  • Ablation

Medical Device By End User (USD Million, 2025-2035)

  • Hospitals
  • Ambulatory Surgical Centers
  • Diagnostic Imaging Centers

Medical Device By Application (USD Million, 2025-2035)

  • Oncology
  • Cardiology
  • Urology
  • Neurology

Compare Licence

×
Features License Type
Single User Multiuser License Enterprise User
Price $4,950 $5,950 $7,250
Maximum User Access Limit 1 User Upto 10 Users Unrestricted Access Throughout the Organization
Free Customization
Direct Access to Analyst
Deliverable Format
Platform Access
Discount on Next Purchase 10% 15% 15%
Printable Versions