Request Free Sample ×

Kindly complete the form below to receive a free sample of this Report

* Please use a valid business email

Leading companies partner with us for data-driven Insights

clients tt-cursor
Hero Background

South America Fill Finish Manufacturing Market

ID: MRFR/MED/48327-HCR
200 Pages
Rahul Gotadki
Last Updated: April 06, 2026

South America Fill Finish Manufacturing Market Research Report By Application (Vaccine Filling, Parenteral Drug Filling, Biopharmaceuticals Filling, Diagnostic Product Filling), By Product Type (Pre-filled Syringes, Vials, Cartridges, Ampoules), By Equipment Type (Filling Machines, Capping Machines, Labeling Machines, Inspection Machines), By End User (Pharmaceutical Companies, Contract Manufacturing Organizations, Biotechnology Companies) and By Regional (Brazil, Mexico, Argentina, Rest of South America) -Forecast to 2035

Share:
Download PDF ×

We do not share your information with anyone. However, we may send you emails based on your report interest from time to time. You may contact us at any time to opt-out.

South America Fill Finish Manufacturing Market Infographic
Purchase Options
  1. 1 SECTION I: EXECUTIVE SUMMARY AND KEY HIGHLIGHTS
    1. 1.1 EXECUTIVE SUMMARY
      1. 1.1.1 Market Overview
      2. 1.1.2 Key Findings
      3. 1.1.3 Market Segmentation
      4. 1.1.4 Competitive Landscape
      5. 1.1.5 Challenges and Opportunities
      6. 1.1.6 Future Outlook
  2. 2 SECTION II: SCOPING, METHODOLOGY AND MARKET STRUCTURE
    1. 2.1 MARKET INTRODUCTION
      1. 2.1.1 Definition
      2. 2.1.2 Scope of the study
        1. 2.1.2.1 Research Objective
        2. 2.1.2.2 Assumption
        3. 2.1.2.3 Limitations
    2. 2.2 RESEARCH METHODOLOGY
      1. 2.2.1 Overview
      2. 2.2.2 Data Mining
      3. 2.2.3 Secondary Research
      4. 2.2.4 Primary Research
        1. 2.2.4.1 Primary Interviews and Information Gathering Process
        2. 2.2.4.2 Breakdown of Primary Respondents
      5. 2.2.5 Forecasting Model
      6. 2.2.6 Market Size Estimation
        1. 2.2.6.1 Bottom-Up Approach
        2. 2.2.6.2 Top-Down Approach
      7. 2.2.7 Data Triangulation
      8. 2.2.8 Validation
  3. 3 SECTION III: QUALITATIVE ANALYSIS
    1. 3.1 MARKET DYNAMICS
      1. 3.1.1 Overview
      2. 3.1.2 Drivers
      3. 3.1.3 Restraints
      4. 3.1.4 Opportunities
    2. 3.2 MARKET FACTOR ANALYSIS
      1. 3.2.1 Value chain Analysis
      2. 3.2.2 Porter's Five Forces Analysis
        1. 3.2.2.1 Bargaining Power of Suppliers
        2. 3.2.2.2 Bargaining Power of Buyers
        3. 3.2.2.3 Threat of New Entrants
        4. 3.2.2.4 Threat of Substitutes
        5. 3.2.2.5 Intensity of Rivalry
      3. 3.2.3 COVID-19 Impact Analysis
        1. 3.2.3.1 Market Impact Analysis
        2. 3.2.3.2 Regional Impact
        3. 3.2.3.3 Opportunity and Threat Analysis
  4. 4 SECTION IV: QUANTITATIVE ANALYSIS
    1. 4.1 Healthcare, BY Application (USD Billion)
      1. 4.1.1 Pharmaceuticals
      2. 4.1.2 Biologics
      3. 4.1.3 Vaccines
      4. 4.1.4 Nutraceuticals
    2. 4.2 Healthcare, BY End Use (USD Billion)
      1. 4.2.1 Contract Manufacturing Organizations
      2. 4.2.2 Pharmaceutical Companies
      3. 4.2.3 Biotechnology Firms
    3. 4.3 Healthcare, BY Product Type (USD Billion)
      1. 4.3.1 Vials
      2. 4.3.2 Syringes
      3. 4.3.3 Cartridges
      4. 4.3.4 Bags
    4. 4.4 Healthcare, BY Technology (USD Billion)
      1. 4.4.1 Aseptic Processing
      2. 4.4.2 Lyophilization
      3. 4.4.3 Automated Filling
  5. 5 SECTION V: COMPETITIVE ANALYSIS
    1. 5.1 Competitive Landscape
      1. 5.1.1 Overview
      2. 5.1.2 Competitive Analysis
      3. 5.1.3 Market share Analysis
      4. 5.1.4 Major Growth Strategy in the Healthcare
      5. 5.1.5 Competitive Benchmarking
      6. 5.1.6 Leading Players in Terms of Number of Developments in the Healthcare
      7. 5.1.7 Key developments and growth strategies
        1. 5.1.7.1 New Product Launch/Service Deployment
        2. 5.1.7.2 Merger & Acquisitions
        3. 5.1.7.3 Joint Ventures
      8. 5.1.8 Major Players Financial Matrix
        1. 5.1.8.1 Sales and Operating Income
        2. 5.1.8.2 Major Players R&D Expenditure. 2023
    2. 5.2 Company Profiles
      1. 5.2.1 AstraZeneca (GB)
        1. 5.2.1.1 Financial Overview
        2. 5.2.1.2 Products Offered
        3. 5.2.1.3 Key Developments
        4. 5.2.1.4 SWOT Analysis
        5. 5.2.1.5 Key Strategies
      2. 5.2.2 Boehringer Ingelheim (DE)
        1. 5.2.2.1 Financial Overview
        2. 5.2.2.2 Products Offered
        3. 5.2.2.3 Key Developments
        4. 5.2.2.4 SWOT Analysis
        5. 5.2.2.5 Key Strategies
      3. 5.2.3 Novartis (CH)
        1. 5.2.3.1 Financial Overview
        2. 5.2.3.2 Products Offered
        3. 5.2.3.3 Key Developments
        4. 5.2.3.4 SWOT Analysis
        5. 5.2.3.5 Key Strategies
      4. 5.2.4 Pfizer (US)
        1. 5.2.4.1 Financial Overview
        2. 5.2.4.2 Products Offered
        3. 5.2.4.3 Key Developments
        4. 5.2.4.4 SWOT Analysis
        5. 5.2.4.5 Key Strategies
      5. 5.2.5 Sanofi (FR)
        1. 5.2.5.1 Financial Overview
        2. 5.2.5.2 Products Offered
        3. 5.2.5.3 Key Developments
        4. 5.2.5.4 SWOT Analysis
        5. 5.2.5.5 Key Strategies
      6. 5.2.6 Merck (DE)
        1. 5.2.6.1 Financial Overview
        2. 5.2.6.2 Products Offered
        3. 5.2.6.3 Key Developments
        4. 5.2.6.4 SWOT Analysis
        5. 5.2.6.5 Key Strategies
      7. 5.2.7 GSK (GB)
        1. 5.2.7.1 Financial Overview
        2. 5.2.7.2 Products Offered
        3. 5.2.7.3 Key Developments
        4. 5.2.7.4 SWOT Analysis
        5. 5.2.7.5 Key Strategies
      8. 5.2.8 Baxter (US)
        1. 5.2.8.1 Financial Overview
        2. 5.2.8.2 Products Offered
        3. 5.2.8.3 Key Developments
        4. 5.2.8.4 SWOT Analysis
        5. 5.2.8.5 Key Strategies
      9. 5.2.9 Fresenius Kabi (DE)
        1. 5.2.9.1 Financial Overview
        2. 5.2.9.2 Products Offered
        3. 5.2.9.3 Key Developments
        4. 5.2.9.4 SWOT Analysis
        5. 5.2.9.5 Key Strategies
    3. 5.3 Appendix
      1. 5.3.1 References
      2. 5.3.2 Related Reports
  6. 6 LIST OF FIGURES
    1. 6.1 MARKET SYNOPSIS
    2. 6.2 SOUTH AMERICA MARKET ANALYSIS BY APPLICATION
    3. 6.3 SOUTH AMERICA MARKET ANALYSIS BY END USE
    4. 6.4 SOUTH AMERICA MARKET ANALYSIS BY PRODUCT TYPE
    5. 6.5 SOUTH AMERICA MARKET ANALYSIS BY TECHNOLOGY
    6. 6.6 KEY BUYING CRITERIA OF HEALTHCARE
    7. 6.7 RESEARCH PROCESS OF MRFR
    8. 6.8 DRO ANALYSIS OF HEALTHCARE
    9. 6.9 DRIVERS IMPACT ANALYSIS: HEALTHCARE
    10. 6.10 RESTRAINTS IMPACT ANALYSIS: HEALTHCARE
    11. 6.11 SUPPLY / VALUE CHAIN: HEALTHCARE
    12. 6.12 HEALTHCARE, BY APPLICATION, 2024 (% SHARE)
    13. 6.13 HEALTHCARE, BY APPLICATION, 2024 TO 2035 (USD Billion)
    14. 6.14 HEALTHCARE, BY END USE, 2024 (% SHARE)
    15. 6.15 HEALTHCARE, BY END USE, 2024 TO 2035 (USD Billion)
    16. 6.16 HEALTHCARE, BY PRODUCT TYPE, 2024 (% SHARE)
    17. 6.17 HEALTHCARE, BY PRODUCT TYPE, 2024 TO 2035 (USD Billion)
    18. 6.18 HEALTHCARE, BY TECHNOLOGY, 2024 (% SHARE)
    19. 6.19 HEALTHCARE, BY TECHNOLOGY, 2024 TO 2035 (USD Billion)
    20. 6.20 BENCHMARKING OF MAJOR COMPETITORS
  7. 7 LIST OF TABLES
    1. 7.1 LIST OF ASSUMPTIONS
  8. 7.1.1
    1. 7.2 South America MARKET SIZE ESTIMATES; FORECAST
      1. 7.2.1 BY APPLICATION, 2026-2035 (USD Billion)
      2. 7.2.2 BY END USE, 2026-2035 (USD Billion)
      3. 7.2.3 BY PRODUCT TYPE, 2026-2035 (USD Billion)
      4. 7.2.4 BY TECHNOLOGY, 2026-2035 (USD Billion)
    2. 7.3 PRODUCT LAUNCH/PRODUCT DEVELOPMENT/APPROVAL
  9. 7.3.1
    1. 7.4 ACQUISITION/PARTNERSHIP
  10. 7.4.1

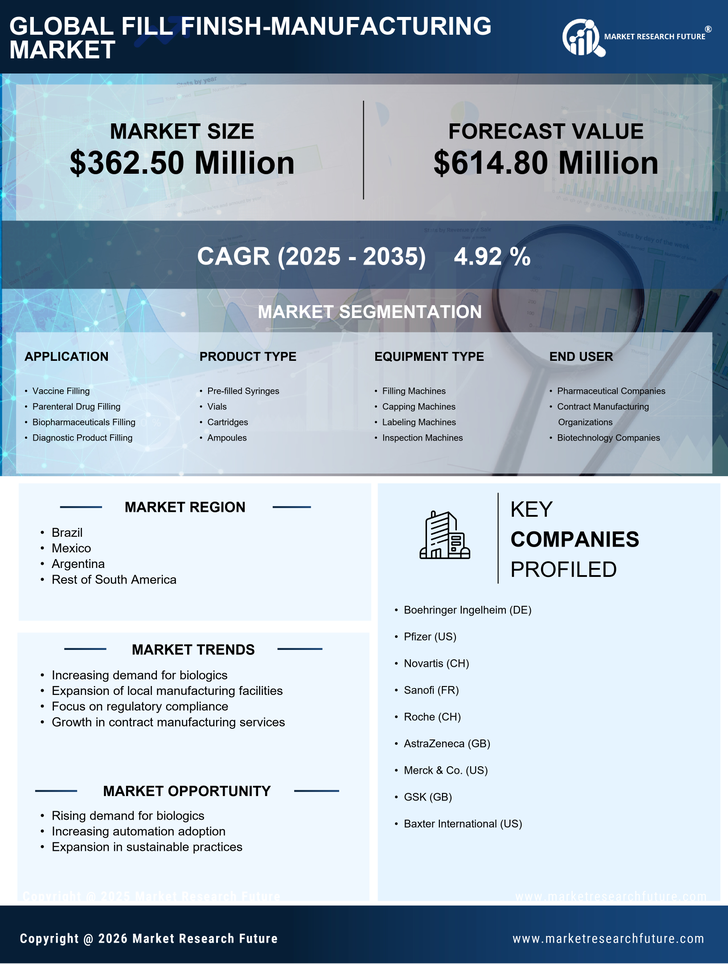
South America Healthcare Market Segmentation

Healthcare By Application (USD Billion, 2022-2035)

  • Pharmaceuticals
  • Biologics
  • Vaccines
  • Nutraceuticals

Healthcare By End Use (USD Billion, 2022-2035)

  • Contract Manufacturing Organizations
  • Pharmaceutical Companies
  • Biotechnology Firms

Healthcare By Product Type (USD Billion, 2022-2035)

  • Vials
  • Syringes
  • Cartridges
  • Bags

Healthcare By Technology (USD Billion, 2022-2035)

  • Aseptic Processing
  • Lyophilization
  • Automated Filling

Compare Licence

×
Features License Type
Single User Multiuser License Enterprise User
Price $4,950 $5,950 $7,250
Maximum User Access Limit 1 User Upto 10 Users Unrestricted Access Throughout the Organization
Free Customization
Direct Access to Analyst
Deliverable Format
Platform Access
Discount on Next Purchase 10% 15% 15%
Printable Versions