

South America Chemicals and Materials Market Segmentation
Chemicals and Materials By Procedure Type (USD Million, 2025-2035)
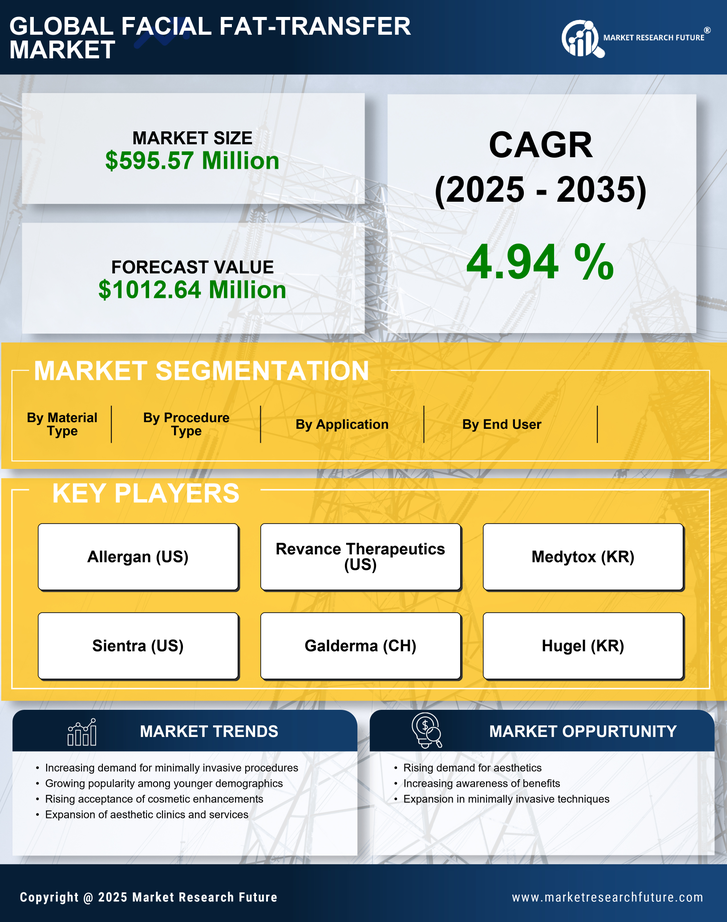
- Autologous Fat Transfer
- Composite Grafting
- Micro Fat Grafting
- Nanofat Grafting
Chemicals and Materials By End User (USD Million, 2025-2035)
- Cosmetic Surgeons
- Dermatologists
- Plastic Surgeons
- Hospitals
Chemicals and Materials By Application (USD Million, 2025-2035)
- Facial Reconstruction
- Facial Aesthetics
- Anti-Aging Treatments
Chemicals and Materials By Material Type (USD Million, 2025-2035)
- Harvesting Devices
- Injection Devices
- Fat Storage Solutions


