• Cat-intel
  • MedIntelliX
  • Resources
  • About Us
  • Hero Background
    English
    Chinese
    French
    Japanese
    Korean
    German
    Spanish

    South America & Africa Diesel Generator Market Share

    ID: MRFR/E&P/3767-CR
    131 Pages
    Priya Nagrale
    January 2018

    South America & Africa Diesel Generator Market by Power Rating (Upto 10 kW, 11 kW - 100 kW and Above 100 kW), by End-User (Residential, Commercial and Industrial), by Portability (Stationary and Portable), by Hybrid System Type (Solar Diesel and Wind Diesel), by Country (Colombia, Nigeria, Peru Congo, Sudan, Guatemala, Tanzania, Kenya, Ethiopia, Bolivia, Uganda and Other Countries) - South ...

    Share:
    Download PDF ×

    We do not share your information with anyone. However, we may send you emails based on your report interest from time to time. You may contact us at any time to opt-out.

    South America & Africa Diesel Generator Market Infographic
    $ 4,950.0
    $ 5,950.0
    $ 7,250.0

    Market Share

    South America & Africa Diesel Generator Market Share Analysis

    Companies in the south America and Africa diesel generator market use a variety of strategies for positioning their share in this dynamic landscape to get solid footholds and gain an upper hand. It is a common practice to target product differentiation that helps the manufacturers of diesel generators create distinctive features, better performance, and more advanced technologies than other companies in order to be distinct from competitors. Through providing generators that have advanced features like better fuel consumption, less exhaust emissions and intelligent monitoring systems firms attract a refined clientele base. Geographic expansion is another critical approach, understanding the unique demands of different regions in South America and Africa. This involves designing products to the respective local needs, taking into consideration issues such as climate conditions, power utilization and regulatory requirements. Through such adjustments, companies are able to access more customers and become recognized as dependable producers of diesel generators that serve different localities. Understanding regional differences helps businesses in effectively tackling the local peculiarities, which reflect challenges and preferences arising within each market. Additionally, pricing strategies are central in market share positioning. Others choose a cost-leadership strategy, selling diesel generators at low prices to gain market share. This approach may work in price-sensitive markets, where consumers value cost. On the other hand, premium-pricing strategies position products as superior and costly to indicate their quality performance that is valued over price. Achieving that right balance between the price and value perceived by consumers is essential for companies aiming at achieving an optimum market share. This is another strategic opportunity for companies trading in the South America and Africa diesel generator market through collaboration and partnerships. It can be easier to penetrate the market and achieve a better understanding of regional trends by working with local distributors, suppliers, or governments. By establishing powerful alliances, the company is able to capitalize on already-existing networks and maneuver within regulatory settings most efficiently. Collaborations can also culminate in partnerships or co-developments which will allow companies to pool resources and know how, for purposes of dealing with individual market problems. Moreover, customer oriented approaches are considered to be priority for market share ring. Brand loyalty can be significantly increased through superior customer service, warranties, and post-sale services. Satisfied customers are more likely to be repeat clients and brand ambassadors, which eventually leads them to grow market share. In a competitive market, companies spend money on brand images by highlighting reliability and customer satisfaction as distinctive features that make their products stand out. Environmental sustainability is beginning to assume a very key role in the market share positioning for the diesel generator market. Faced with the growing knowledge of climate change and also environmental impact, companies are designing reliable generators that meet very stringent emissions regulations. This approach not only attracts the environmentally aware customers but also situates the companies ideally in the view of dynamic regulatory changes and developing global sustainability tendencies.

    Market Summary

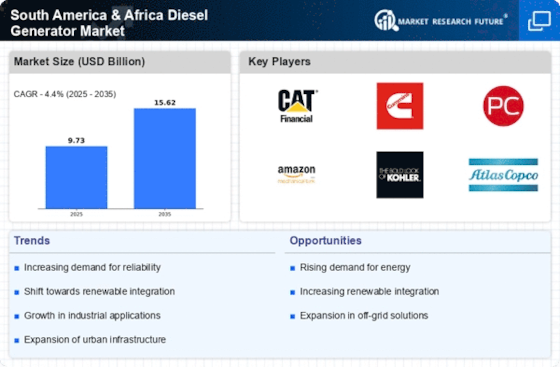
    The South America and Africa Diesel Generator Market is projected to grow from 9.73 USD Billion in 2024 to 15.62 USD Billion by 2035, reflecting a robust CAGR of 6.5%.

    Key Market Trends & Highlights

    South America & Africa Diesel Generator Key Trends and Highlights

    • The market valuation is expected to reach 15.62 USD Billion by 2035, indicating substantial growth potential. From 2025 to 2035, the market is anticipated to expand at a CAGR of 6.5%, showcasing a steady upward trend. in 2024, the market is valued at 9.73 USD Billion, laying a strong foundation for future growth. Growing adoption of diesel generators due to increasing energy demand is a major market driver.

    Market Size & Forecast

    2024 Market Size 9.73 (USD Billion)
    2035 Market Size 15.62 (USD Billion)
    CAGR (2025 - 2035) 4.40%
    Largest Regional Market Share in 2024 -)

    Major Players

    <p>Apple Inc (US), Microsoft Corp (US), Amazon.com Inc (US), Alphabet Inc (US), Berkshire Hathaway Inc (US), Tesla Inc (US), Meta Platforms Inc (US), Johnson &amp; Johnson (US), Visa Inc (US), Procter &amp; Gamble Co (US)</p>

    Market Trends

    <p>The diesel generator market in South America and Africa is poised for growth, driven by increasing energy demands and the need for reliable power solutions in both urban and rural areas.</p>

    International Energy Agency (IEA)

    South America & Africa Diesel Generator Market Market Drivers

    Growing Energy Demand

    The Global South America and Africa Diesel Generator Market Industry is experiencing a surge in energy demand, driven by rapid urbanization and industrialization. Countries such as Brazil and Nigeria are witnessing significant growth in their energy sectors, with electricity consumption projected to rise substantially. In 2024, the market is valued at approximately 12.5 USD Billion, reflecting the increasing reliance on diesel generators for backup and primary power solutions. This trend is likely to continue as populations grow and infrastructure development accelerates, suggesting a robust future for diesel generators in these regions.

    Unreliable Power Supply

    The prevalence of unreliable power supply in many regions of South America and Africa is a critical driver for the Global South America and Africa Diesel Generator Market Industry. Countries like Venezuela and South Africa face frequent power outages, prompting businesses and households to seek alternative power solutions. Diesel generators provide a reliable backup during these outages, ensuring continuity of operations. As the market evolves, the demand for diesel generators is likely to increase, particularly in urban areas where the impact of power disruptions is most acutely felt, further solidifying the market's growth trajectory.

    Technological Advancements

    Technological advancements in diesel generator design and efficiency are enhancing the appeal of the Global South America and Africa Diesel Generator Market Industry. Innovations such as improved fuel efficiency and reduced emissions are making diesel generators more environmentally friendly and cost-effective. Manufacturers are increasingly adopting advanced technologies to meet stringent regulatory standards and consumer preferences for greener solutions. This shift not only addresses environmental concerns but also positions diesel generators as viable options for both commercial and residential applications, potentially expanding their market share in the coming years.

    Market Trends and Projections

    Economic Growth and Investment

    Economic growth and increased foreign investment in South America and Africa are driving the Global South America and Africa Diesel Generator Market Industry. Countries like Colombia and Kenya are attracting investments in various sectors, including mining, agriculture, and manufacturing, which require reliable power sources. As these economies expand, the demand for diesel generators is expected to rise, with projections indicating a market value of 25 USD Billion by 2035. This growth is indicative of the broader economic trends in the regions, where energy security is becoming increasingly vital for sustaining development.

    Infrastructure Development Initiatives

    Infrastructure development initiatives across South America and Africa are propelling the Global South America and Africa Diesel Generator Market Industry forward. Governments are investing heavily in transportation, healthcare, and telecommunications infrastructure, which necessitates reliable power sources. For instance, Brazil's investments in road and rail projects and Nigeria's focus on expanding its telecommunications network highlight the need for diesel generators. This focus on infrastructure is expected to contribute to a compound annual growth rate of 6.5% from 2025 to 2035, indicating a sustained demand for diesel generators as essential components of these projects.

    Market Segment Insights

    Regional Insights

    Key Companies in the South America & Africa Diesel Generator Market market include

    Industry Developments

    Future Outlook

    South America & Africa Diesel Generator Market Future Outlook

    <p>The South America &amp; Africa Diesel Generator Market is projected to grow at a 4.40% CAGR from 2025 to 2035, driven by increasing energy demands and infrastructure development.</p>

    New opportunities lie in:

    • <p>Invest in renewable energy hybrid systems to enhance generator efficiency. Develop smart generator technologies for remote monitoring and management. Expand distribution networks to penetrate underserved rural markets.</p>

    <p>By 2035, the market is expected to achieve robust growth, positioning itself as a critical energy solution.</p>

    Market Segmentation

    Report Scope

    Attribute/MetricDetails
      Market Size 2024   USD 9.73 Billion
    Market Size 203515.62
      CAGR4.40% (2025 - 2035)
      Base Year2024
      Forecast Period2025 - 2035
      Historical Data  2019 & 2022
      Forecast Units  Value (USD Million)
      Report Coverage  Revenue Forecast, Competitive Landscape, Growth Factors, and Trends
      Segments Covered  Power Rating, End-User, Portability, Hybrid System Type, Country
      Geographies Covered  North America, Europe, Asia-Pacific, and Rest of the World (RoW)
      Key Vendors  Caterpillar Inc., Cummins Inc., Generac Holdings Inc., Mitsubishi Heavy Industries Engine & Turbocharger, Ltd., AKSA Power Generation, Kohler Co., Rolls-Royce Power Systems AG, Wuxi Kipor Power Co. Ltd, Aggreko PLC, MAN Diesel & Turbo, General Electric Company and Wärtsilä
      Key Market OpportunitiesGrowth In Industrialization & Urbanization Access To Electricity In Rural & Remote Areas
      Key Market DriversSurge In Power Outages & Power Failure Growing Demand For Interminable & Dependable Power Supply Growth In Hybrid Renewable Energy Systems
    Market Size 202510.16

    Market Highlights

    Author

    Priya Nagrale
    Senior Research Analyst

    She holds an experience of about 6+ years in market research and business consulting, working under the spectrum of information communication technology, telecommunications and semiconductor domains. aarti conceptualizes and implements a scalable business strategy and provides strategic leadership to the clients. her expertise lies in market estimation, competitive intelligence, pipeline analysis, customer assessment, etc.

    Leave a Comment

    Latest Comments

    John Doe
    john@example.com

    This is a great article! Really helped me understand the topic better.

    Posted on July 23, 2025, 10:15 AM
    Jane Smith
    jane@domain.com

    Thanks for sharing this. I’ve bookmarked it for later reference.

    Posted on July 22, 2025, 7:45 PM

    FAQs

    Why is the South America & Africa diesel generator market expected to grow substantially?

    Increasing power outages is the primary driver of the South America &amp; Africa diesel generator market.

    Who are the key contributors to the South America & Africa diesel generator market?

    The key contributors are Caterpillar Inc., Generac Holdings Inc., Cummins Inc., Mitsubishi Heavy Industries Engine &amp; Turbocharger, Ltd., Kohler Co., AKSA Power Generation, General Electric Company, Rolls-Royce Power Systems AG, Aggreko PLC, Wuxi Kipor Power Co. Ltd, MAN Diesel &amp; Turbo, and Wärtsilä.

    At what CAGR is the South America & Africa diesel generator market poised to expand?

    The South America &amp; Africa diesel generator market is poised to mark 2.65% CAGR.

    By power rating, which segment is projected to hold the largest market share?

    The 11kW-100Kw segment is anticipated to hold the largest market share.

    What are the segments of the South America & Africa diesel generator market on the basis of portability?

    By portability, the segments are stationary and portable.

    What are the segments of the South America & Africa diesel generator market based on hybrid system type?

    By hybrid system type, the segments are wind diesel and solar diesel.

    Which countries are assessed in the study of the South America & Africa diesel generator market?

    The countries studied are Colombia, Uganda, Peru Congo, Nigeria, Sudan, Tanzania, Guatemala, Kenya, Bolivia, Ethiopia, and other countries.

    1. List of Tables and Figures
      1.  
      2. TABLE 1 MARKET SYNOPSIS 14
      3.  
      4. TABLE 2 POWER OUTAGE DATA, SOUTH AMERICA & AFRICA DIESEL GENERATOR MARKET 22
      5.  
      6. TABLE 3 GENERATOR TECHNICALITIES BASED ON APPLICATION/TYPE 28
      7.  
      8. TABLE 4 COMPARISON OF SMALL GENERATORS VS. LARGE GENERATORS 30
      9.  
      10. TABLE 5 SOUTH AMERICA & AFRICA DIESEL GENERATOR MARKET, BY POWER RATING, 2023-2032 (USD MILLION) 37
      11.  
      12. TABLE 6 SOUTH AMERICA & AFRICA DIESEL GENERATOR MARKET, BY END-USER, 2023-2032 (USD MILLION) 41
      13.  
      14. TABLE 7 SOUTH AMERICA & AFRICA DIESEL GENERATOR MARKET, BY PORTABILITY, 2023-2032 (USD MILLION) 44
      15.  
      16. TABLE 8 SOUTH AMERICA & AFRICA DIESEL GENERATOR MARKET, BY HYBRID SYSTEM TYPE, 2023-2032 (USD MILLION) 47
      17.  
      18. TABLE 9 SOUTH AMERICA & AFRICA DIESEL GENERATOR MARKET, BY COUNTRY, 2023-2032 (USD MILLION) 52
      19.  
      20. TABLE 10 COLOMBIA: SOUTH AMERICA & AFRICA DIESEL GENERATOR MARKET, BY POWER RATING, 2023-2032 (USD MILLION) 53
      21.  
      22. TABLE 11 COLOMBIA: SOUTH AMERICA & AFRICA DIESEL GENERATOR MARKET, BY END-USER, 2023-2032 (USD MILLION) 54
      23.  
      24. TABLE 12 COLOMBIA: SOUTH AMERICA & AFRICA DIESEL GENERATOR MARKET, BY PORTABILITY, 2023-2032 (USD MILLION) 54
      25.  
      26. TABLE 13 COLOMBIA: SOUTH AMERICA & AFRICA DIESEL GENERATOR MARKET, BY HYBRID SYSTEM TYPE, 2023-2032 (USD MILLION) 55
      27.  
      28. TABLE 14 NIGERIA: SOUTH AMERICA & AFRICA DIESEL GENERATOR MARKET, BY POWER RATING, 2023-2032 (USD MILLION) 56
      29.  
      30. TABLE 15 NIGERIA: SOUTH AMERICA & AFRICA DIESEL GENERATOR MARKET, BY END-USER, 2023-2032 (USD MILLION) 57
      31.  
      32. TABLE 16 NIGERIA: SOUTH AMERICA & AFRICA DIESEL GENERATOR MARKET, BY PORTABILITY, 2023-2032 (USD MILLION) 57
      33.  
      34. TABLE 17 NIGERIA: SOUTH AMERICA & AFRICA DIESEL GENERATOR MARKET, BY HYBRID SYSTEM TYPE, 2023-2032 (USD MILLION) 58
      35.  
      36. TABLE 18 PERU: SOUTH AMERICA & AFRICA DIESEL GENERATOR MARKET, BY POWER RATING, 2023-2032 (USD MILLION) 59
      37.  
      38. TABLE 19 PERU: SOUTH AMERICA & AFRICA DIESEL GENERATOR MARKET, BY END-USER, 2023-2032 (USD MILLION) 60
      39.  
      40. TABLE 20 PERU: SOUTH AMERICA & AFRICA DIESEL GENERATOR MARKET, BY PORTABILITY, 2023-2032 (USD MILLION) 60
      41.  
      42. TABLE 21 PERU: SOUTH AMERICA & AFRICA DIESEL GENERATOR MARKET, BY HYBRID SYSTEM TYPE, 2023-2032 (USD MILLION) 61
      43.  
      44. TABLE 22 CONGO: SOUTH AMERICA & AFRICA DIESEL GENERATOR MARKET, BY POWER RATING, 2023-2032 (USD MILLION) 62
      45.  
      46. TABLE 23 CONGO: SOUTH AMERICA & AFRICA DIESEL GENERATOR MARKET, BY END-USER, 2023-2032 (USD MILLION) 63
      47.  
      48. TABLE 24 CONGO: SOUTH AMERICA & AFRICA DIESEL GENERATOR MARKET, BY PORTABILITY, 2023-2032 (USD MILLION) 63
      49.  
      50. TABLE 25 CONGO: SOUTH AMERICA & AFRICA DIESEL GENERATOR MARKET, BY HYBRID SYSTEM TYPE, 2023-2032 (USD MILLION) 64
      51.  
      52. TABLE 26 SUDAN: SOUTH AMERICA & AFRICA DIESEL GENERATOR MARKET, BY POWER RATING, 2023-2032 (USD MILLION) 65
      53.  
      54. TABLE 27 SUDAN: SOUTH AMERICA & AFRICA DIESEL GENERATOR MARKET, BY END-USER, 2023-2032 (USD MILLION) 66
      55.  
      56. TABLE 28 SUDAN: SOUTH AMERICA & AFRICA DIESEL GENERATOR MARKET, BY PORTABILITY, 2023-2032 (USD MILLION) 66
      57.  
      58. TABLE 29 SUDAN: SOUTH AMERICA & AFRICA DIESEL GENERATOR MARKET, BY HYBRID SYSTEM TYPE, 2023-2032 (USD MILLION) 67
      59.  
      60. TABLE 30 GUATEMALA: SOUTH AMERICA & AFRICA DIESEL GENERATOR MARKET, BY POWER RATING, 2023-2032 (USD MILLION) 68
      61.  
      62. TABLE 31 GUATEMALA: SOUTH AMERICA & AFRICA DIESEL GENERATOR MARKET, BY END-USER, 2023-2032 (USD MILLION) 69
      63.  
      64. TABLE 32 GUATEMALA: SOUTH AMERICA & AFRICA DIESEL GENERATOR MARKET, BY PORTABILITY, 2023-2032 (USD MILLION) 69
      65.  
      66. TABLE 33 GUATEMALA: SOUTH AMERICA & AFRICA DIESEL GENERATOR MARKET, BY HYBRID SYSTEM TYPE, 2023-2032 (USD MILLION) 70
      67.  
      68. TABLE 34 TANZANIA: SOUTH AMERICA & AFRICA DIESEL GENERATOR MARKET, BY POWER RATING, 2023-2032 (USD MILLION) 71
      69.  
      70. TABLE 35 TANZANIA: SOUTH AMERICA & AFRICA DIESEL GENERATOR MARKET, BY END-USER, 2023-2032 (USD MILLION) 72
      71.  
      72. TABLE 36 TANZANIA: SOUTH AMERICA & AFRICA DIESEL GENERATOR MARKET, BY PORTABILITY, 2023-2032 (USD MILLION) 72
      73.  
      74. TABLE 37 TANZANIA: SOUTH AMERICA & AFRICA DIESEL GENERATOR MARKET, BY HYBRID SYSTEM TYPE, 2023-2032 (USD MILLION) 73
      75.  
      76. TABLE 38 KENYA: SOUTH AMERICA & AFRICA DIESEL GENERATOR MARKET, BY POWER RATING, 2023-2032 (USD MILLION) 74
      77.  
      78. TABLE 39 KENYA: SOUTH AMERICA & AFRICA DIESEL GENERATOR MARKET, BY END-USER, 2023-2032 (USD MILLION) 75
      79.  
      80. TABLE 40 KENYA: SOUTH AMERICA & AFRICA DIESEL GENERATOR MARKET, BY PORTABILITY, 2023-2032 (USD MILLION) 75
      81.  
      82. TABLE 41 KENYA: SOUTH AMERICA & AFRICA DIESEL GENERATOR MARKET, BY HYBRID SYSTEM TYPE, 2023-2032 (USD MILLION) 76
      83.  
      84. TABLE 42 ETHIOPIA: SOUTH AMERICA & AFRICA DIESEL GENERATOR MARKET, BY POWER RATING, 2023-2032 (USD MILLION) 77
      85.  
      86. TABLE 43 ETHIOPIA: SOUTH AMERICA & AFRICA DIESEL GENERATOR MARKET, BY END-USER, 2023-2032 (USD MILLION) 78
      87.  
      88. TABLE 44 ETHIOPIA: SOUTH AMERICA & AFRICA DIESEL GENERATOR MARKET, BY PORTABILITY, 2023-2032 (USD MILLION) 78
      89.  
      90. TABLE 45 ETHIOPIA: SOUTH AMERICA & AFRICA DIESEL GENERATOR MARKET, BY HYBRID SYSTEM TYPE, 2023-2032 (USD MILLION) 79
      91.  
      92. TABLE 46 BOLIVIA: SOUTH AMERICA & AFRICA DIESEL GENERATOR MARKET, BY POWER RATING, 2023-2032 (USD MILLION) 80
      93.  
      94. TABLE 47 BOLIVIA: SOUTH AMERICA & AFRICA DIESEL GENERATOR MARKET, BY END-USER, 2023-2032 (USD MILLION) 81
      95.  
      96. TABLE 48 BOLIVIA: SOUTH AMERICA & AFRICA DIESEL GENERATOR MARKET, BY PORTABILITY, 2023-2032 (USD MILLION) 81
      97.  
      98. TABLE 49 BOLIVIA: SOUTH AMERICA & AFRICA DIESEL GENERATOR MARKET, BY HYBRID SYSTEM TYPE, 2023-2032 (USD THOUSAND) 82
      99.  
      100. TABLE 50 UGANDA: SOUTH AMERICA & AFRICA DIESEL GENERATOR MARKET, BY POWER RATING, 2023-2032 (USD MILLION) 83
      101.  
      102. TABLE 51 UGANDA: SOUTH AMERICA & AFRICA DIESEL GENERATOR MARKET, BY END-USER, 2023-2032 (USD MILLION) 84
      103.  
      104. TABLE 52 UGANDA: SOUTH AMERICA & AFRICA DIESEL GENERATOR MARKET, BY PORTABILITY, 2023-2032 (USD MILLION) 84
      105.  
      106. TABLE 53 UGANDA: SOUTH AMERICA & AFRICA DIESEL GENERATOR MARKET, BY HYBRID SYSTEM TYPE, 2023-2032 (USD THOUSAND) 85
      107.  
      108. TABLE 54 OTHER COUNTRIES: SOUTH AMERICA & AFRICA DIESEL GENERATOR MARKET, BY POWER RATING, 2023-2032 (USD MILLION) 86
      109.  
      110. TABLE 55 OTHER COUNTRIES: SOUTH AMERICA & AFRICA DIESEL GENERATOR MARKET, BY END-USER, 2023-2032 (USD MILLION) 87
      111.  
      112. TABLE 56 OTHER COUNTRIES: SOUTH AMERICA & AFRICA DIESEL GENERATOR MARKET, BY PORTABILITY, 2023-2032 (USD MILLION) 87
      113.  
      114. TABLE 57 OTHERS: SOUTH AMERICA & AFRICA DIESEL GENERATOR MARKET, BY HYBRID SYSTEM TYPE, 2023-2032 (USD THOUSAND) 88
      115.  
      116.  
    2. List of Tables and Figures
      1.  
      2. FIGURE 1 RESEARCH PROCESS OF MRFR 17
      3.  
      4. FIGURE 2 TOP DOWN & BOTTOM UP APPROACH 19
      5.  
      6. FIGURE 3 FORECAST MODEL FOR SOUTH AMERICA & AFRICA DIESEL GENERATOR MARKET 20
      7.  
      8. FIGURE 4 DRIVERS, RESTRAINTS AND OPPORTUNITIES OF SOUTH AMERICA & AFRICA DIESEL GENERATOR MARKET 21
      9.  
      10. FIGURE 5 GROWTH DRIVERS: IMPACT ANALYSIS 24
      11.  
      12. FIGURE 6 GROWTH BARRIERS: IMPACT ANALYSIS 25
      13.  
      14. FIGURE 7 PORTER'S FIVE FORCES ANALYSIS OF SOUTH AMERICA & AFRICA DIESEL GENERATOR MARKET 31
      15.  
      16. FIGURE 8 SOUTH AMERICA & AFRICA DIESEL GENERATOR MARKET SHARE, BY POWER RATING, 2032 (% SHARE) 36
      17.  
      18. FIGURE 9 SOUTH AMERICA & AFRICA DIESEL GENERATOR MARKET SHARE, BY END-USER TYPE, 2032 (% SHARE) 40
      19.  
      20. FIGURE 10 SOUTH AMERICA & AFRICA DIESEL GENERATOR MARKET SHARE, BY PORTABILITY, 2032 (% SHARE) 43
      21.  
      22. FIGURE 11 SOUTH AMERICA & AFRICA DIESEL GENERATOR MARKET SHARE, BY HYBRID SYSTEM TYPE, 2032 (% SHARE) 46
      23.  
      24. FIGURE 12 SOUTH AMERICA & AFRICA DIESEL GENERATOR MARKET, BY COUNTRY, 2032 (% SHARE) 50
      25.  
      26. FIGURE 13 SOUTH AMERICA & AFRICA DIESEL GENERATOR MARKET SHARE, BY COUNTRY, 2032 (% SHARE) 51
      27.  
      28. FIGURE 14 COLOMBIA: SOUTH AMERICA & AFRICA DIESEL GENERATOR MARKET SHARE, BY POWER RATING, 2032 (% SHARE) 53
      29.  
      30. FIGURE 15 NIGERIA: SOUTH AMERICA & AFRICA DIESEL GENERATOR MARKET SHARE, BY POWER RATING, 2032 (% SHARE) 56
      31.  
      32. FIGURE 16 PERU: SOUTH AMERICA & AFRICA DIESEL GENERATOR MARKET SHARE, BY POWER RATING, 2032 (% SHARE) 59
      33.  
      34. FIGURE 17 CONGO: SOUTH AMERICA & AFRICA DIESEL GENERATOR MARKET SHARE, BY POWER RATING, 2032 (% SHARE) 62
      35.  
      36. FIGURE 18 SUDAN: SOUTH AMERICA & AFRICA DIESEL GENERATOR MARKET SHARE, BY POWER RATING, 2032 (% SHARE) 65
      37.  
      38. FIGURE 19 GUATEMALA: SOUTH AMERICA & AFRICA DIESEL GENERATOR MARKET SHARE, BY POWER RATING, 2032 (% SHARE) 68
      39.  
      40. FIGURE 20 TANZANIA: SOUTH AMERICA & AFRICA DIESEL GENERATOR MARKET SHARE, BY POWER RATING, 2032 (% SHARE) 71
      41.  
      42. FIGURE 21 KENYA: SOUTH AMERICA & AFRICA DIESEL GENERATOR MARKET SHARE, BY POWER RATING, 2032 (% SHARE) 74
      43.  
      44. FIGURE 22 ETHIOPIA: SOUTH AMERICA & AFRICA DIESEL GENERATOR MARKET SHARE, BY POWER RATING, 2032 (% SHARE) 77
      45.  
      46. FIGURE 23 BOLIVIA: SOUTH AMERICA & AFRICA DIESEL GENERATOR MARKET SHARE, BY POWER RATING, 2032 (% SHARE) 80
      47.  
      48. FIGURE 24 UGANDA: SOUTH AMERICA & AFRICA DIESEL GENERATOR MARKET SHARE, BY POWER RATING, 2032 (% SHARE) 83
      49.  
      50. FIGURE 25 OTHER COUNTRIES: SOUTH AMERICA & AFRICA DIESEL GENERATOR MARKET SHARE, BY POWER RATING, 2032 (% SHARE) 86
      51.  
      52. FIGURE 26 GROWTH STRATEGIES ADOPTED BY KEY PLAYERS IN SOUTH AMERICA & AFRICA DIESEL GENERATOR MARKET, 2023-2032, (%) 89
      53.  
      54. FIGURE 27 PRODUCT LAUNCH/DEVELOPMENT: % SHARE BY KEY PLAYERS, 2023-2032, (%) 90
      55.  
      56. FIGURE 28 MERGERS AND ACQUISITIONS: % SHARE BY KEY PLAYERS, 2023-2032, (%) 91
      57.  
      58. FIGURE 29 PARTNERSHIPS & COLLABORATIONS: % SHARE BY KEY PLAYERS, 2023-2032, (%) 92
      59.  
      60. FIGURE 30 CATERPILLAR INC. : TOTAL REVENUE VS SEGMENTAL REVENUE (USD MILLION) 93
      61.  
      62. FIGURE 31 CATERPILLAR INC.: GEOGRAPHIC REVENUE MIX, 2032 (%) 94
      63.  
      64. FIGURE 32 CATERPILLAR INC.: KEY DEVELOPMENTS, 2032 (%) 96
      65.  
      66. FIGURE 33 CATERPILLAR INC.: SWOT ANALYSIS 97
      67.  
      68. FIGURE 34 CUMMINS INC. : TOTAL REVENUE VS SEGMENTAL REVENUE (USD MILLION) 98
      69.  
      70. FIGURE 35 CUMMINS INC.: GEOGRAPHIC REVENUE MIX, 2032 (%) 99
      71.  
      72. FIGURE 36 CUMMINS INC.: KEY DEVELOPMENTS, 2032 (%) 101
      73.  
      74. FIGURE 37 CUMMINS INC.: SWOT ANALYSIS 102
      75.  
      76. FIGURE 38 GENERAC HOLDINGS INC : TOTAL REVENUE VS SEGMENTAL REVENUE (USD MILLION) 103
      77.  
      78. FIGURE 39 GENERAC HOLDINGS INC: GEOGRAPHICAL REVENUE MIX, 2032 (%) 104
      79.  
      80. FIGURE 40 GENERAC HOLDINGS INC: KEY DEVELOPMENTS, 2032 (%) 105
      81.  
      82. FIGURE 41 MITSUBISHI HEAVY INDUSTRIES ENGINE & TURBOCHARGER, LTD.: TOTAL REVENUE VS SEGMENTAL REVENUE, 2023-2032 (USD MILLION) 106
      83.  
      84. FIGURE 42 MITSUBISHI HEAVY INDUSTRIES ENGINE & TURBOCHARGER, LTD.: GEOGRAPHICAL REVENUE MIX, 2032 (%) 107
      85.  
      86. FIGURE 43 MITSUBISHI HEAVY INDUSTRIES ENGINE & TURBOCHARGER, LTD.: SWOT ANALYSIS 108
      87.  
      88. FIGURE 44 KOHLER CO.: KEY DEVELOPMENTS, 2032 (%) 112
      89.  
      90. FIGURE 45 ROLLS-ROYCE POWER SYSTEMS AG: TOTAL REVENUE VS SEGMENTAL REVENUE, 2023-2032 (USD MILLION) 113
      91.  
      92. FIGURE 46 ROLLS-ROYCE POWER SYSTEMS AG: GEOGRAPHICAL REVENUE MIX, 2032 (%) 114
      93.  
      94. FIGURE 47 ROLLS-ROYCE POWER SYSTEMS AG: KEY DEVELOPMENTS, 2032 (%) 115
      95.  
      96. FIGURE 48 ROLLS-ROYCE POWER SYSTEMS AG: SWOT ANALYSIS 116
      97.  
      98. FIGURE 49 AGGREKO PLC: TOTAL REVENUE VS SEGMENTAL REVENUE, 2023-2032 (USD MILLION) 119
      99.  
      100. FIGURE 50 AGGREKO PLC: GEOGRAPHICAL REVENUE MIX, 2032 (%) 120
      101.  
      102. FIGURE 51 AGGREKO PLC: KEY DEVELOPMENTS, 2032 (%) 121
      103.  
      104. FIGURE 52 AGGREKO PLC: SWOT ANALYSIS 121
      105.  
      106. FIGURE 53 MAN DIESEL & TURBO: TOTAL REVENUE VS SEGMENTAL REVENUE, 2023-2032 (USD MILLION) 122
      107.  
      108. FIGURE 54 MAN DIESEL & TURBO: KEY DEVELOPMENTS, 2032 (%) 124
      109.  
      110. FIGURE 55 MAN DIESEL & TURBO: SWOT ANALYSIS 124
      111.  
      112. FIGURE 56 GENERAL ELECTRIC COMPANY: TOTAL REVENUE VS SEGMENTAL REVENUE, 2023-2032 (USD MILLION) 125
      113.  
      114. FIGURE 57 GENERAL ELECTRIC COMPANY: SWOT ANALYSIS 126
      115.  
      116. FIGURE 58 WÄRTSILÄ CORPORATION: TOTAL REVENUE VS SEGMENTAL REVENUE, 2023-2032 (USD MILLION) 127
      117.  
      118. FIGURE 59 WÄRTSILÄ CORPORATION: GEOGRAPHICAL REVENUE MIX, 2032 (%) 128
      119.  
      120. FIGURE 60 WÄRTSILÄ CORPORATION: KEY DEVELOPMENTS, 2032 (%) 129
      121.  
      122. FIGURE 61 WÄRTSILÄ CORPORATION: SWOT ANALYSIS 130

    South America & Africa Diesel Generator Market Segmentation

    Market Segmentation Overview

    • Detailed segmentation data will be available in the full report
    • Comprehensive analysis by multiple parameters
    • Regional and country-level breakdowns
    • Market size forecasts by segment
    Infographic

    Free Sample Request

    Kindly complete the form below to receive a free sample of this Report

    Get Free Sample

    Customer Strories

    “I am very pleased with how market segments have been defined in a relevant way for my purposes (such as "Portable Freezers & refrigerators" and "last-mile"). In general the report is well structured. Thanks very much for your efforts.”

    Victoria Milne

    Founder
    Case Study
    Chemicals and Materials