ID: MRFR/FnB/3685-CR
186 Pages
Harshita Gorde
Last Updated: April 06, 2026
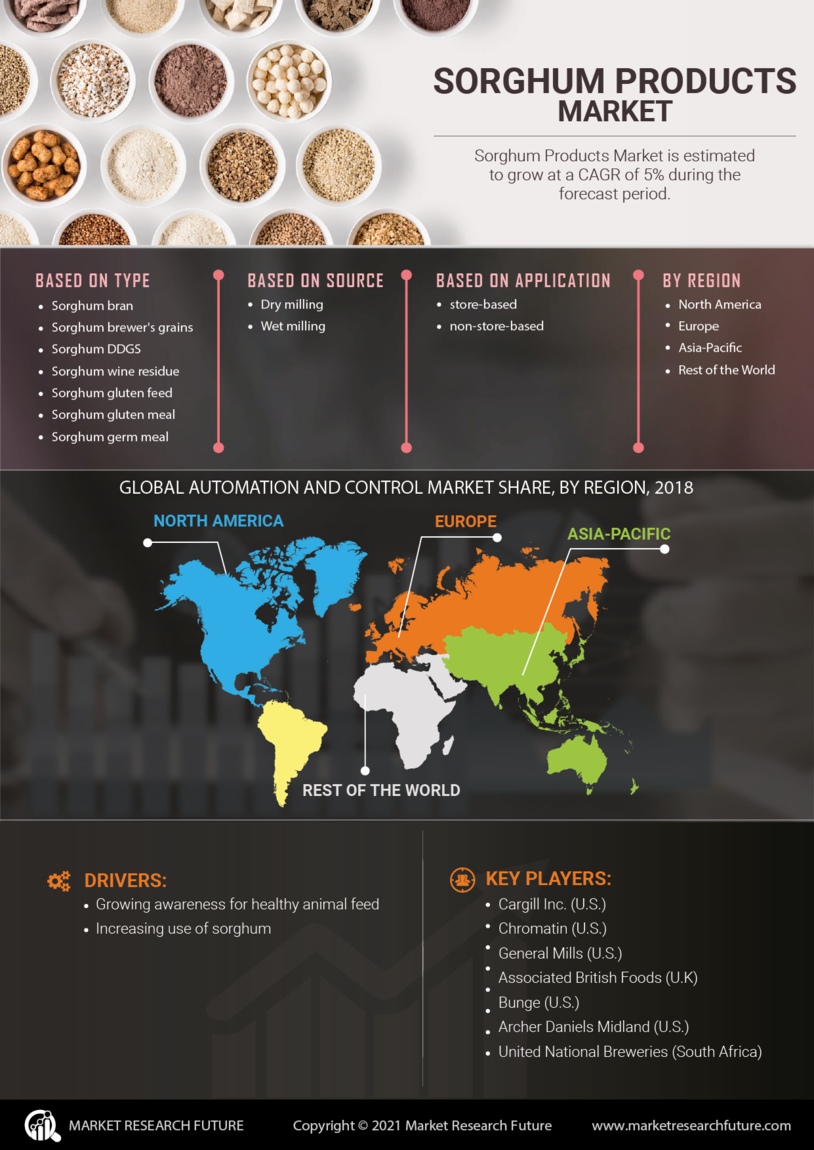
Sorghum By-Products Market Size, Share, Industry Trend & Analysis Research Report By Application (Animal Feed, FoodBeverage, Biofuels, Industrial, Pharmaceuticals), By Type (Sorghum Bran, Sorghum Flour, Sorghum Syrup, Sorghum Grains, Sorghum Starch), By Form (Powder, Granular, Liquid, Pellets), By End Use (Agriculture, Food Industry, Bioenergy, Healthcare) andBy Regional (North America, Europe, South America, Asia Pacific, Middle East and Africa)- Forecast to 2035