×
  • Cat-intel
  • MedIntelliX
  • Resources
  • About Us
  • Hero Background
    English
    Chinese
    French
    Japanese
    Korean
    German
    Spanish

    Software Defined Radio Market Trends

    ID: MRFR/A&D/4437-CR
    123 Pages
    Swapnil Palwe
    January 2019

    Software Defined Radio Market Research Report Information by Component (Transmitter, Receiver, Software, Auxiliary System), Frequency Band (HF, VHF, UHF), Platform (Land, Airborne, Naval, Space), Application (Defense, Commercial) and Region - Forecast till 2032

    Share:
    Download PDF ×

    We do not share your information with anyone. However, we may send you emails based on your report interest from time to time. You may contact us at any time to opt-out.

    Software Defined Radio Market Infographic
    Purchase Options

    Market Trends

    Key Emerging Trends in the Software Defined Radio Market

    Market share positioning in the Software Defined Radio (SDR) market involves strategic approaches that leverage the unique characteristics and capabilities of SDR technologies. Technological leadership stands out as a primary positioning strategy, with companies striving to be at the forefront of innovation in digital signal processing, radio frequency (RF) hardware, and software algorithms. Those that invest in cutting-edge SDR solutions, offering enhanced performance, flexibility, and interoperability, position themselves as leaders, attracting clients seeking state-of-the-art and future-proof communication systems.

    Strategic collaborations and partnerships are instrumental in market share positioning within the SDR sector. By forming alliances with other industry players, technology providers, and government agencies, companies can create comprehensive and integrated solutions. Collaborations enable interoperability, ease integration challenges, and enhance the overall value proposition of SDR offerings. Companies that foster strategic partnerships not only differentiate themselves but also contribute to the development of cohesive and interoperable SDR ecosystems.

    A customer-centric approach is pivotal in market share positioning. Understanding the specific needs and challenges of end-users allows companies to tailor their SDR solutions accordingly. User-friendly interfaces, seamless integration with existing communication infrastructure, and a focus on enhancing the overall user experience contribute to market differentiation. Companies that prioritize customer satisfaction and engagement build long-lasting relationships, fostering loyalty and positive word-of-mouth referrals.

    Strategic marketing and branding efforts play a crucial role in market share positioning in the SDR market. Establishing a strong brand presence through targeted marketing campaigns, thought leadership, and participation in industry events enhances market visibility. A compelling and distinct brand image that communicates innovation, reliability, and a commitment to excellence can influence customer perceptions and preferences, ultimately contributing to a larger market share.

    Cost leadership is a significant strategy for market positioning, especially in an industry where cost-effectiveness is a critical consideration. Companies that offer competitive pricing without compromising the quality and performance of their SDR solutions gain a competitive advantage. The ability to deliver cost-efficient SDR technologies positions these companies favorably, particularly in regions with budget constraints and cost-sensitive procurement practices.

    Regulatory compliance is a fundamental aspect of market share positioning in the SDR market. Adherence to national and international regulations, safety standards, and spectrum policies is not only a legal requirement but also a key factor in gaining the trust of clients, government agencies, and stakeholders. Companies that demonstrate a commitment to compliance and ethical business practices position themselves as reliable and responsible partners in the development and implementation of SDR solutions.

    The ability to customize and adapt SDR solutions to the unique requirements of different industries and applications is a strategic market positioning approach. SDR technologies find applications in diverse sectors, from defense and aerospace to telecommunications, public safety, and industrial IoT. Companies that offer flexible and scalable solutions, tailored to the specific demands of various markets, position themselves as adaptable and capable of addressing the nuanced challenges of different industries.

    Strategic geographical positioning and global presence contribute to market share strategies in the SDR market. Establishing a strong international footprint allows companies to access diverse markets, respond effectively to global trends, and address region-specific challenges. Regional partnerships and a deep understanding of local regulations and cultural nuances enhance a company's ability to position itself as a global player capable of meeting the varied demands of SDR implementations worldwide.

    Innovation in cybersecurity features and secure communication is a key aspect of market share positioning in the SDR market. With an increasing focus on the security of communication systems, companies that invest in advanced encryption, secure protocols, and resilience against cyber threats position themselves as leaders in addressing the evolving security landscape. The ability to provide secure and reliable SDR solutions is crucial in gaining the trust of clients in defense, public safety, and critical infrastructure applications.

    Author
    Swapnil Palwe
    Team Lead - Research

    With a technical background as Bachelor's in Mechanical Engineering, with MBA in Operations Management , Swapnil has 6+ years of experience in market research, consulting and analytics with the tasks of data mining, analysis, and project execution. He is the POC for our clients, for their consulting projects running under the Automotive/A&D domain. Swapnil has worked on major projects in verticals such as Aerospace & Defense, Automotive and many other domain projects. He has worked on projects for fortune 500 companies' syndicate and consulting projects along with several government projects.

    Leave a Comment

    FAQs

    What is the estimated growth rate of the global software defined radio market?

    software defined radio market is projected to register a moderate 6.6% CAGR by 2023-2032

    Which factors are poised to drive the market growth?

    The massive demand for software defined radio due to advancements in technology and the development of digital electronics is the primary growth inducer of the market.

    Which component is expected to witness the highest growth?

    The transmitter segment is expected to observe substantial demand over the review period.

    Which platform is expected to observe the highest growth?

    The airborne segment is expected to secure the highest CAGR.

    What is the application segment of the global software defined radio market expected to witness the highest growth?

    The defense segment is slated to expand as the fastest-growing segment.

    Which region of the global satellite based augmentation systems market expected to witness the highest growth?

    The North American region is slated to expand as the fastest-growing segment.

    Who are the significant players operative in the global software defined radio market?

    A few emminent market players operating in the global software defined radio market are BAE Systems (UK), Elbit Systems (US), Harris Corporation (US), General Dynamics (US), among others.

    Market Summary

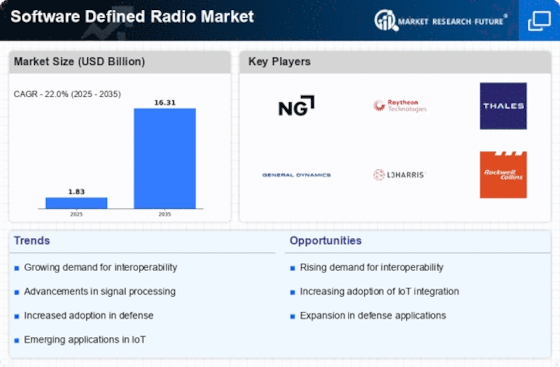
    As per MRFR analysis, the Software Defined Radio Market Size was estimated at 1.83 USD Billion in 2024. The Software Defined Radio industry is projected to grow from 2.233 USD Billion in 2025 to 16.31 USD Billion by 2035, exhibiting a compound annual growth rate (CAGR) of 22.0 during the forecast period 2025 - 2035.

    Key Market Trends & Highlights

    The Software Defined Radio Market is poised for substantial growth driven by technological advancements and increasing demand across various sectors.

    • North America remains the largest market for Software Defined Radio, driven by robust defense spending and technological innovation.
    • The Asia-Pacific region is emerging as the fastest-growing market, fueled by rapid economic development and increasing investments in communication technologies.
    • The Airborne segment holds the largest share, while the Naval segment is experiencing the fastest growth due to heightened maritime security concerns.
    • Key market drivers include advancements in communication technologies and increased adoption of IoT devices, which are shaping the future of Software Defined Radio.

    Market Size & Forecast

    2024 Market Size 1.83 (USD Billion)
    2035 Market Size 16.31 (USD Billion)
    CAGR (2025 - 2035) 22.0%
    Largest Regional Market Share in 2024 North America

    Major Players

    <p>Northrop Grumman (US), Raytheon Technologies (US), Thales Group (FR), General Dynamics (US), L3Harris Technologies (US), Rockwell Collins (US), Boeing (US), Elbit Systems (IL), Harris Corporation (US)</p>

    Market Trends

    The Software Defined Radio Market is currently experiencing a transformative phase, driven by advancements in technology and increasing demand for flexible communication systems. This market encompasses a wide range of applications, including military, commercial, and public safety sectors. The shift towards digital communication and the need for interoperability among various communication systems are propelling the growth of this market. As organizations seek to enhance their operational efficiency, the adoption of software defined radios is becoming more prevalent. Furthermore, the integration of artificial intelligence and machine learning into these systems is likely to enhance their capabilities, making them more adaptable to changing environments. In addition, the Software Defined Radio Market is witnessing a surge in investment from both public and private sectors. This influx of capital is aimed at research and development, fostering innovation and improving product offerings. The increasing focus on secure communication channels, particularly in defense and emergency services, is also contributing to market expansion. As the landscape evolves, stakeholders must remain vigilant to emerging trends and technologies that could reshape the future of communication. Overall, the Software Defined Radio Market appears poised for substantial growth, driven by technological advancements and a growing need for versatile communication solutions.

    Integration of AI and Machine Learning

    The incorporation of artificial intelligence and machine learning into software defined radios is becoming increasingly prevalent. This trend suggests that these technologies can enhance the adaptability and efficiency of communication systems, allowing for real-time data processing and improved decision-making capabilities.

    Growing Demand for Interoperability

    There is a rising need for interoperability among various communication systems across different sectors. This trend indicates that organizations are seeking solutions that can seamlessly integrate with existing infrastructure, thereby enhancing operational efficiency and collaboration.

    Investment in R&D

    An increase in investment from both public and private sectors is evident, focusing on research and development within the Software Defined Radio Market. This trend highlights the commitment to innovation and the continuous improvement of product offerings to meet evolving market demands.

    Software Defined Radio Market Market Drivers

    Increased Adoption of IoT Devices

    The Software Defined Radio Market is poised for growth due to the increased adoption of Internet of Things (IoT) devices across various sectors. As IoT applications proliferate, the need for versatile communication solutions becomes evident. Software defined radios offer the flexibility to support multiple protocols and standards, making them ideal for IoT applications that require seamless connectivity. The market for IoT devices is projected to expand rapidly, with estimates suggesting that the number of connected devices could exceed 30 billion by 2030. This surge in IoT adoption is likely to drive demand for software defined radios, as they enable efficient data transmission and interoperability among diverse devices.

    Military and Defense Applications

    The Software Defined Radio Market is significantly influenced by the military and defense sectors, where the demand for advanced communication systems is paramount. Military applications require robust, secure, and adaptable communication solutions that can operate in diverse environments. Software defined radios provide the necessary flexibility to switch between different communication protocols and frequencies, ensuring reliable communication in critical situations. The defense sector's investment in modernizing communication infrastructure is expected to drive substantial growth in the market. Reports indicate that military spending on software defined radios could reach billions of dollars, reflecting the strategic importance of secure and efficient communication systems in defense operations.

    Emerging Markets and Economic Growth

    The Software Defined Radio Market is experiencing growth driven by emerging markets and their economic development. As countries invest in modernizing their communication infrastructure, the demand for advanced communication technologies, including software defined radios, is on the rise. Emerging economies are increasingly adopting digital technologies, which necessitate flexible and efficient communication solutions. The expansion of telecommunications networks in these regions is expected to create new opportunities for software defined radio manufacturers. Market analysts suggest that the growth in these emerging markets could contribute significantly to the overall expansion of the software defined radio market, potentially leading to a more competitive landscape.

    Advancements in Communication Technologies

    The Software Defined Radio Market is experiencing a surge due to rapid advancements in communication technologies. Innovations in wireless communication, such as 5G and beyond, necessitate flexible and adaptable radio systems. These advancements enable improved data rates and reduced latency, which are critical for applications ranging from mobile communications to IoT devices. The increasing complexity of communication networks demands software-defined radios that can be easily updated and reconfigured. As a result, the market is projected to grow significantly, with estimates suggesting a compound annual growth rate of over 10% in the coming years. This growth is driven by the need for efficient spectrum utilization and the ability to support multiple communication standards within a single device.

    Regulatory Support and Spectrum Management

    The Software Defined Radio Market benefits from increasing regulatory support aimed at enhancing spectrum management. Governments and regulatory bodies are recognizing the need for efficient spectrum utilization to accommodate the growing demand for wireless communication. Software defined radios facilitate dynamic spectrum access, allowing users to adapt to changing spectrum availability and optimize communication performance. This regulatory push is expected to foster innovation and investment in software defined radio technologies. As a result, the market is likely to witness a favorable environment for growth, with initiatives aimed at promoting the development and deployment of software defined radios in various applications.

    Market Segment Insights

    By Platform: Airborne (Largest) vs. Naval (Fastest-Growing)

    <p>In the Software Defined Radio Market, the platform segment showcases a diversified distribution, with airborne applications commanding the largest share. Airborne systems leverage advanced communication capabilities, primarily driven by the growing demand for enhanced situational awareness and operational efficiency in military and commercial aviation. In contrast, naval platforms are emerging as the fastest-growing segment, driven by increased investments in naval defense systems and the need for upgraded communication technologies to support effective maritime operations.</p>

    <p>Airborne (Dominant) vs. Naval (Emerging)</p>

    <p>The Airborne segment in the Software Defined Radio Market is characterized by its dominance due to the rising integration of SDR technologies in both military and commercial aircraft. These systems support complex communication tasks and offer multi-band capabilities, improving interoperability across different platforms. Meanwhile, the Naval segment is categorized as emerging, reflecting its rapid growth driven by technological advancements and defense upgrades. Navies worldwide are increasingly adopting SDR for improved fleet communication, scalability, and adaptability to evolving operational requirements.</p>

    By Application: Defense (Largest) vs. Commercial (Fastest-Growing)

    <p>In the Software Defined Radio (SDR) market, the application segment is primarily divided into Defense and Commercial sectors. The Defense application holds a significant portion of the market share, leveraging reliable and advanced communication capabilities for military operations and national security. The intense focus on modernizing defense communication systems and enhancing interoperability between forces solidifies its leading position in the market. Conversely, the Commercial application segment is witnessing rapid growth, driven by increased demand for advanced communication technologies across various industries. Factors such as the proliferation of mobile communications, Internet of Things (IoT) applications, and the need for efficient spectrum management are propelling the commercial SDR adoption, indicating a robust growth trajectory ahead.</p>

    <p>Application: Defense (Dominant) vs. Commercial (Emerging)</p>

    <p>The Defense segment of the Software Defined Radio market is characterized by its substantial investment in research and development, focusing on sophisticated technology that ensures secure and robust communications for military applications. This segment benefits from government funding and a high level of technological innovation, allowing for integrations with various platforms like drones and tactical networks. On the other hand, the Commercial segment is emerging rapidly, driven by the need for flexible and cost-effective communication systems in industries such as telecommunications, transportation, and public safety. It is characterized by diverse applications, encouraging innovation and adaptability, as businesses seek solutions that can efficiently manage communication needs in a fast-paced environment.</p>

    By Type: Terrestrial Trunked Radio (Largest) vs. Joint Tactical Radio Systems (Fastest-Growing)

    <p>The Software Defined Radio Market exhibits a diverse range of segment values, with Terrestrial Trunked Radio (Tetra) leading the market share due to its widespread adoption in professional mobile radio communications. General-Purpose Radio and Cognitive Radios follow, catering to various commercial and governmental needs. The Joint Tactical Radio Systems (JTRS) segment is gaining momentum, driven by advancements in secure communications and data interoperability, reflecting a critical evolution in defense capabilities.</p>

    <p>Technology: Tetra (Dominant) vs. JTRS (Emerging)</p>

    <p>Terrestrial Trunked Radio (Tetra) stands out as a dominant force in the Software Defined Radio Market, primarily due to its reliability, efficient spectrum usage, and robust features tailored for public safety and emergency services. This established technology supports seamless communication and is deeply embedded in various sectors. On the other hand, Joint Tactical Radio Systems (JTRS) represents an emerging segment with a focus on adaptive communications for military applications, leveraging software-defined functionalities to enhance performance and flexibility. Both technologies are vital in shaping the future of secure communication, catering to different user requirements and operational environments.</p>

    Get more detailed insights about Software Defined Radio Market Research Report – Forecast to 2035

    Regional Insights

    Key Companies in the Software Defined Radio Market market include

    Industry Developments

    In January, as well as, July 2020, many key market players such as Elbit Systems, BAE Systems, L3Harris Technologies, General Dynamics Corporation, as well as, Leonardo S.p.A. have received orders of bulk quantities from the defense sector of these countries.

    The Swedish Army extended a contract to Elbit System for supplying 1,000 E-LynX SDR systems. This contract will be manufactured by the company subsidiaries that are based out in Germany. This kind of contract will help manufacture products with advanced features and will help the market grow in global competition.

    The USA Army extended another project to L3Harris Technologies Inc. for low-rate initial production (LRIP). The estimated value of the order stands at 95 million. This took place in April 2020.

    The same company in July, as well as, November 2019, had contracts awarded by the US Air Force, as well as, the Special Operation Forces operators for supplying handheld tactical radios, as well as, wideband airborne HF radios. The contact with the SOF operators amounted to USD 86 million.

    Future Outlook

    Software Defined Radio Market Future Outlook

    <p>The Software Defined Radio Market is projected to grow at a 22.0% CAGR from 2024 to 2035, driven by advancements in communication technologies and increasing demand for flexible radio solutions.</p>

    New opportunities lie in:

    • <p>Development of integrated SDR platforms for military applications.</p>
    • <p>Expansion into IoT-enabled SDR devices for smart cities.</p>
    • <p>Partnerships with telecom companies for 5G SDR solutions.</p>

    <p>By 2035, the Software Defined Radio Market is expected to be robust, reflecting substantial growth and innovation.</p>

    Market Segmentation

    Software Defined Radio Market Type Outlook

    • Terrestrial trunked radio (Tetra)
    • General-purpose radio
    • Joint tactical radio systems (JTRS)
    • Cognitive or intelligent radio

    Software Defined Radio Market Platform Outlook

    • Airborne
    • Space
    • Land
    • Naval

    Software Defined Radio Market Application Outlook

    • Defense
    • Commercial

    Report Scope

    MARKET SIZE 20241.83(USD Billion)
    MARKET SIZE 20252.233(USD Billion)
    MARKET SIZE 203516.31(USD Billion)
    COMPOUND ANNUAL GROWTH RATE (CAGR)22.0% (2024 - 2035)
    REPORT COVERAGERevenue Forecast, Competitive Landscape, Growth Factors, and Trends
    BASE YEAR2024
    Market Forecast Period2025 - 2035
    Historical Data2019 - 2024
    Market Forecast UnitsUSD Billion
    Key Companies ProfiledMarket analysis in progress
    Segments CoveredMarket segmentation analysis in progress
    Key Market OpportunitiesIntegration of artificial intelligence enhances adaptability in the Software Defined Radio Market.
    Key Market DynamicsRising demand for flexible communication solutions drives innovation and competition in the Software Defined Radio market.
    Countries CoveredNorth America, Europe, APAC, South America, MEA

    FAQs

    What is the estimated growth rate of the global software defined radio market?

    software defined radio market is projected to register a moderate 6.6% CAGR by 2023-2032

    Which factors are poised to drive the market growth?

    The massive demand for software defined radio due to advancements in technology and the development of digital electronics is the primary growth inducer of the market.

    Which component is expected to witness the highest growth?

    The transmitter segment is expected to observe substantial demand over the review period.

    Which platform is expected to observe the highest growth?

    The airborne segment is expected to secure the highest CAGR.

    What is the application segment of the global software defined radio market expected to witness the highest growth?

    The defense segment is slated to expand as the fastest-growing segment.

    Which region of the global satellite based augmentation systems market expected to witness the highest growth?

    The North American region is slated to expand as the fastest-growing segment.

    Who are the significant players operative in the global software defined radio market?

    A few emminent market players operating in the global software defined radio market are BAE Systems (UK), Elbit Systems (US), Harris Corporation (US), General Dynamics (US), among others.

    1. SECTION I: EXECUTIVE SUMMARY AND KEY HIGHLIGHTS
      1. | 1.1 EXECUTIVE SUMMARY
      2. | | 1.1.1 Market Overview
      3. | | 1.1.2 Key Findings
      4. | | 1.1.3 Market Segmentation
      5. | | 1.1.4 Competitive Landscape
      6. | | 1.1.5 Challenges and Opportunities
      7. | | 1.1.6 Future Outlook
    2. SECTION II: SCOPING, METHODOLOGY AND MARKET STRUCTURE
      1. | 2.1 MARKET INTRODUCTION
      2. | | 2.1.1 Definition
      3. | | 2.1.2 Scope of the study
      4. | | | 2.1.2.1 Research Objective
      5. | | | 2.1.2.2 Assumption
      6. | | | 2.1.2.3 Limitations
      7. | 2.2 RESEARCH METHODOLOGY
      8. | | 2.2.1 Overview
      9. | | 2.2.2 Data Mining
      10. | | 2.2.3 Secondary Research
      11. | | 2.2.4 Primary Research
      12. | | | 2.2.4.1 Primary Interviews and Information Gathering Process
      13. | | | 2.2.4.2 Breakdown of Primary Respondents
      14. | | 2.2.5 Forecasting Model
      15. | | 2.2.6 Market Size Estimation
      16. | | | 2.2.6.1 Bottom-Up Approach
      17. | | | 2.2.6.2 Top-Down Approach
      18. | | 2.2.7 Data Triangulation
      19. | | 2.2.8 Validation
    3. SECTION III: QUALITATIVE ANALYSIS
      1. | 3.1 MARKET DYNAMICS
      2. | | 3.1.1 Overview
      3. | | 3.1.2 Drivers
      4. | | 3.1.3 Restraints
      5. | | 3.1.4 Opportunities
      6. | 3.2 MARKET FACTOR ANALYSIS
      7. | | 3.2.1 Value chain Analysis
      8. | | 3.2.2 Porter's Five Forces Analysis
      9. | | | 3.2.2.1 Bargaining Power of Suppliers
      10. | | | 3.2.2.2 Bargaining Power of Buyers
      11. | | | 3.2.2.3 Threat of New Entrants
      12. | | | 3.2.2.4 Threat of Substitutes
      13. | | | 3.2.2.5 Intensity of Rivalry
      14. | | 3.2.3 COVID-19 Impact Analysis
      15. | | | 3.2.3.1 Market Impact Analysis
      16. | | | 3.2.3.2 Regional Impact
      17. | | | 3.2.3.3 Opportunity and Threat Analysis
    4. SECTION IV: QUANTITATIVE ANALYSIS
      1. | 4.1 Aerospace & Defense, BY Platform (USD Billion)
      2. | | 4.1.1 Airborne
      3. | | 4.1.2 Space
      4. | | 4.1.3 Land
      5. | | 4.1.4 Naval
      6. | 4.2 Aerospace & Defense, BY Application (USD Billion)
      7. | | 4.2.1 Defense
      8. | | 4.2.2 Commercial
      9. | 4.3 Aerospace & Defense, BY Type (USD Billion)
      10. | | 4.3.1 Terrestrial trunked radio (Tetra)
      11. | | 4.3.2 General-purpose radio
      12. | | 4.3.3 Joint tactical radio systems (JTRS)
      13. | | 4.3.4 Cognitive or intelligent radio
      14. | 4.4 Aerospace & Defense, BY Region (USD Billion)
      15. | | 4.4.1 North America
      16. | | | 4.4.1.1 US
      17. | | | 4.4.1.2 Canada
      18. | | 4.4.2 Europe
      19. | | | 4.4.2.1 Germany
      20. | | | 4.4.2.2 UK
      21. | | | 4.4.2.3 France
      22. | | | 4.4.2.4 Russia
      23. | | | 4.4.2.5 Italy
      24. | | | 4.4.2.6 Spain
      25. | | | 4.4.2.7 Rest of Europe
      26. | | 4.4.3 APAC
      27. | | | 4.4.3.1 China
      28. | | | 4.4.3.2 India
      29. | | | 4.4.3.3 Japan
      30. | | | 4.4.3.4 South Korea
      31. | | | 4.4.3.5 Malaysia
      32. | | | 4.4.3.6 Thailand
      33. | | | 4.4.3.7 Indonesia
      34. | | | 4.4.3.8 Rest of APAC
      35. | | 4.4.4 South America
      36. | | | 4.4.4.1 Brazil
      37. | | | 4.4.4.2 Mexico
      38. | | | 4.4.4.3 Argentina
      39. | | | 4.4.4.4 Rest of South America
      40. | | 4.4.5 MEA
      41. | | | 4.4.5.1 GCC Countries
      42. | | | 4.4.5.2 South Africa
      43. | | | 4.4.5.3 Rest of MEA
    5. SECTION V: COMPETITIVE ANALYSIS
      1. | 5.1 Competitive Landscape
      2. | | 5.1.1 Overview
      3. | | 5.1.2 Competitive Analysis
      4. | | 5.1.3 Market share Analysis
      5. | | 5.1.4 Major Growth Strategy in the Aerospace & Defense
      6. | | 5.1.5 Competitive Benchmarking
      7. | | 5.1.6 Leading Players in Terms of Number of Developments in the Aerospace & Defense
      8. | | 5.1.7 Key developments and growth strategies
      9. | | | 5.1.7.1 New Product Launch/Service Deployment
      10. | | | 5.1.7.2 Merger & Acquisitions
      11. | | | 5.1.7.3 Joint Ventures
      12. | | 5.1.8 Major Players Financial Matrix
      13. | | | 5.1.8.1 Sales and Operating Income
      14. | | | 5.1.8.2 Major Players R&D Expenditure. 2023
      15. | 5.2 Company Profiles
      16. | | 5.2.1 Northrop Grumman (US)
      17. | | | 5.2.1.1 Financial Overview
      18. | | | 5.2.1.2 Products Offered
      19. | | | 5.2.1.3 Key Developments
      20. | | | 5.2.1.4 SWOT Analysis
      21. | | | 5.2.1.5 Key Strategies
      22. | | 5.2.2 Raytheon Technologies (US)
      23. | | | 5.2.2.1 Financial Overview
      24. | | | 5.2.2.2 Products Offered
      25. | | | 5.2.2.3 Key Developments
      26. | | | 5.2.2.4 SWOT Analysis
      27. | | | 5.2.2.5 Key Strategies
      28. | | 5.2.3 Thales Group (FR)
      29. | | | 5.2.3.1 Financial Overview
      30. | | | 5.2.3.2 Products Offered
      31. | | | 5.2.3.3 Key Developments
      32. | | | 5.2.3.4 SWOT Analysis
      33. | | | 5.2.3.5 Key Strategies
      34. | | 5.2.4 General Dynamics (US)
      35. | | | 5.2.4.1 Financial Overview
      36. | | | 5.2.4.2 Products Offered
      37. | | | 5.2.4.3 Key Developments
      38. | | | 5.2.4.4 SWOT Analysis
      39. | | | 5.2.4.5 Key Strategies
      40. | | 5.2.5 L3Harris Technologies (US)
      41. | | | 5.2.5.1 Financial Overview
      42. | | | 5.2.5.2 Products Offered
      43. | | | 5.2.5.3 Key Developments
      44. | | | 5.2.5.4 SWOT Analysis
      45. | | | 5.2.5.5 Key Strategies
      46. | | 5.2.6 Rockwell Collins (US)
      47. | | | 5.2.6.1 Financial Overview
      48. | | | 5.2.6.2 Products Offered
      49. | | | 5.2.6.3 Key Developments
      50. | | | 5.2.6.4 SWOT Analysis
      51. | | | 5.2.6.5 Key Strategies
      52. | | 5.2.7 Boeing (US)
      53. | | | 5.2.7.1 Financial Overview
      54. | | | 5.2.7.2 Products Offered
      55. | | | 5.2.7.3 Key Developments
      56. | | | 5.2.7.4 SWOT Analysis
      57. | | | 5.2.7.5 Key Strategies
      58. | | 5.2.8 Elbit Systems (IL)
      59. | | | 5.2.8.1 Financial Overview
      60. | | | 5.2.8.2 Products Offered
      61. | | | 5.2.8.3 Key Developments
      62. | | | 5.2.8.4 SWOT Analysis
      63. | | | 5.2.8.5 Key Strategies
      64. | | 5.2.9 Harris Corporation (US)
      65. | | | 5.2.9.1 Financial Overview
      66. | | | 5.2.9.2 Products Offered
      67. | | | 5.2.9.3 Key Developments
      68. | | | 5.2.9.4 SWOT Analysis
      69. | | | 5.2.9.5 Key Strategies
      70. | 5.3 Appendix
      71. | | 5.3.1 References
      72. | | 5.3.2 Related Reports
    6. LIST OF FIGURES
      1. | 6.1 MARKET SYNOPSIS
      2. | 6.2 NORTH AMERICA MARKET ANALYSIS
      3. | 6.3 US MARKET ANALYSIS BY PLATFORM
      4. | 6.4 US MARKET ANALYSIS BY APPLICATION
      5. | 6.5 US MARKET ANALYSIS BY TYPE
      6. | 6.6 CANADA MARKET ANALYSIS BY PLATFORM
      7. | 6.7 CANADA MARKET ANALYSIS BY APPLICATION
      8. | 6.8 CANADA MARKET ANALYSIS BY TYPE
      9. | 6.9 EUROPE MARKET ANALYSIS
      10. | 6.10 GERMANY MARKET ANALYSIS BY PLATFORM
      11. | 6.11 GERMANY MARKET ANALYSIS BY APPLICATION
      12. | 6.12 GERMANY MARKET ANALYSIS BY TYPE
      13. | 6.13 UK MARKET ANALYSIS BY PLATFORM
      14. | 6.14 UK MARKET ANALYSIS BY APPLICATION
      15. | 6.15 UK MARKET ANALYSIS BY TYPE
      16. | 6.16 FRANCE MARKET ANALYSIS BY PLATFORM
      17. | 6.17 FRANCE MARKET ANALYSIS BY APPLICATION
      18. | 6.18 FRANCE MARKET ANALYSIS BY TYPE
      19. | 6.19 RUSSIA MARKET ANALYSIS BY PLATFORM
      20. | 6.20 RUSSIA MARKET ANALYSIS BY APPLICATION
      21. | 6.21 RUSSIA MARKET ANALYSIS BY TYPE
      22. | 6.22 ITALY MARKET ANALYSIS BY PLATFORM
      23. | 6.23 ITALY MARKET ANALYSIS BY APPLICATION
      24. | 6.24 ITALY MARKET ANALYSIS BY TYPE
      25. | 6.25 SPAIN MARKET ANALYSIS BY PLATFORM
      26. | 6.26 SPAIN MARKET ANALYSIS BY APPLICATION
      27. | 6.27 SPAIN MARKET ANALYSIS BY TYPE
      28. | 6.28 REST OF EUROPE MARKET ANALYSIS BY PLATFORM
      29. | 6.29 REST OF EUROPE MARKET ANALYSIS BY APPLICATION
      30. | 6.30 REST OF EUROPE MARKET ANALYSIS BY TYPE
      31. | 6.31 APAC MARKET ANALYSIS
      32. | 6.32 CHINA MARKET ANALYSIS BY PLATFORM
      33. | 6.33 CHINA MARKET ANALYSIS BY APPLICATION
      34. | 6.34 CHINA MARKET ANALYSIS BY TYPE
      35. | 6.35 INDIA MARKET ANALYSIS BY PLATFORM
      36. | 6.36 INDIA MARKET ANALYSIS BY APPLICATION
      37. | 6.37 INDIA MARKET ANALYSIS BY TYPE
      38. | 6.38 JAPAN MARKET ANALYSIS BY PLATFORM
      39. | 6.39 JAPAN MARKET ANALYSIS BY APPLICATION
      40. | 6.40 JAPAN MARKET ANALYSIS BY TYPE
      41. | 6.41 SOUTH KOREA MARKET ANALYSIS BY PLATFORM
      42. | 6.42 SOUTH KOREA MARKET ANALYSIS BY APPLICATION
      43. | 6.43 SOUTH KOREA MARKET ANALYSIS BY TYPE
      44. | 6.44 MALAYSIA MARKET ANALYSIS BY PLATFORM
      45. | 6.45 MALAYSIA MARKET ANALYSIS BY APPLICATION
      46. | 6.46 MALAYSIA MARKET ANALYSIS BY TYPE
      47. | 6.47 THAILAND MARKET ANALYSIS BY PLATFORM
      48. | 6.48 THAILAND MARKET ANALYSIS BY APPLICATION
      49. | 6.49 THAILAND MARKET ANALYSIS BY TYPE
      50. | 6.50 INDONESIA MARKET ANALYSIS BY PLATFORM
      51. | 6.51 INDONESIA MARKET ANALYSIS BY APPLICATION
      52. | 6.52 INDONESIA MARKET ANALYSIS BY TYPE
      53. | 6.53 REST OF APAC MARKET ANALYSIS BY PLATFORM
      54. | 6.54 REST OF APAC MARKET ANALYSIS BY APPLICATION
      55. | 6.55 REST OF APAC MARKET ANALYSIS BY TYPE
      56. | 6.56 SOUTH AMERICA MARKET ANALYSIS
      57. | 6.57 BRAZIL MARKET ANALYSIS BY PLATFORM
      58. | 6.58 BRAZIL MARKET ANALYSIS BY APPLICATION
      59. | 6.59 BRAZIL MARKET ANALYSIS BY TYPE
      60. | 6.60 MEXICO MARKET ANALYSIS BY PLATFORM
      61. | 6.61 MEXICO MARKET ANALYSIS BY APPLICATION
      62. | 6.62 MEXICO MARKET ANALYSIS BY TYPE
      63. | 6.63 ARGENTINA MARKET ANALYSIS BY PLATFORM
      64. | 6.64 ARGENTINA MARKET ANALYSIS BY APPLICATION
      65. | 6.65 ARGENTINA MARKET ANALYSIS BY TYPE
      66. | 6.66 REST OF SOUTH AMERICA MARKET ANALYSIS BY PLATFORM
      67. | 6.67 REST OF SOUTH AMERICA MARKET ANALYSIS BY APPLICATION
      68. | 6.68 REST OF SOUTH AMERICA MARKET ANALYSIS BY TYPE
      69. | 6.69 MEA MARKET ANALYSIS
      70. | 6.70 GCC COUNTRIES MARKET ANALYSIS BY PLATFORM
      71. | 6.71 GCC COUNTRIES MARKET ANALYSIS BY APPLICATION
      72. | 6.72 GCC COUNTRIES MARKET ANALYSIS BY TYPE
      73. | 6.73 SOUTH AFRICA MARKET ANALYSIS BY PLATFORM
      74. | 6.74 SOUTH AFRICA MARKET ANALYSIS BY APPLICATION
      75. | 6.75 SOUTH AFRICA MARKET ANALYSIS BY TYPE
      76. | 6.76 REST OF MEA MARKET ANALYSIS BY PLATFORM
      77. | 6.77 REST OF MEA MARKET ANALYSIS BY APPLICATION
      78. | 6.78 REST OF MEA MARKET ANALYSIS BY TYPE
      79. | 6.79 KEY BUYING CRITERIA OF AEROSPACE & DEFENSE
      80. | 6.80 RESEARCH PROCESS OF MRFR
      81. | 6.81 DRO ANALYSIS OF AEROSPACE & DEFENSE
      82. | 6.82 DRIVERS IMPACT ANALYSIS: AEROSPACE & DEFENSE
      83. | 6.83 RESTRAINTS IMPACT ANALYSIS: AEROSPACE & DEFENSE
      84. | 6.84 SUPPLY / VALUE CHAIN: AEROSPACE & DEFENSE
      85. | 6.85 AEROSPACE & DEFENSE, BY PLATFORM, 2024 (% SHARE)
      86. | 6.86 AEROSPACE & DEFENSE, BY PLATFORM, 2024 TO 2035 (USD Billion)
      87. | 6.87 AEROSPACE & DEFENSE, BY APPLICATION, 2024 (% SHARE)
      88. | 6.88 AEROSPACE & DEFENSE, BY APPLICATION, 2024 TO 2035 (USD Billion)
      89. | 6.89 AEROSPACE & DEFENSE, BY TYPE, 2024 (% SHARE)
      90. | 6.90 AEROSPACE & DEFENSE, BY TYPE, 2024 TO 2035 (USD Billion)
      91. | 6.91 BENCHMARKING OF MAJOR COMPETITORS
    7. LIST OF TABLES
      1. | 7.1 LIST OF ASSUMPTIONS
      2. | | 7.1.1
      3. | 7.2 North America MARKET SIZE ESTIMATES; FORECAST
      4. | | 7.2.1 BY PLATFORM, 2025-2035 (USD Billion)
      5. | | 7.2.2 BY APPLICATION, 2025-2035 (USD Billion)
      6. | | 7.2.3 BY TYPE, 2025-2035 (USD Billion)
      7. | 7.3 US MARKET SIZE ESTIMATES; FORECAST
      8. | | 7.3.1 BY PLATFORM, 2025-2035 (USD Billion)
      9. | | 7.3.2 BY APPLICATION, 2025-2035 (USD Billion)
      10. | | 7.3.3 BY TYPE, 2025-2035 (USD Billion)
      11. | 7.4 Canada MARKET SIZE ESTIMATES; FORECAST
      12. | | 7.4.1 BY PLATFORM, 2025-2035 (USD Billion)
      13. | | 7.4.2 BY APPLICATION, 2025-2035 (USD Billion)
      14. | | 7.4.3 BY TYPE, 2025-2035 (USD Billion)
      15. | 7.5 Europe MARKET SIZE ESTIMATES; FORECAST
      16. | | 7.5.1 BY PLATFORM, 2025-2035 (USD Billion)
      17. | | 7.5.2 BY APPLICATION, 2025-2035 (USD Billion)
      18. | | 7.5.3 BY TYPE, 2025-2035 (USD Billion)
      19. | 7.6 Germany MARKET SIZE ESTIMATES; FORECAST
      20. | | 7.6.1 BY PLATFORM, 2025-2035 (USD Billion)
      21. | | 7.6.2 BY APPLICATION, 2025-2035 (USD Billion)
      22. | | 7.6.3 BY TYPE, 2025-2035 (USD Billion)
      23. | 7.7 UK MARKET SIZE ESTIMATES; FORECAST
      24. | | 7.7.1 BY PLATFORM, 2025-2035 (USD Billion)
      25. | | 7.7.2 BY APPLICATION, 2025-2035 (USD Billion)
      26. | | 7.7.3 BY TYPE, 2025-2035 (USD Billion)
      27. | 7.8 France MARKET SIZE ESTIMATES; FORECAST
      28. | | 7.8.1 BY PLATFORM, 2025-2035 (USD Billion)
      29. | | 7.8.2 BY APPLICATION, 2025-2035 (USD Billion)
      30. | | 7.8.3 BY TYPE, 2025-2035 (USD Billion)
      31. | 7.9 Russia MARKET SIZE ESTIMATES; FORECAST
      32. | | 7.9.1 BY PLATFORM, 2025-2035 (USD Billion)
      33. | | 7.9.2 BY APPLICATION, 2025-2035 (USD Billion)
      34. | | 7.9.3 BY TYPE, 2025-2035 (USD Billion)
      35. | 7.10 Italy MARKET SIZE ESTIMATES; FORECAST
      36. | | 7.10.1 BY PLATFORM, 2025-2035 (USD Billion)
      37. | | 7.10.2 BY APPLICATION, 2025-2035 (USD Billion)
      38. | | 7.10.3 BY TYPE, 2025-2035 (USD Billion)
      39. | 7.11 Spain MARKET SIZE ESTIMATES; FORECAST
      40. | | 7.11.1 BY PLATFORM, 2025-2035 (USD Billion)
      41. | | 7.11.2 BY APPLICATION, 2025-2035 (USD Billion)
      42. | | 7.11.3 BY TYPE, 2025-2035 (USD Billion)
      43. | 7.12 Rest of Europe MARKET SIZE ESTIMATES; FORECAST
      44. | | 7.12.1 BY PLATFORM, 2025-2035 (USD Billion)
      45. | | 7.12.2 BY APPLICATION, 2025-2035 (USD Billion)
      46. | | 7.12.3 BY TYPE, 2025-2035 (USD Billion)
      47. | 7.13 APAC MARKET SIZE ESTIMATES; FORECAST
      48. | | 7.13.1 BY PLATFORM, 2025-2035 (USD Billion)
      49. | | 7.13.2 BY APPLICATION, 2025-2035 (USD Billion)
      50. | | 7.13.3 BY TYPE, 2025-2035 (USD Billion)
      51. | 7.14 China MARKET SIZE ESTIMATES; FORECAST
      52. | | 7.14.1 BY PLATFORM, 2025-2035 (USD Billion)
      53. | | 7.14.2 BY APPLICATION, 2025-2035 (USD Billion)
      54. | | 7.14.3 BY TYPE, 2025-2035 (USD Billion)
      55. | 7.15 India MARKET SIZE ESTIMATES; FORECAST
      56. | | 7.15.1 BY PLATFORM, 2025-2035 (USD Billion)
      57. | | 7.15.2 BY APPLICATION, 2025-2035 (USD Billion)
      58. | | 7.15.3 BY TYPE, 2025-2035 (USD Billion)
      59. | 7.16 Japan MARKET SIZE ESTIMATES; FORECAST
      60. | | 7.16.1 BY PLATFORM, 2025-2035 (USD Billion)
      61. | | 7.16.2 BY APPLICATION, 2025-2035 (USD Billion)
      62. | | 7.16.3 BY TYPE, 2025-2035 (USD Billion)
      63. | 7.17 South Korea MARKET SIZE ESTIMATES; FORECAST
      64. | | 7.17.1 BY PLATFORM, 2025-2035 (USD Billion)
      65. | | 7.17.2 BY APPLICATION, 2025-2035 (USD Billion)
      66. | | 7.17.3 BY TYPE, 2025-2035 (USD Billion)
      67. | 7.18 Malaysia MARKET SIZE ESTIMATES; FORECAST
      68. | | 7.18.1 BY PLATFORM, 2025-2035 (USD Billion)
      69. | | 7.18.2 BY APPLICATION, 2025-2035 (USD Billion)
      70. | | 7.18.3 BY TYPE, 2025-2035 (USD Billion)
      71. | 7.19 Thailand MARKET SIZE ESTIMATES; FORECAST
      72. | | 7.19.1 BY PLATFORM, 2025-2035 (USD Billion)
      73. | | 7.19.2 BY APPLICATION, 2025-2035 (USD Billion)
      74. | | 7.19.3 BY TYPE, 2025-2035 (USD Billion)
      75. | 7.20 Indonesia MARKET SIZE ESTIMATES; FORECAST
      76. | | 7.20.1 BY PLATFORM, 2025-2035 (USD Billion)
      77. | | 7.20.2 BY APPLICATION, 2025-2035 (USD Billion)
      78. | | 7.20.3 BY TYPE, 2025-2035 (USD Billion)
      79. | 7.21 Rest of APAC MARKET SIZE ESTIMATES; FORECAST
      80. | | 7.21.1 BY PLATFORM, 2025-2035 (USD Billion)
      81. | | 7.21.2 BY APPLICATION, 2025-2035 (USD Billion)
      82. | | 7.21.3 BY TYPE, 2025-2035 (USD Billion)
      83. | 7.22 South America MARKET SIZE ESTIMATES; FORECAST
      84. | | 7.22.1 BY PLATFORM, 2025-2035 (USD Billion)
      85. | | 7.22.2 BY APPLICATION, 2025-2035 (USD Billion)
      86. | | 7.22.3 BY TYPE, 2025-2035 (USD Billion)
      87. | 7.23 Brazil MARKET SIZE ESTIMATES; FORECAST
      88. | | 7.23.1 BY PLATFORM, 2025-2035 (USD Billion)
      89. | | 7.23.2 BY APPLICATION, 2025-2035 (USD Billion)
      90. | | 7.23.3 BY TYPE, 2025-2035 (USD Billion)
      91. | 7.24 Mexico MARKET SIZE ESTIMATES; FORECAST
      92. | | 7.24.1 BY PLATFORM, 2025-2035 (USD Billion)
      93. | | 7.24.2 BY APPLICATION, 2025-2035 (USD Billion)
      94. | | 7.24.3 BY TYPE, 2025-2035 (USD Billion)
      95. | 7.25 Argentina MARKET SIZE ESTIMATES; FORECAST
      96. | | 7.25.1 BY PLATFORM, 2025-2035 (USD Billion)
      97. | | 7.25.2 BY APPLICATION, 2025-2035 (USD Billion)
      98. | | 7.25.3 BY TYPE, 2025-2035 (USD Billion)
      99. | 7.26 Rest of South America MARKET SIZE ESTIMATES; FORECAST
      100. | | 7.26.1 BY PLATFORM, 2025-2035 (USD Billion)
      101. | | 7.26.2 BY APPLICATION, 2025-2035 (USD Billion)
      102. | | 7.26.3 BY TYPE, 2025-2035 (USD Billion)
      103. | 7.27 MEA MARKET SIZE ESTIMATES; FORECAST
      104. | | 7.27.1 BY PLATFORM, 2025-2035 (USD Billion)
      105. | | 7.27.2 BY APPLICATION, 2025-2035 (USD Billion)
      106. | | 7.27.3 BY TYPE, 2025-2035 (USD Billion)
      107. | 7.28 GCC Countries MARKET SIZE ESTIMATES; FORECAST
      108. | | 7.28.1 BY PLATFORM, 2025-2035 (USD Billion)
      109. | | 7.28.2 BY APPLICATION, 2025-2035 (USD Billion)
      110. | | 7.28.3 BY TYPE, 2025-2035 (USD Billion)
      111. | 7.29 South Africa MARKET SIZE ESTIMATES; FORECAST
      112. | | 7.29.1 BY PLATFORM, 2025-2035 (USD Billion)
      113. | | 7.29.2 BY APPLICATION, 2025-2035 (USD Billion)
      114. | | 7.29.3 BY TYPE, 2025-2035 (USD Billion)
      115. | 7.30 Rest of MEA MARKET SIZE ESTIMATES; FORECAST
      116. | | 7.30.1 BY PLATFORM, 2025-2035 (USD Billion)
      117. | | 7.30.2 BY APPLICATION, 2025-2035 (USD Billion)
      118. | | 7.30.3 BY TYPE, 2025-2035 (USD Billion)
      119. | 7.31 PRODUCT LAUNCH/PRODUCT DEVELOPMENT/APPROVAL
      120. | | 7.31.1
      121. | 7.32 ACQUISITION/PARTNERSHIP
      122. | | 7.32.1

    Software Defined Radio Market Segmentation

    Market Segmentation Overview

    • Detailed segmentation data will be available in the full report
    • Comprehensive analysis by multiple parameters
    • Regional and country-level breakdowns
    • Market size forecasts by segment
    Infographic

    Free Sample Request

    Kindly complete the form below to receive a free sample of this Report

    Get Free Sample

    Customer Strories

    “I am very pleased with how market segments have been defined in a relevant way for my purposes (such as "Portable Freezers & refrigerators" and "last-mile"). In general the report is well structured. Thanks very much for your efforts.”

    Victoria Milne

    Founder
    Case Study
    Chemicals and Materials

    Compare Licence

    ×
    Features License Type
    Single User Multiuser License Enterprise User
    Price $4,950 $5,950 $7,250
    Maximum User Access Limit 1 User Upto 10 Users Unrestricted Access Throughout the Organization
    Free Customization
    Direct Access to Analyst
    Deliverable Format
    Platform Access
    Discount on Next Purchase 10% 15% 15%
    Printable Versions