Table of Contents
1 Executive Summary
2 Market Introduction
2.1 Market Definition
2.2 Scope of the Study
2.3 Market Structure
3 Research Methodology
3.1 Primary Research
3.2 Secondary Research
3.3 Market size Estimation
3.4 Forecast Model
3.5 List of Assumptions
3.6 Limitations of the study
4 Market Insights
5 Market Dynamics
5.1 Introduction
5.2 Market Drivers
5.3 Market Restraints
5.4 Market Opportunities
5.5 Porterβs Five Forces Analysis
5.5.1 Threat of New Entrants
5.5.2 Bargaining Power of Buyers
5.5.3 Bargaining Power of Suppliers
5.5.4 Threat of Substitutes
5.5.5 Intensity of Rivalry
5.6 Value Chain/Supply Chain Analysis
6 Global Sodium Sulfur Battery Market, By Power Rating
6.1 Introduction
6.2 Up to 10 MW
6.2.1 Market Estimates & Forecast, 2020-2027
6.2.2 Market Estimates & Forecast, By Region, 2020-2027
6.3 11 MW-25 MW
6.3.1 Market Estimates & Forecast, 2020-2027
6.3.2 Market Estimates & Forecast, By Region, 2020-2027
6.4 26 MW-50 MW
6.4.1 Market Estimates & Forecast, 2020-2027
6.4.2 Market Estimates & Forecast, By Region, 2020-2027
6.5 Above 50 MW
6.5.1 Market Estimates & Forecast, 2020-2027
6.5.2 Market Estimates & Forecast, By Region, 2020-2027
7 Global Sodium Sulfur Battery Market, By Application
7.1 Introduction
7.2 Grid and Standalone Systems
7.2.1 Market Estimates & Forecast, 2020-2027
7.2.2 Market Estimates & Forecast, By Region, 2020-2027
7.3 Space
7.3.1 Market Estimates & Forecast, 2020-2027
7.3.2 Market Estimates & Forecast, By Region, 2020-2027
7.4 Transport and Heavy Machinery
7.4.1 Market Estimates & Forecast, 2020-2027
7.4.2 Market Estimates & Forecast, By Region, 2020-2027
8 Global Sodium Sulfur Battery Market, By Region
8.1 Introduction
8.2 North America
8.2.1 Market Estimates & Forecast, By Power Rating, 2020-2027
8.2.2 Market Estimates & Forecast, By Application, 2020-2027
8.2.3 Market Estimates & Forecast, By Country, 2020-2027
8.2.4 US
8.2.4.1 Market Estimates & Forecast, By Power Rating, 2020-2027
8.2.4.2 Market Estimates & Forecast, By Application, 2020-2027
8.2.5 Canada
8.2.5.1 Market Estimates & Forecast, By Power Rating, 2020-2027
8.2.5.2 Market Estimates & Forecast, By Application, 2020-2027
8.2.6 Mexico
8.2.6.1 Market Estimates & Forecast, By Power Rating, 2020-2027
8.2.6.2 Market Estimates & Forecast, By Application, 2020-2027
8.3 Europe
8.3.1 Market Estimates & Forecast, By Power Rating, 2020-2027
8.3.2 Market Estimates & Forecast, By Application, 2020-2027
8.3.3 Market Estimates & Forecast, By Country, 2020-2027
8.3.4 Germany
8.3.4.1 Market Estimates & Forecast, By Power Rating, 2020-2027
8.3.4.2 Market Estimates & Forecast, By Application, 2020-2027
8.3.5 UK
8.3.5.1 Market Estimates & Forecast, By Power Rating, 2020-2027
8.3.5.2 Market Estimates & Forecast, By Application, 2020-2027
8.3.6 France
8.3.6.1 Market Estimates & Forecast, By Power Rating, 2020-2027
8.3.6.2 Market Estimates & Forecast, By Application, 2020-2027
8.3.7 Italy
8.3.7.1 Market Estimates & Forecast, By Power Rating, 2020-2027
8.3.7.2 Market Estimates & Forecast, By Application, 2020-2027
8.3.8 Rest of Europe
8.3.8.1 Market Estimates & Forecast, By Power Rating, 2020-2027
8.3.8.2 Market Estimates & Forecast, By Application, 2020-2027
8.4 Asia-Pacific
8.4.1 Market Estimates & Forecast, By Power Rating, 2020-2027
8.4.2 Market Estimates & Forecast, By Application, 2020-2027
8.4.3 Market Estimates & Forecast, By Country, 2020-2027
8.4.4 China
8.4.4.1 Market Estimates & Forecast, By Power Rating, 2020-2027
8.4.4.2 Market Estimates & Forecast, By Application, 2020-2027
8.4.5 Japan
8.4.5.1 Market Estimates & Forecast, By Power Rating, 2020-2027
8.4.5.2 Market Estimates & Forecast, By Application, 2020-2027
8.4.6 India
8.4.6.1 Market Estimates & Forecast, By Power Rating, 2020-2027
8.4.6.2 Market Estimates & Forecast, By Application, 2020-2027
8.4.7 Australia
8.4.7.1 Market Estimates & Forecast, By Power Rating, 2020-2027
8.4.7.2 Market Estimates & Forecast, By Application, 2020-2027
8.4.8 South Korea
8.4.8.1 Market Estimates & Forecast, By Power Rating, 2020-2027
8.4.8.2 Market Estimates & Forecast, By Application, 2020-2027
8.4.8.3 Market Estimates & Forecast, By Application, 2020-2027
8.4.9 Rest of Asia-Pacific
8.4.9.1 Market Estimates & Forecast, By Power Rating, 2020-2027
8.4.9.2 Market Estimates & Forecast, By Application, 2020-2027
8.5 Middle East & Africa
8.5.1 Market Estimates & Forecast, By Power Rating, 2020-2027
8.5.2 Market Estimates & Forecast, By Application, 2020-2027
8.5.3 Market Estimates & Forecast, By Country, 2020-2027
8.5.4 Iran
8.5.4.1 Market Estimates & Forecast, By Power Rating, 2020-2027
8.5.4.2 Market Estimates & Forecast, By Application, 2020-2027
8.5.5 Saudi Arabia
8.5.5.1 Market Estimates & Forecast, By Power Rating, 2020-2027
8.5.5.2 Market Estimates & Forecast, By Application, 2020-2027
8.5.6 Egypt
8.5.6.1 Market Estimates & Forecast, By Power Rating, 2020-2027
8.5.6.2 Market Estimates & Forecast, By Application, 2020-2027
8.5.7 Iraq
8.5.7.1 Market Estimates & Forecast, By Power Rating, 2020-2027
8.5.7.2 Market Estimates & Forecast, By Application, 2020-2027
8.5.8 UAE
8.5.8.1 Market Estimates & Forecast, By Power Rating, 2020-2027
8.5.8.2 Market Estimates & Forecast, By Application, 2020-2027
8.5.9 South Africa
8.5.9.1 Market Estimates & Forecast, By Power Rating, 2020-2027
8.5.9.2 Market Estimates & Forecast, By Application, 2020-2027
8.5.10 Rest of the Middle East & Africa
8.5.10.1 Market Estimates & Forecast, By Power Rating, 2020-2027
8.5.10.2 Market Estimates & Forecast, By Application, 2020-2027
8.6 South America
8.6.1 Market Estimates & Forecast, By Power Rating, 2020-2027
8.6.2 Market Estimates & Forecast, By Application, 2020-2027
8.6.3 Market Estimates & Forecast, By Country, 2020-2027
8.6.4 Brazil
8.6.4.1 Market Estimates & Forecast, By Power Rating, 2020-2027
8.6.4.2 Market Estimates & Forecast, By Application, 2020-2027
8.6.5 Argentina
8.6.5.1 Market Estimates & Forecast, By Power Rating, 2020-2027
8.6.5.2 Market Estimates & Forecast, By Application, 2020-2027
8.6.6 Chile
8.6.6.1 Market Estimates & Forecast, By Power Rating, 2020-2027
8.6.6.2 Market Estimates & Forecast, By Application, 2020-2027
8.6.7 Colombia
8.6.7.1 Market Estimates & Forecast, By Power Rating, 2020-2027
8.6.7.2 Market Estimates & Forecast, By Application, 2020-2027
8.6.8 Venezuela
8.6.8.1 Market Estimates & Forecast, By Power Rating, 2020-2027
8.6.8.2 Market Estimates & Forecast, By Application, 2020-2027
8.6.9 Rest of South America
8.6.9.1 Market Estimates & Forecast, By Power Rating, 2020-2027
8.6.9.2 Market Estimates & Forecast, By Application, 2020-2027
9 Competitive Landscape
9.1 Competitive Scenario
9.2 Competitive Benchmarking of the Global Sodium Sulfur Battery Market
9.3 Major Growth Strategy in the Global Sodium Sulfur Battery Market
9.4 Market Share Analysis: Global Sodium Sulfur Battery Market
9.5 KEMET Electronics Corporation: The Leading Player in terms of Number of Developments in Global Sodium Sulfur Battery Market
9.6 New Power Rating Development in Sodium Sulfur Battery Market
9.7 Mergers & Acquisitions in Sodium Sulfur Battery Market
9.8 Contracts & Agreements in Sodium Sulfur Battery Market
9.9 Expansions & Investments in Sodium Sulfur Battery Market
10 Company Profile
10.1 NGK Insulators Ltd.
10.1.1 Company Overview
10.1.2 Power Rating/Services Offering
10.1.3 Financial Overview
10.1.4 Key Developments
10.1.5 Strategy
10.1.6 SWOT Analysis
10.2 KEMET Electronics Corporation
10.2.1 Company Overview
10.2.2 Power Rating /Services Offering
10.2.3 Financial Overview
10.2.4 Key Developments
10.2.5 Strategy
10.2.6 SWOT Analysis
10.3 GE Energy Storage
10.3.1 Company Overview
10.3.2 Power Rating /Services Offering
10.3.3 Financial Overview
10.3.4 Key Developments
10.3.5 Strategy
10.3.6 SWOT Analysis
10.4 Eagle Picher Technologies LLC
10.4.1 Company Overview
10.4.2 Power Rating /Services Offering
10.4.3 Financial Overview
10.4.4 Key Developments
10.4.5 Strategy
10.4.6 SWOT Analysis
10.5 Ceramatec Inc.
10.5.1 Company Overview
10.5.2 Power Rating /Services Offering
10.5.3 Financial Overview
10.5.4 Key Developments
10.5.5 Strategy
10.5.6 SWOT Analysis
10.6 Sieyuan Electric Co., Ltd.
10.6.1 Company Overview
10.6.2 Power Rating /Services Offering
10.6.3 Financial Overview
10.6.4 Key Developments
10.6.5 Strategy
10.6.6 SWOT Analysis
10.7 FIAMM Group
10.7.1 Company Overview
10.7.2 Power Rating /Services Offering
10.7.3 Financial Overview
10.7.4 Key Developments
10.7.5 Strategy
10.7.6 SWOT Analysis
10.8 POSCO
10.8.1 Company Overview
10.8.2 Power Rating /Services Offering
10.8.3 Financial Overview
10.8.4 Key Developments
10.8.5 Strategy
10.8.6 SWOT Analysis
List of Tables
Table 1 Global Sodium Sulfur Battery Market, By Region, 2020-2027 (USD Million)
Table 2 North America Sodium Sulfur Battery Market, By Country, 2020-2027 (USD Million)
Table 3 Europe Sodium Sulfur Battery Market, By Country, 2020-2027 (USD Million)
Table 4 Asia-Pacific Sodium Sulfur Battery Market, By Country, 2020-2027 (USD Million)
Table 5 Middle East & Africa Sodium Sulfur Battery Market, By Country, 2020-2027 (USD Million)
Table 6 South America Sodium Sulfur Battery Market, By Country, 2020-2027 (USD Million)
Table 7 Global Sodium Sulfur Battery Market, By Power Rating, 2020-2027 (USD Million)
Table 8 North America Sodium Sulfur Battery Market, By Power Rating, 2020-2027 (USD Million)
Table 9 Europe Sodium Sulfur Battery Market, By Power Rating, 2020-2027 (USD Million)
Table 10 Asia-Pacific Sodium Sulfur Battery Market, By Power Rating, 2020-2027 (USD Million)
Table 11 Middle East & Africa Sodium Sulfur Battery Market, By Power Rating, 2020-2027 (USD Million)
Table 12 South America Sodium Sulfur Battery Market, By Power Rating, 2020-2027 (USD Million)
Table 13 Global Sodium Sulfur Battery Market, By Application, 2020-2027 (USD Million)
Table 14 North America Sodium Sulfur Battery Market, By Application, 2020-2027 (USD Million)
Table 15 Europe Sodium Sulfur Battery Market, By Application, 2020-2027 (USD Million)
Table 16 Asia-Pacific Sodium Sulfur Battery Market, By Application, 2020-2027 (USD Million)
Table 17 Middle East & Africa Sodium Sulfur Battery Market, By Application, 2020-2027 (USD Million)
Table 18 South America Sodium Sulfur Battery Market, By Application, 2020-2027 (USD Million)
Table 19 Global Sodium Sulfur Battery Market: By Region, 2020-2027 (USD Million)
Table 20 North America Sodium Sulfur Battery Market, By Country, 2020-2027 (USD Million)
Table 21 North America Sodium Sulfur Battery Market, By Power Rating, 2020-2027 (USD Million)
Table 22 North America Sodium Sulfur Battery Market, By Application, 2020-2027 (USD Million)
Table 23 US Sodium Sulfur Battery Market, By Power Rating, 2020-2027 (USD Million)
Table 24 US Sodium Sulfur Battery Market, By Application, 2020-2027 (USD Million)
Table 25 Canada Sodium Sulfur Battery Market, By Power Rating, 2020-2027 (USD Million)
Table 26 Canada Sodium Sulfur Battery Market, By Application, 2020-2027 (USD Million)
Table 27 Mexico Sodium Sulfur Battery Market, By Power Rating, 2020-2027 (USD Million)
Table 28 Mexico Sodium Sulfur Battery Market, By Application, 2020-2027 (USD Million)
Table 29 Europe Sodium Sulfur Battery Market, By Country, 2020-2027 (USD Million)
Table 30 Europe Sodium Sulfur Battery Market, By Power Rating, 2020-2027 (USD Million)
Table 31 Europe Sodium Sulfur Battery Market, By Application, 2020-2027 (USD Million)
Table 32 Germany Sodium Sulfur Battery Market, By Power Rating, 2020-2027 (USD Million)
Table 33 Germany Sodium Sulfur Battery Market, By Application, 2020-2027 (USD Million)
Table 34 UK Sodium Sulfur Battery Market, By Power Rating, 2020-2027 (USD Million)
Table 35 UK Sodium Sulfur Battery Market, By Application, 2020-2027 (USD Million)
Table 36 France Sodium Sulfur Battery Market, By Power Rating, 2020-2027 (USD Million)
Table 37 France Sodium Sulfur Battery Market, By Application, 2020-2027 (USD Million)
Table 38 Italy Sodium Sulfur Battery Market, By Power Rating, 2020-2027 (USD Million)
Table 39 Italy Sodium Sulfur Battery Market, By Application, 2020-2027 (USD Million)
Table 40 Rest of Europe Sodium Sulfur Battery Market, By Power Rating, 2020-2027 (USD Million)
Table 41 Rest of Europe Sodium Sulfur Battery Market, By Application, 2020-2027 (USD Million)
Table 42 Asia-Pacific Sodium Sulfur Battery Market, By Country, 2020-2027 (USD Million)
Table 43 Asia-Pacific Sodium Sulfur Battery Market, By Power Rating, 2020-2027 (USD Million)
Table 44 Asia-Pacific Sodium Sulfur Battery Market, By Application, 2020-2027 (USD Million)
Table 45 China Sodium Sulfur Battery Market, By Power Rating, 2020-2027 (USD Million)
Table 46 China Sodium Sulfur Battery Market, By Application, 2020-2027 (USD Million)
Table 47 Japan Sodium Sulfur Battery Market, By Power Rating, 2020-2027 (USD Million)
Table 48 Japan Sodium Sulfur Battery Market, By Application, 2020-2027 (USD Million)
Table 49 India Sodium Sulfur Battery Market, By Power Rating, 2020-2027 (USD Million)
Table 50 India Sodium Sulfur Battery Market, By Application, 2020-2027 (USD Million)
Table 51 Australia Sodium Sulfur Battery Market, By Power Rating, 2020-2027 (USD Million)
Table 52 Australia Sodium Sulfur Battery Market, By Application, 2020-2027 (USD Million)
Table 53 Rest of Asia-Pacific Sodium Sulfur Battery Market, By Power Rating, 2020-2027 (USD Million)
Table 54 Rest of Asia-Pacific Sodium Sulfur Battery Market, By Application, 2020-2027 (USD Million)
Table 55 Middle East & Africa Sodium Sulfur Battery Market, By Country, 2020-2027 (USD Million)
Table 56 Middle East & Africa Sodium Sulfur Battery Market, By Power Rating, 2020-2027 (USD Million)
Table 57 Middle East & Africa Sodium Sulfur Battery Market, By Application, 2020-2027 (USD Million)
Table 58 Saudi Arabia Sodium Sulfur Battery Market, By Power Rating, 2020-2027 (USD Million)
Table 59 Saudi Arabia Sodium Sulfur Battery Market, By Application, 2020-2027 (USD Million)
Table 60 UAE Sodium Sulfur Battery Market, By Power Rating, 2020-2027 (USD Million)
Table 61 UAE Sodium Sulfur Battery Market, By Application, 2020-2027 (USD Million)
Table 62 South Africa Sodium Sulfur Battery Market, By Power Rating, 2020-2027 (USD Million)
Table 63 South Africa Sodium Sulfur Battery Market, By Application, 2020-2027 (USD Million)
Table 64 Iran Sodium Sulfur Battery Market, By Power Rating, 2020-2027 (USD Million)
Table 65 Iran Sodium Sulfur Battery Market, By Application, 2020-2027 (USD Million)
Table 66 Egypt Sodium Sulfur Battery Market, By Power Rating, 2020-2027 (USD Million)
Table 67 Egypt Sodium Sulfur Battery Market, By Application, 2020-2027 (USD Million)
Table 68 Iraq Sodium Sulfur Battery Market, By Power Rating, 2020-2027 (USD Million)
Table 69 Iraq Sodium Sulfur Battery Market, By Application, 2020-2027 (USD Million)
Table 70 Rest of the Middle East & Africa Sodium Sulfur Battery Market, By Power Rating, 2020-2027 (USD Million)
Table 71 Rest of the Middle East & Africa Sodium Sulfur Battery Market, By Application, 2020-2027 (USD Million)
Table 72 South America Sodium Sulfur Battery Market, By Country, 2020-2027 (USD Million)
Table 73 South America Sodium Sulfur Battery Market, By Power Rating, 2020-2027 (USD Million)
Table 74 South America Sodium Sulfur Battery Market, By Application, 2020-2027 (USD Million)
Table 75 Brazil Sodium Sulfur Battery Market, By Power Rating, 2020-2027 (USD Million)
Table 76 Brazil Sodium Sulfur Battery Market, By Application, 2020-2027 (USD Million)
Table 77 Argentina Sodium Sulfur Battery Market, By Power Rating, 2020-2027 (USD Million)
Table 78 Argentina Sodium Sulfur Battery Market, By Application, 2020-2027 (USD Million)
Table 79 Chile Sodium Sulfur Battery Market, By Power Rating, 2020-2027 (USD Million)
Table 80 Chile Sodium Sulfur Battery Market, By Application, 2020-2027 (USD Million)
Table 81 Colombia Sodium Sulfur Battery Market, By Power Rating, 2020-2027 (USD Million)
Table 82 Colombia Sodium Sulfur Battery Market, By Application, 2020-2027 (USD Million)
Table 83 Venezuela Sodium Sulfur Battery Market, By Power Rating, 2020-2027 (USD Million)
Table 84 Venezuela Sodium Sulfur Battery Market, By Application, 2020-2027 (USD Million)
Table 85 Rest of South America Sodium Sulfur Battery Market, By Power Rating, 2020-2027 (USD Million)
Table 86 Rest of South America Sodium Sulfur Battery Market, By Application, 2020-2027 (USD Million)
List of Figures
FIGURE 1 RESEARCH PROCESS OF MRFR
FIGURE 2 TOP DOWN & BOTTOM UP APPROACH
FIGURE 3 MARKET DYNAMICS
FIGURE 4 IMPACT ANALYSIS: MARKET DRIVERS
FIGURE 5 IMPACT ANALYSIS: MARKET RESTRAINTS
FIGURE 6 PORTERβS FIVE FORCES ANALYSIS
FIGURE 7 VALUE CHAIN ANALYSIS
FIGURE 8 GLOBAL SODIUM SULFUR BATTERY MARKET SHARE, BY POWER RATING, 2020 (%)
FIGURE 9 GLOBAL SODIUM SULFUR BATTERY MARKET, BY POWER RATING, 2020-2027 (USD Million)
FIGURE 10 GLOBAL SODIUM SULFUR BATTERY MARKET SHARE, BY APPLICATION, 2020 (%)
FIGURE 11 GLOBAL SODIUM SULFUR BATTERY MARKET, BY APPLICATION, 2020-2027 (USD Million)
FIGURE 12 GLOBAL SODIUM SULFUR BATTERY MARKET SHARE (%), BY REGION, 2020
FIGURE 13 GLOBAL SODIUM SULFUR BATTERY MARKET, BY REGION, 2020-2027 (USD Million)
FIGURE 14 NORTH AMERICA SODIUM SULFUR BATTERY MARKET SHARE (%), BY COUNTRY, 2020
FIGURE 15 NORTH AMERICA SODIUM SULFUR BATTERY MARKET, BY COUNTRY, 2020-2027 (USD Million)
FIGURE 16 EUROPE SODIUM SULFUR BATTERY MARKET SHARE (%), BY COUNTRY, 2020
FIGURE 17 EUROPE SODIUM SULFUR BATTERY MARKET, BY COUNTRY, 2020-2027 (USD Million)
FIGURE 18 ASIA PACIFIC SODIUM SULFUR BATTERY MARKET SHARE (%), BY COUNTRY, 2020
FIGURE 19 ASIA PACIFIC SODIUM SULFUR BATTERY MARKET, BY COUNTRY, 2020-2027 (USD Million)
FIGURE 20 MIDDLE EAST & AFRICA SODIUM SULFUR BATTERY MARKET SHARE (%), BY COUNTRY, 2020
FIGURE 21 MIDDLE EAST & AFRICA SODIUM SULFUR BATTERY MARKET, BY COUNTRY, 2020-2027 (USD Million)
FIGURE 22 SOUTH AMERICA SODIUM SULFUR BATTERY MARKET SHARE (%), BY COUNTRY, 2020
FIGURE 23 SOUTH AMERICA SODIUM SULFUR BATTERY MARKET, BY COUNTRY, 2020-2027 (USD Million)
$632 Million
15.50%
Asia-Pacific
2022-2027
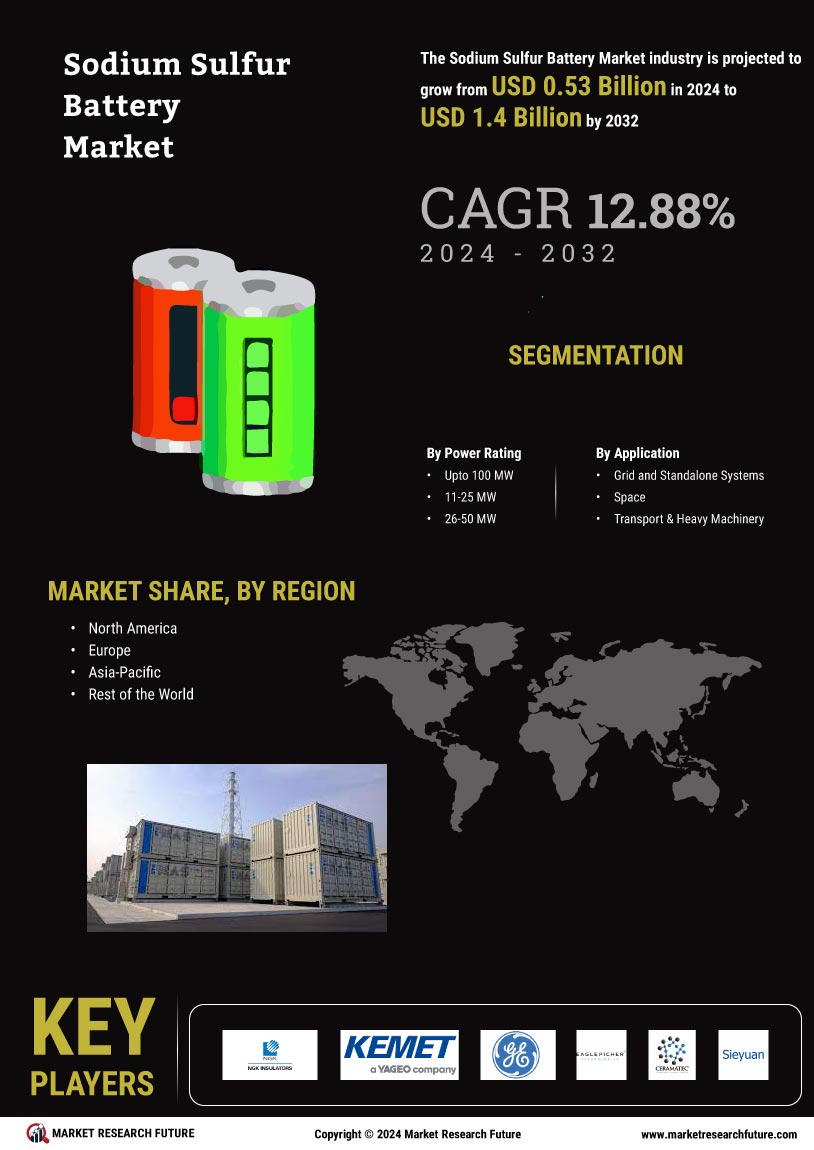
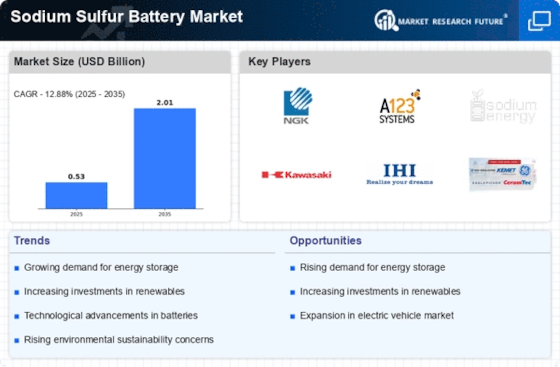
The Sodium Sulfur Battery Market Size and Sodium Sulfur Battery Market Share are expected to grow at 15.50 % CAGR during the Sodium Sulfur Battery Market Analysis period with a Significant Value and Sodium Sulfur Battery Market Growth. A molten-salt battery comprised of liquid sodium and sulfur is known as a sodium-sulfur battery. This battery has a high energy density, good charge or discharge efficiency, and a long life cycle. This type of battery is made up of low-cost materials. This battery is part of a sodium-sulfur battery system, which is an energy storage device based on electrochemical charge/discharge interactions between a positive electrode made of molten sulfur and a negative electrode made of molten sodium (Na). The most important components of a sodium-sulfur battery system are the basic cell, which is made up of electrodes, modules, battery systems, which are made up of huge assemblies of modules and a control system, and power conversion systems (PCS). Peak shaving, time-shifting, and stabilization of wind farms and solar power plants are some of the most common uses for this sort of battery. Because of the different applications where these batteries are utilized and have been a vital component of the whole power generation and distribution system, the global sodium-sulfur battery market is likely to develop at a moderate rate during the forecast period. Wind power stabilization and energy time-shift, solar power stabilization and energy time-shift, frequency control and energy time-shift, renewable power supply system off-grid, and high-efficiency diesel generator operation are only a few of these application areas.
The COVD-19 outbreak has had an impact on the industry's supply chain, but it has also boosted demand for Sodium Sulfur Battery Market testing in the healthcare industry. COVID-19's epidemic had a tremendous impact on trade and business. Manufacturers are rethinking their product offerings and manufacturing new items to recover from the current predicament. The duration of the pandemic's propagation is still a significant issue when assessing the pandemic's overall impact. However, the global Sodium Sulfur Battery Market Share is expected to plateau after 2021. The Sodium Sulfur Battery Market Size is one of the fastest-growing industries. However, the global Sodium Sulfur Battery Market Growth is expected to level out after 2021. During the Sodium Sulfur Battery Market Analysis, the outbreak had no impact on the global market.
Some of the primary drivers driving the sodium-sulfur battery market are increased renewable energy investment, cost reductions due to technological breakthroughs, and increased deployment. Electric utilities are attempting to connect households that are not properly connected to the national grid with isolated grids that are standalone and involved in small-scale power generation of 10 kW to 10 MW and are typically deployed in rural areas, to provide reliable and quick power supply to these households. As the government attempts to enhance the electrification rates in Southeast Asian countries, such forms of power generation and distribution are becoming increasingly popular. Furthermore, the electricity produced is primarily derived from renewable energy sources such as wind, solar, and hydropower, among others. The energy storage device is a critical component of any isolated grid. As a result, battery storage has become a popular alternative among utilities in the energy storage system. The sodium-sulfur battery industry is anticipated to be driven by all of these factors.
However, the market's growth is being stifled by a high risk of exposure and high implementation costs. The market is further constrained by a lack of awareness among customers. Automation of inspection and testing processes, industrialization in developing economies, and the supply of tailored solutions that are affected by the risk of exposure are all potential market prospects. The lifespan and operational efficiency of sodium-sulfur batteries can be extended by adding electrodes. Nonetheless, when these batteries come into touch with moisture or air, they become flammable and dangerous.
Due to the growing trend of combining renewables and energy storage systems, the Sodium Sulfur Battery Market is predicted to increase significantly during the forecast period. Market development opportunities abound as a result of research and innovation efforts. For example, R&D experts are presently working on the most prominent issue, the efficiency of metal sulfides electrodeposition in the operation of NAS batteries. They have developed a solution in the form of a Mo5N6 electrocatalyst for efficient Na2S electrodeposition in NAS batteries at room temperature. The Sodium Sulfur Battery Market category is predicted to increase at the fastest rate during the projection period as a result of these advances.
The Sodium Sulfur Battery Market is further bifurcated into various segments depending on various factors to help the market grow as per the predicted CAGR growth by the end of the Sodium Sulfur Battery Market Forecast period in 2027. The market has been segmented based on the following:
Based on the power rating, the market has been segmented as follows:
Based on the application, the market has been segmented as follows:
Based on the region, the market has been segmented as follows:
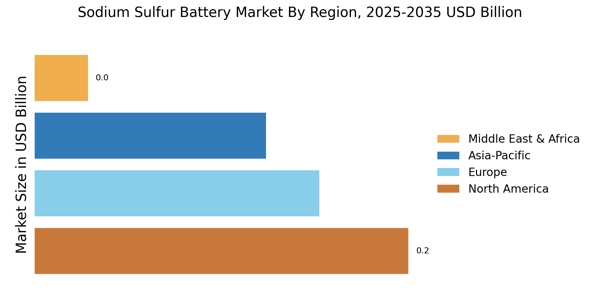
The highly developed battery manufacturing market in the Asia Pacific area is well-known. The increased deployment of battery energy storage systems, either in connection with renewable power projects (such wind, solar, etc.) or as standalone energy storage projects, is driven by the shifting momentum towards renewable energy generation sources and government backing. Countries like China, India, and Japan have seen the biggest increase in renewable plus energy storage projects. China added more than double the amount of energy storage capacity in 2020 compared to the previous year. By the end of the forecast period, China wants to install approximately 30 GW of energy storage devices. As a result, various initiatives are in the works around the country to achieve the aim. The government's activities in the realm of energy storage are projected to boost the NAS battery industry in India, as well. The stationary storage market in India is expanding at a rapid pace. Approximately 25GWh of batteries will be installed in front-of-the-meter and behind-the-meter applications. The front-of-the-meter energy storage market is still in its early stages, with roughly 28MW/20MWh in 2021, although behind-the-meter applications are likely to have a significant share in the future, with around 30GWh by 2037. Shortly, such improvements are projected to give a boost to the regional market for NAS batteries.
Because of the different applications where these batteries are utilized and have been a vital component of the whole power generation and distribution system, the global sodium-sulfur battery market is likely to develop at a moderate rate during the forecast period. Wind power stabilization and energy time-shift, solar power stabilization and energy time-shift, frequency control and energy time-shift, renewable power supply system off-grid, and high-efficiency diesel generator operation are only a few of these application areas. The global market for sodium-sulfur batteries is highly consolidated. The major Sodium Sulfur Battery Market Key Players are as follows:
The existing and developing market trends and dynamics in the worldwide sodium-sulfur batteries market are thoroughly examined in this study. Market estimations for the key market segments are used to conduct in-depth analysis. Following key product positioning and monitoring the main competitors within the market framework allows for a thorough market study. A detailed study of all regions is presented, revealing the current potential in these areas. Key market players are profiled and their tactics are thoroughly examined, allowing for a better understanding of the market's competitive landscape.
Report Attribute/Metric | Details |
---|---|
Market Size | 2030: Significant Value |
CAGR | 15.50 % CAGR(2022-2030) |
Base Year | 2021 |
Forecast Period | 2022-2030 |
Historical Data | 2019 & 2020 |
Forecast Units | Value (USD Million) |
Report Coverage | Revenue Forecast, Competitive Landscape, Growth Factors, and Trends |
Segments Covered | Power Rating and Application |
Geographies Covered | North America, Europe, Asia-Pacific, and Rest of the World (RoW) |
Key Vendors | NGK Insulators Ltd., KEMET Electronics Corporation, GE Energy Storage, Eagle Picher Technologies LLC, Ceramatec Inc., Sieyuan Electric Co., Ltd., FIAMM Group, and POSCO, among others. |
Key Market Opportunities | New product launches and R&D Amongst major key Players |
Key Market Drivers |
|
Frequently Asked Questions (FAQ) :
Ceramatec Inc., Eagle Picher Technologies LLC, Sieyuan Electric Co., Ltd., and FIAMM Group are motivating the market in the impending period.
The APAC region is promoting the development of the market extensively in the coming period.
A 15.50 % CAGR is predicted to be seen in the market during the forecast period.
The rise in rural electrification projects is estimated to power the market in the upcoming period.
Lack of proper safety protocols to handle sodium sulfur is expected to restrict eh market in the upcoming period.