Smart Sensors Market Segmentation
Smart Sensors Market By Application (USD Billion, 2025-2035)
- Industrial Automation
- Healthcare
- Automotive
- Smart Homes
- Environmental Monitoring
Smart Sensors Market By End Use (USD Billion, 2025-2035)
- Manufacturing
- Consumer Electronics
- Transportation
- Healthcare Facilities
- Smart Sensors Market
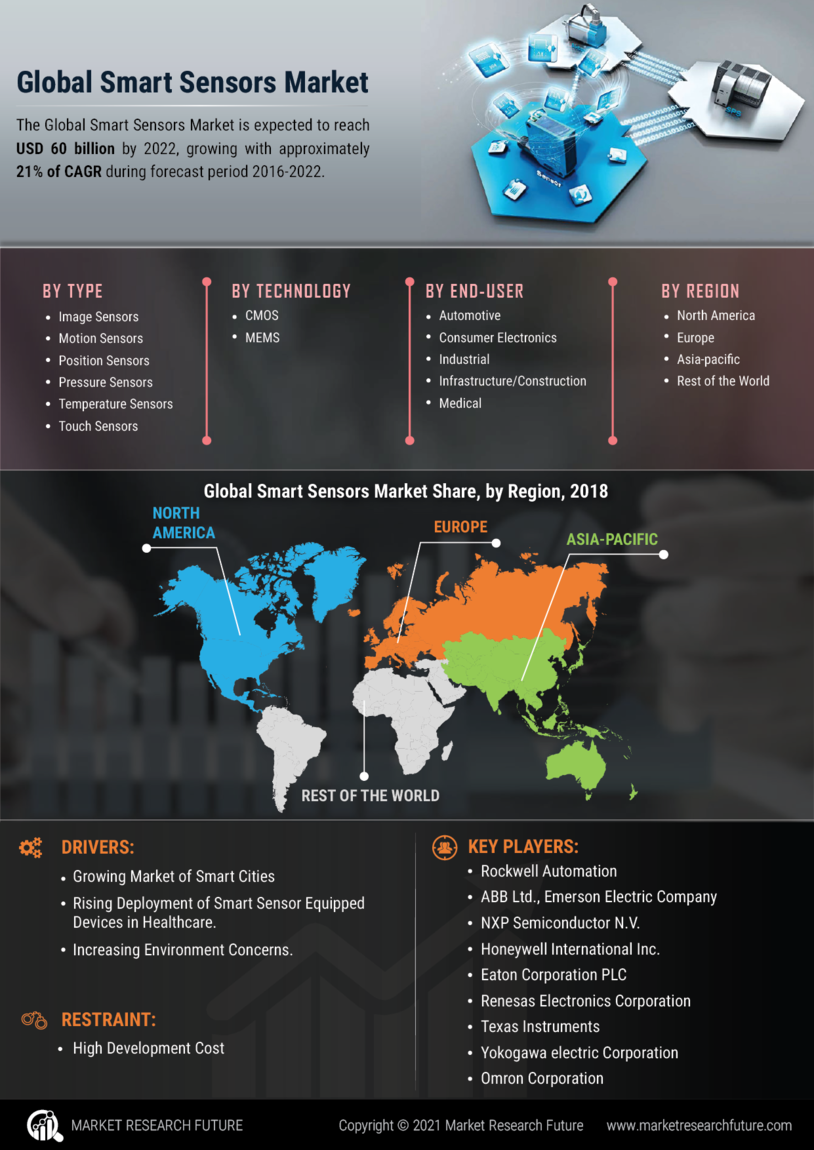
Smart Sensors Market By Technology (USD Billion, 2025-2035)
- MEMS
- Optical
- Ultrasonic
- Magnetic
- Chemical
Smart Sensors Market By Sensor Type (USD Billion, 2025-2035)
- Temperature Sensor
- Pressure Sensor
- Proximity Sensor
- Light Sensor
- Motion Sensor
Smart Sensors Market By Connectivity (USD Billion, 2025-2035)
- Wired
- Wireless
- Bluetooth
- Zigbee
- LoRaWAN