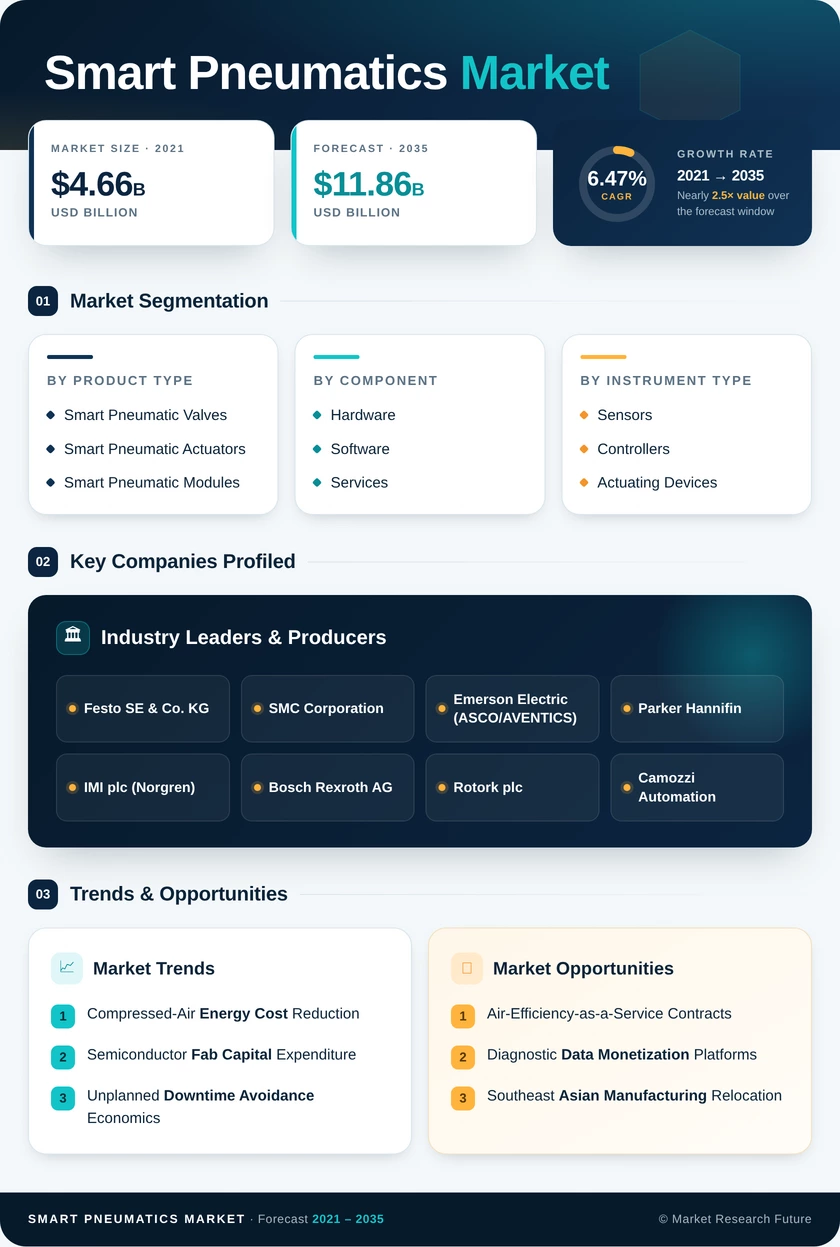
Smart Pneumatics Market (2026 – 2035)

ID: MRFR/SEM/6120-HCR 100 Pages Nirmit Biswas Last Updated: September 15, 2026
Smart Pneumatics Market Size, Share and Research Report By Product Type (Smart Pneumatic Valves, Smart Pneumatic Actuators, Smart Pneumatic Modules), By Component (Hardware, Software, Services), By Instrument Type (Sensors, Controllers, Actuating Devices), By End-User Industry (Automotive, Oil & Gas, Food & Beverage, Semiconductor & Electronics), By Communication Protocol (EtherNet/IP, PROFINET, IO-Link), By Distribution Channel (Direct Sales, Distributors, Online Channels) And By Region (North America, Europe, Asia-Pacific, And Rest Of The World) – Industry Forecast Till 2035
Smart Pneumatics Market
Market Size
Forecast Period2026-2035
CAGR (2026-2035)6.47%
2025 Market SizeUSD 6.29 Billion
2035 Market SizeUSD 11.86 Billion
Key Players
Festo SE & Co. KG
SMC Corporation
Emerson Electric
Parker Hannifin
IMI plc
Bosch Rexroth AG
Opportunities
  • Air-Efficiency-as-a-Service Contracts
  • Diagnostic Data Monetization Platforms
  • Southeast Asian Manufacturing Relocation
  1. 1 Market Summary | |
    1. 1.1 Study Assumptions & Market Definition | |
    2. 1.2 Scope of the Study | |
    3. 1.3 Research Methodology | |
  2. 2 Key Report Takeaways | |
    1. 2.1 By Product Type | |
    2. 2.2 By Component | |
    3. 2.3 By Instrument Type | |
    4. 2.4 By End-User Industry | |
    5. 2.5 By Communication Protocol | |
    6. 2.6 By Distribution Channel | |
    7. 2.7 By Region | |
  3. 3 Market Size and Forecast (2021–2035) | |
    1. 3.1 Historical Market Size (2021–2024) | |
    2. 3.2 Base Year Estimation (2025) | |
    3. 3.3 Forecast Market Size (2026–2035) | |
    4. 3.4 Year-over-Year Growth Analysis | |
  4. 4 Driver Impact Analysis | |
    1. 4.1 Compressed-Air Energy Cost Reduction | |
    2. 4.2 Semiconductor Fab Capital Expenditure | |
    3. 4.3 Unplanned Downtime Avoidance Economics | |
    4. 4.4 IO-Link and Industrial Ethernet Standardization | |
    5. 4.5 Oil and Gas Wellhead Safety Instrumentation | |
    6. 4.6 Corporate Decarbonization Reporting Mandates | |
    7. 4.7 Aging Installed Base Replacement Cycles | |
  5. 5 Restraints Impact Analysis | |
    1. 5.1 Electric Actuator Substitution | |
    2. 5.2 OT Cybersecurity Exposure | |
    3. 5.3 Brownfield Retrofit Complexity | |
    4. 5.4 Automation Skills Shortage | |
    5. 5.5 Capital Budget Compression in Mid-Market | |
  6. 6 Opportunities | |
    1. 6.1 Air-Efficiency-as-a-Service Contracts | |
    2. 6.2 Diagnostic Data Monetization Platforms | |
    3. 6.3 Southeast Asian Manufacturing Relocation | |
    4. 6.4 Hydrogen and Process Safety Applications | |
    5. 6.5 Modular Reconfigurable Production Cells | |
  7. 7 Regional Market Share and Country-Level Analysis | |
    1. 7.1 North America | | |
      1. 7.1.1 US | | |
      2. 7.1.2 Canada | | |
      3. 7.1.3 Mexico | |
    2. 7.2 Europe | | |
      1. 7.2.1 Germany | | |
      2. 7.2.2 UK | | |
      3. 7.2.3 France | | |
      4. 7.2.4 Italy | | |
      5. 7.2.5 Spain | | |
      6. 7.2.6 Nordic Countries | | |
      7. 7.2.7 Russia | | |
      8. 7.2.8 Rest of Europe | |
    3. 7.3 Asia-Pacific | | |
      1. 7.3.1 China | | |
      2. 7.3.2 India | | |
      3. 7.3.3 Japan | | |
      4. 7.3.4 South Korea | | |
      5. 7.3.5 ASEAN | | |
      6. 7.3.6 Rest of Asia-Pacific | |
    4. 7.4 South America | | |
      1. 7.4.1 Brazil | | |
      2. 7.4.2 Argentina | | |
      3. 7.4.3 Rest of South America | |
    5. 7.5 Middle East & Africa | | |
      1. 7.5.1 Saudi Arabia | | |
      2. 7.5.2 UAE | | |
      3. 7.5.3 South Africa | | |
      4. 7.5.4 Egypt | | |
      5. 7.5.5 Rest of MEA | |
  8. 8 Future Outlook (2026–2035) | |
    1. 8.1 Edge Analytics and Autonomous Maintenance | |
    2. 8.2 Service-Led Platform Economics | |
    3. 8.3 Energy Efficiency as Regulatory Obligation | |
    4. 8.4 Pneumatic-Electric Hybrid Architectures | |
  9. 9 Segmentation Analysis | |
    1. 9.1 By Product Type | | |
      1. 9.1.1 Smart Pneumatic Valves | | |
      2. 9.1.2 Smart Pneumatic Actuators | | |
      3. 9.1.3 Smart Pneumatic Modules | |
    2. 9.2 By Component | | |
      1. 9.2.1 Hardware | | |
      2. 9.2.2 Software | | |
      3. 9.2.3 Services | |
    3. 9.3 By Instrument Type | | |
      1. 9.3.1 Sensors | | |
      2. 9.3.2 Controllers | | |
      3. 9.3.3 Actuating Devices | |
    4. 9.4 By End-User Industry | | |
      1. 9.4.1 Automotive | | |
      2. 9.4.2 Oil & Gas | | |
      3. 9.4.3 Food & Beverage | | |
      4. 9.4.4 Semiconductor & Electronics | |
    5. 9.5 By Communication Protocol | | |
      1. 9.5.1 EtherNet/IP | | |
      2. 9.5.2 PROFINET | | |
      3. 9.5.3 IO-Link | |
    6. 9.6 By Distribution Channel | | |
      1. 9.6.1 Direct Sales | | |
      2. 9.6.2 Distributors | | |
      3. 9.6.3 Online Channels | |
  10. 10 Competitive Landscape | |
    1. 10.1 Market Concentration Analysis | |
    2. 10.2 Competitive Benchmarking Matrix | |
    3. 10.3 Company Profiles | |
  11. 11 Recent News & Developments | |
  12. 12 Report Scope and Methodology | |
  13. 13 Detailed Sources and Citations | |
  14. 14 Frequently Asked Questions | | LIST OF TABLES | |
  15. TABLE 1 Global Smart Pneumatics Market Size & Forecast, by Revenue (USD Billion), 2021–2035 | |
  16. TABLE 2 Global Smart Pneumatics Market – Year-over-Year Growth Analysis, 2021–2035 | |
  17. TABLE 3 Driver Impact Analysis Matrix, 2026–2035 | |
  18. TABLE 4 Restraint Impact Analysis Matrix, 2026–2035 | |
  19. TABLE 5 Global Smart Pneumatics Market Size, by Region, 2021–2035 (USD Billion) | |
  20. TABLE 6 North America Smart Pneumatics Market Size, by Country, 2021–2035 (USD Billion) | |
  21. TABLE 7 Europe Smart Pneumatics Market Size, by Country, 2021–2035 (USD Billion) | |
  22. TABLE 8 Asia-Pacific Smart Pneumatics Market Size, by Country, 2021–2035 (USD Billion) | |
  23. TABLE 9 South America Smart Pneumatics Market Size, by Country, 2021–2035 (USD Billion) | |
  24. TABLE 10 Middle East & Africa Smart Pneumatics Market Size, by Country, 2021–2035 (USD Billion) | |
  25. TABLE 11 Global Smart Pneumatics Market Size, by Product Type, 2021–2035 (USD Billion) | |
  26. TABLE 12 Global Smart Pneumatics Market Size, by Component, 2021–2035 (USD Billion) | |
  27. TABLE 13 Global Smart Pneumatics Market Size, by Instrument Type, 2021–2035 (USD Billion) | |
  28. TABLE 14 Global Smart Pneumatics Market Size, by End-User Industry, 2021–2035 (USD Billion) | |
  29. TABLE 15 Global Smart Pneumatics Market Size, by Communication Protocol, 2021–2035 (USD Billion) | |
  30. TABLE 16 Global Smart Pneumatics Market Size, by Distribution Channel, 2021–2035 (USD Billion) | |
  31. TABLE 17 Competitive Benchmarking Matrix – Global Smart Pneumatics Market, 2026 | |
  32. TABLE 18 Company Profiles – Key Players, Global Smart Pneumatics Market | |
  33. TABLE 19 Recent Developments & Strategic Announcements, 2023–2025 | |
  34. TABLE 20 Report Scope & Methodology Summary | |
  35. TABLE 21 Detailed Sources and Citations Index | |
  36. TABLE 22 North America Smart Pneumatics Market Size, by Product Type, 2021–2035 (USD Billion) | |
  37. TABLE 23 Europe Smart Pneumatics Market Size, by End-User Industry, 2021–2035 (USD Billion) | |
  38. TABLE 24 Asia-Pacific Smart Pneumatics Market Size, by Component, 2021–2035 (USD Billion) | |
  39. TABLE 25 Middle East & Africa Smart Pneumatics Market Size, by End-User Industry, 2021–2035 (USD Billion) | | LIST OF FIGURES | |
  40. FIGURE 1 Global Smart Pneumatics Market – Market Dynamics Overview | |
  41. FIGURE 2 Industry Value Chain Analysis – Smart Pneumatics | |
  42. FIGURE 3 Porter's Five Forces Analysis – Smart Pneumatics | |
  43. FIGURE 4 Global Smart Pneumatics Market Size Trend, 2021–2035 (USD Billion) | |
  44. FIGURE 5 Year-over-Year Growth Trend, 2022–2035 (%) | |
  45. FIGURE 6 Market Share by Product Type, 2025 vs 2035 (%) | |
  46. FIGURE 7 Market Share by Component, 2025 (%) | |
  47. FIGURE 8 Market Share by Instrument Type, 2025 (%) | |
  48. FIGURE 9 Market Share by End-User Industry, 2025 (%) | |
  49. FIGURE 10 Market Share by Communication Protocol, 2025 (%) | |
  50. FIGURE 11 Market Share by Distribution Channel, 2025 (%) | |
  51. FIGURE 12 Regional Market Share Distribution, 2025 (%) | |
  52. FIGURE 13 Regional CAGR Comparison, 2026–2035 (%) | |
  53. FIGURE 14 North America Country-Level Share Breakdown, 2025 (%) | |
  54. FIGURE 15 Asia-Pacific Country-Level Share Breakdown, 2025 (%) | |
  55. FIGURE 16 Competitive Landscape – Estimated Revenue Share Ranges, 2026 | |
  56. FIGURE 17 Competitive Positioning Matrix – Technology Depth vs Service Attach

Segmentation Quick Reference

DimensionSub-SegmentsDominant SegmentFastest Growing Segment
By Product TypeSmart Pneumatic Valves; Smart Pneumatic Actuators; Smart Pneumatic ModulesSmart Pneumatic Valves (47.6% share, 2025)Smart Pneumatic Modules (8.90% CAGR)
By ComponentHardware; Software; ServicesHardware (USD 3.86 Billion, 2025)Services (10.53% CAGR)
By Instrument TypeSensors; Controllers; Actuating DevicesSensors (38.2% share, 2025)Actuating Devices (6.90% CAGR)
By End-User IndustryAutomotive; Oil & Gas; Food & Beverage; Semiconductor & ElectronicsAutomotive (29.3% share, 2025)Semiconductor & Electronics (9.50% CAGR)
By Communication ProtocolEtherNet/IP; PROFINET; IO-LinkEtherNet/IP (33.6% share, 2025)IO-Link (9.20% CAGR)
By Distribution ChannelDirect Sales; Distributors; Online ChannelsDirect Sales (54.1% share, 2025)Online Channels (8.60% CAGR)


Market Segmentation Overview

By Product Type

Sub-SegmentKey Trend
Smart Pneumatic ValvesSensor-rich manifolds broadcasting pressure, flow, and cycle counts to PLCs
Smart Pneumatic ActuatorsMagnetic encoders delivering 0.1 mm positional feedback for multi-axis moves
Smart Pneumatic ModulesApp-configurable enclosures bundling valve control, regulation, and edge compute


Smart pneumatic valves lead this dimension because the manifold is where diagnostic data naturally aggregates before reaching the controller, and because manifold replacement cycles run faster than cylinder replacement. Smart pneumatic modules grow fastest at 8.90% as fast-moving consumer-goods, and greenfield lines reward the ability to switch a module from on/off to proportional or vacuum duty without hardware changes. Smart pneumatic actuators occupy the middle ground, gaining traction where encoder feedback is specified but rarely driving whole-line purchase decisions.

By Component

Sub-SegmentKey Trend
HardwareSecure-boot firmware and embedded flow sensing in regulator bodies
SoftwareAnomaly-ranking dashboards with automatic CMMS work-order generation
ServicesEnergy audits, remote-assist subscriptions, and shared-savings contracts


Hardware remains the revenue anchor at USD 3.86 billion in 2025 because physical valves, cylinders, and manifolds must still be bought and replaced regardless of how much intelligence sits above them. Services grow fastest at 10.53% as vendors convert transactional sales into recurring contracts through energy-audit engagements that assign monetary values to individual air leaks. Software growth trails services because most analytics is still bundled into service agreements rather than licensed standalone by plant buyers.

By Instrument Type

Sub-SegmentKey Trend
SensorsMiniaturized flow and pressure elements integrated into regulator and cylinder bodies
ControllersEdge inference and protocol conversion at the manifold rather than the PLC
Actuating DevicesDiagnostic-capable variants closing the price gap with conventional units


Sensors hold 38.2% of this dimension because measurement density determines what any downstream analytics can detect — no sensor, no diagnostic. Controllers grow in strategic weight as inference migrates from cloud to manifold, letting devices classify their own failure modes instead of streaming raw traces. Actuating devices post the steadier 6.90% growth typical of replacement-driven demand, where buyers upgrade at end-of-life rather than initiating standalone projects.

By End-User Industry

Sub-SegmentKey Trend
AutomotivePiston-seal wear sensing aligned to takt-break maintenance windows
Oil & GasPartial-stroke testing on emergency shutdown valve actuation
Food & BeverageWashdown-rated actuation with documented maintenance intervals
Semiconductor & ElectronicsClass 0 air purity and miniature bellows cylinders for wafer handling


Automotive holds 29.3% because body shops and paint lines operate thousands of clamping and handling axes per plant, giving the sector unmatched unit volume. Semiconductor and electronics expand fastest at 9.50% as fab buildouts specify cleanroom-compatible stainless variants and vacuum generators that adjust suction force from live leak measurement. Oil and gas contributes lower volume but higher per-unit value, since safety-certified actuation with diagnostic capability carries substantial specification premiums.

By Communication Protocol

Sub-SegmentKey Trend
EtherNet/IPAnchored to the North American controller installed base
PROFINETStandard on European exported machinery and machine-builder platforms
IO-LinkDevice-level parameter access and hot-swap cartridges without rewiring


EtherNet/IP leads at 33.6% because valve suppliers follow whichever backbone the plant's controller vendor established, and North American brownfield plants rarely change backbones. IO-Link grows fastest at 9.20% since it sits beneath the fieldbus rather than competing with it, delivering per-device diagnostics over standard three-wire cabling. PROFINET holds comparable installed weight to EtherNet/IP but grows more slowly, reflecting the maturity of the European machine-building base it serves.

By Distribution Channel

Sub-SegmentKey Trend
Direct SalesApplication engineering bundled into greenfield project specification
DistributorsLocal stock availability and same-week replacement for mid-market plants
Online ChannelsWeb configurators enabling repeat ordering of validated manifold builds


Direct sales dominate at 54.1% because fab and automotive greenfield projects require engineering support that no catalogue transaction can replicate, and because platform decisions are made in specification meetings rather than purchase orders. Online channels grow fastest at 8.60% once a plant standardizes on a single valve-island family, at which point reordering becomes configuration rather than selection. Distributors retain the mid-market long tail where inventory proximity outweighs engineering depth.




Download PDF ×

We do not share your information with anyone. However, we may send you emails based on your report interest from time to time. You may contact us at any time to opt-out.