• Cat-intel
  • MedIntelliX
  • Resources
  • About Us
  • Hero Background
    English
    Chinese
    French
    Japanese
    Korean
    German
    Spanish

    Smart Labels Market Analysis

    ID: MRFR/PNT/0786-HCR
    111 Pages
    Snehal Singh
    October 2025

    Smart Labels Market Research Report By Technology (RFID, NFC, QR Codes, Printed Electronics), By Type (Electronic Shelf Labels, In-Mold Labels, Wearable Smart Labels), By End Use (Retail, Logistics, Healthcare, Manufacturing), By Material (Paper, Plastic, Metal, Wood) and By Regional (North America, Europe, South America, Asia Pacific, Middle East and Africa) - Forecast to 2035.

    Share:
    Download PDF ×

    We do not share your information with anyone. However, we may send you emails based on your report interest from time to time. You may contact us at any time to opt-out.

    Smart Labels Market Infographic
    $ 4,950.0
    $ 5,950.0
    $ 7,250.0

    Market Analysis

    In-depth Analysis of Smart Labels Market Industry Landscape

    Growing demand for innovative labeling solutions across various industries is fueling dynamic growth within the Smart Labels sector. These labels incorporate the latest technologies, such as RFID (Radio-Frequency Identification) tags and NFC (Near Field Communication), making them highly different from traditional labeling methods. Enhanced supply chain efficiency is one of the major factors driving the growth of the Smart Labels market. Many businesses have been using smart labels to improve their inventory management, minimize errors in logistics, and track products in real-time. The incorporation of RFID and NFC technologies allows for continuous monitoring and control over goods across the entire supply chain, thus enhancing operational efficiency. Additionally, awareness and adoption of smart labels are increasingly becoming important aspects of retail dynamics. They allow for an interactive experience between retailers and consumers. Another industry sector that hugely contributes to development within Smart Labels is healthcare. In pharmaceuticals as well as healthcare, smart labels play an important role by ensuring that drugs and medical devices are authentic and traceable. RFID-enabled labels help track a pharmaceutical product from manufacturing through distribution to the end-user. Furthermore, environmental sustainability is another key driver for the rise of smart label adoption. In order to reduce their ecological footprints, these companies can use smart labels instead of conventional ones because they offer environment-friendly options for this purpose. Being able to update information electronically reduces paper usage, hence reducing waste in line with what other industries are also trying to achieve under sustainable practices requirements. The market dynamics of smart labels are also affected by the competitive landscape. Technological advancements and competitive pricing have been made possible by a growing number of industry players. However, the initial cost of implementing such solutions, as well as concerns about data security and privacy, could limit growth potential. Population explosion and increase in urbanization have led to the emergence of industries dealing with food and health, among others. Consequently, packaging and printing will drive demand for smart labels. Moreover, there is an increase in disposable income, which the high usage of smartphone applications has boosted; hence, customers can easily get product information online. This necessitates that packaging must be intelligent enough to ensure a customer interface that will enable the smart label industry to take advantage of the driven demand. Additionally, there has been 44% growth in e-commerce, supporting further development of the smart labels market.

    Market Summary

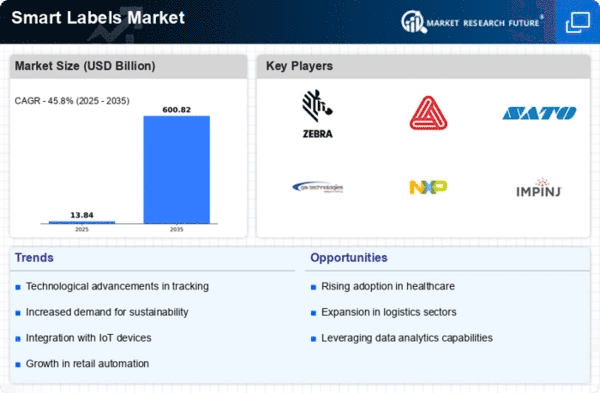
    As per Market Research Future Analysis, the Global Smart Labels Market was valued at 9.49 USD Billion in 2024 and is projected to grow to 600.82 USD Billion by 2035, reflecting a CAGR of 45.80% from 2025 to 2035. The market is driven by the increasing adoption of RFID technology, the demand for enhanced tracking and visibility, and the growth of e-commerce, which necessitates accurate logistics data.

    Key Market Trends & Highlights

    Key trends driving the Smart Labels Market include technological advancements and sustainability initiatives.

    • RFID technology is expected to grow from 1.7 USD Billion in 2024 to 4.2 USD Billion by 2035.
    • NFC technology is projected to increase from 0.9 USD Billion in 2024 to 2.2 USD Billion by 2035.
    • The retail sector is a major end-use market, emphasizing the need for efficient inventory management.
    • Sustainable materials are gaining traction, with a shift towards recyclable and biodegradable options.

    Market Size & Forecast

    2024 Market Size USD 9.49 Billion
    2035 Market Size USD 600.82 Billion
    CAGR (2025-2035) 45.80%
    Largest Regional Market Share in 2024 North America.

    Major Players

    Thinfilm, NXP Semiconductors, Avery Dennison, Smartrac, Paragon ID, CCL Industries, PragmatIC, Checkpoints Systems, RFID Solutions, OmniID, TSOP, Identiv, SATO Holdings, Zebra Technologies.

    Market Trends

    A number of important market factors are contributing to the notable expansion of the smart labels market. Smart label use is being driven by the growing need for inventory control and supply chain transparency. Innovations in RFID and NFC technology, which improve product monitoring and authenticity verification, are driving this trend.Furthermore, the integration of smart labels is accelerated by the growing demand for automated procedures in sectors like transportation, healthcare, and retail.

    There are many of opportunities in this industry, particularly for companies trying to increase customer engagement and operational efficiency. Smart labels have the appealing potential to provide real-time data collecting, which would enable businesses to save money and minimize waste. The potential for smart labels to improve traceability in shipping and consumer packaging is becoming increasingly more significant as e-commerce keeps growing internationally.Current patterns demonstrate the rising demand for sustainable and eco-friendly label options. The smart label business is moving toward recyclable and biodegradable materials as a result of the increased regulatory emphasis on sustainability.

    Businesses are encouraged to develop innovative product labeling that reflects these ideals as governments around the world support green projects. By incorporating smart labels into a wider network of smart devices, digital technology advancements, particularly in IoT connectivity, are creating new opportunities for smart labels. The significance of smart labels is being cemented globally as a result of their alignment with smart city projects, which are increasing their relevance in the urban logistics and transportation sectors.

    The integration of smart labels into supply chain management is poised to enhance operational efficiency and transparency, reflecting a growing trend towards digitization in logistics.

    U.S. Department of Commerce

    Smart Labels Market Market Drivers

    Rising E-commerce Sector

    The expansion of the e-commerce sector serves as a vital driver for the Global Smart Labels Market Industry. With online shopping gaining immense popularity, retailers are adopting smart labels to streamline logistics and enhance customer experience. Smart labels enable efficient tracking of shipments, reducing delivery times and improving customer satisfaction. Furthermore, they assist in managing returns and inventory more effectively. The growth of e-commerce is expected to contribute significantly to the market's valuation, as businesses seek innovative solutions to meet the demands of a rapidly evolving retail landscape.

    Market Growth Projections

    The Global Smart Labels Market Industry is projected to experience substantial growth, with a market value of 3.9 USD Billion in 2024, anticipated to reach 9.5 USD Billion by 2035. This growth trajectory suggests a robust CAGR of 8.43% from 2025 to 2035, indicating a strong demand for smart labeling solutions across various sectors. The increasing integration of smart labels in logistics, retail, and healthcare highlights their versatility and importance in modern supply chains. As industries continue to innovate and adopt these technologies, the market is likely to witness significant advancements and opportunities.

    Technological Advancements

    The Global Smart Labels Market Industry experiences robust growth driven by rapid technological advancements. Innovations in RFID, NFC, and QR code technologies enhance the functionality and efficiency of smart labels. For instance, RFID tags are increasingly utilized in supply chain management, enabling real-time tracking of goods. This technology not only reduces operational costs but also improves inventory accuracy. As of 2024, the market is valued at 3.9 USD Billion, with projections indicating a rise to 9.5 USD Billion by 2035. The anticipated CAGR of 8.43% from 2025 to 2035 underscores the potential for continued innovation in this sector.

    Environmental Sustainability Initiatives

    Environmental sustainability initiatives increasingly influence the Global Smart Labels Market Industry. Companies are adopting eco-friendly practices, including the use of sustainable materials for smart labels. This shift is driven by consumer demand for environmentally responsible products and the need to reduce carbon footprints. Smart labels can also contribute to waste reduction by improving inventory management and minimizing product spoilage. As businesses align their operations with sustainability goals, the market for smart labels is expected to expand, reflecting a growing commitment to environmental stewardship across various sectors.

    Regulatory Compliance and Safety Standards

    Regulatory compliance and safety standards play a crucial role in shaping the Global Smart Labels Market Industry. Various industries, particularly pharmaceuticals and food, are subject to stringent regulations that necessitate accurate labeling and traceability. Smart labels provide a reliable solution for meeting these compliance requirements, ensuring that products are correctly labeled and monitored throughout the supply chain. This adherence to safety standards not only protects consumers but also enhances brand reputation. As regulations continue to evolve, the demand for smart labels is likely to increase, driving market growth and innovation.

    Growing Demand for Supply Chain Transparency

    The demand for enhanced supply chain transparency significantly propels the Global Smart Labels Market Industry. Businesses are increasingly adopting smart labels to provide real-time data on product origin, handling, and delivery status. This trend is particularly evident in the food and pharmaceutical sectors, where traceability is crucial for compliance and consumer safety. Smart labels facilitate better inventory management and reduce losses due to spoilage or theft. As companies strive to meet regulatory requirements and consumer expectations, the market is poised for substantial growth, reflecting the increasing importance of transparency in global supply chains.

    Market Segment Insights

    Smart Labels Market Technology Insights

    The Technology segment of the Smart Labels Market showed significant potential and growth within the industry, driven primarily by technological advancements and increased demand for efficient tracking systems.Within this segment, Radio-Frequency Identification (RFID) technology was a major contributor, with a market value of 1.7 USD Billion in 2024, and projected to reach 4.2 USD Billion by 2035. This technology dominated due to its capability for automatic identification and tracking, which enhanced supply chain management and inventory accuracy.Near Field Communication (NFC) also played a pivotal role, valued at 0.9 USD Billion in 2024 and expanding to 2.2 USD Billion by 2035.

    Its ease of use in contactless payments and information sharing made it significant in consumer-oriented applications. In addition, QR Codes are expected to grow from a valuation of 0.8 USD Billion in 2024 to 2.4 USD Billion by 2035, highlighting their importance in marketing and customer engagement.

    Their ability to link physical products to digital content provides brands with an innovative way to connect with consumers, driving demand in various industries, including retail and logistics.Printed Electronics, while smaller in scale, with a valuation of 0.5 USD Billion in 2024 anticipated to grow to 0.7 USD Billion by 2035, also contributed to the market with its unique applications in creating low-cost, flexible RFID tags and sensors.The presence of these advanced technologies supports significant market trends towards automation and integration in inventory systems, which are critical for enhancing operational efficiencies across various sectors.Overall, the Smart Labels Market segmentation by Technology indicates a diverse landscape where RFID and NFC technologies dominate while QR Codes and Printed Electronics present opportunities for further growth and innovation in this rapidly evolving industry.

    Source: Primary Research, Secondary Research, Market Research Future Database and Analyst Review

    Smart Labels Market Type Insights

    The Smart Labels Market is segmented into several types including Electronic Shelf Labels, In-Mold Labels, and Wearable Smart Labels. Each of these types plays a crucial role in the evolving landscape of smart labeling technology.Electronic Shelf Labels are particularly notable for their efficiency and ability to provide real-time pricing information, thereby enhancing customer experience and operational efficiency in retail environments.

    In-Mold Labels, on the other hand, are important for their durability and flexibility, making them ideal for a variety of packaging solutions across multiple industries.Meanwhile, Wearable Smart Labels have gained traction in the healthcare and logistics sectors, contributing to monitoring and tracking capabilities that are critical in today’s dynamic market. The Smart Labels Market data reveals that these types are not only driving innovation but also responding to increasing consumer demand for efficiency and connectivity.Market trends indicate a growing emphasis on sustainability and digital transformation, presenting opportunities for further growth within these segments.

    Challenges such as technological integration and cost factors remain, yet the overall trajectory for the Smart Labels Market industry suggests strong growth potential across all types.

    Smart Labels Market End Use Insights

    The Smart Labels Market showcases significant potential across various end-use categories. The retail sector is pivotal, driven by the increasing need for enhanced customer experience and efficient inventory management. Logistics also plays a crucial role, with smart labeling facilitating real-time tracking and reducing operational costs.The healthcare industry benefits from smart labels in medication management and patient identification, improving safety and operational workflow. Manufacturing is equally noteworthy, as companies leverage smart labels for tracking components and enhancing supply chain transparency.

    The market growth was highlighting the expanding application of smart labels across these essential sectors.Emerging trends, like automation and IoT integration, are key growth drivers in the Smart Labels Market, strengthening the importance of efficient labeling solutions in various industries. This creates opportunities for innovation while addressing challenges such as integration costs and technology adoption rates, shaping the future landscape of the market.

    Smart Labels Market Material Insights

    The Smart Labels Market, particularly focusing on the Material segment, showcases significant growth prospects. This segment is crucial for varied applications across industries such as retail, healthcare, and logistics, enhancing tracking, inventory management, and consumer engagement.The segmentation of this market into materials like Paper, Plastic, Metal, and Wood highlights the diverse options available to manufacturers and consumers. Paper labels are commonly favored for their eco-friendliness and cost-effectiveness, while plastic labels offer durability and water resistance. Metal labels, known for their robustness, cater to specialized industries requiring high durability, while Wood labels bring a unique aesthetic appeal, particularly in artisanal products.

    The rising demand for sustainable packaging solutions and innovations in label printing technology are driving the expansion of this market.In a context, regulatory requirements for product labeling and the increasing emphasis on traceability are notable growth drivers, creating opportunities for advancement within the Smart Labels Market industry. As a result, the market is projected to evolve with a positive trajectory towards 2035.

    Get more detailed insights about Smart Labels Market Research Report - Global Forecast to 2035

    Regional Insights

    The Smart Labels Market showcased a diversified structure with significant regional variation, particularly in North America, Europe, APAC, South America, and the Middle East and Africa (MEA).In 2024, North America led this market with a notable valuation of 1.035 USD Billion, expanding to 2.536 USD Billion by 2035, thereby showcasing its critical role in driving market growth due to advanced technological infrastructure and extensive adoption of automation in various sectors.Europe followed closely with a market value of 0.876 USD Billion in 2024, projected to reach 2.14 USD Billion in 2035, as it emphasized sustainability and efficiency in supply chains.The APAC region, with a valuation of 0.955 USD Billion in 2024, is expected to witness significant growth to 2.298 USD Billion by 2035, spurred by rapid industrialization and a growing appetite for smart solutions in emerging economies.Meanwhile, South America and MEA, with respective valuations of 0.398 USD Billion and 0.637 USD Billion in 2024, are anticipated to grow as investment in retail and logistics modernizes, reaching 1.03 USD Billion and 1.506 USD Billion by 2035.These regional opportunities align with the growing demand for enhanced tracking, inventory management, and consumer engagement capabilities, driven by the ongoing trends in digital transformation and smart supply chain management within the Smart Labels Market industry.

    Smart Labels Market Regional Insights

    Source: Primary Research, Secondary Research, Market Research Future Database and Analyst Review

    Key Players and Competitive Insights

    The Smart Labels Market is characterized by a dynamic competitive landscape, with various players striving to capture market share through innovative products and strategic partnerships. This sector has gained traction due to increasing demand for efficient tracking, inventory management, and enhanced consumer engagement across various industries such as retail, healthcare, and logistics.Players in the market are focusing on advancements in technology, such as RFID, NFC, and barcode systems, to meet the evolving requirements of businesses and consumers.

    The intersection of technology and market demand has bred a competitive environment where companies continuously enhance their product offerings and value propositions to stand out.Factors such as the adaptation of sustainable practices and investment in smart technologies further fuel the growth of this market, increasing competition among existing and emerging players. Thinfilm has established itself as a notable player in the Smart Labels Market, leveraging its strengths in innovative solutions and advanced materials technology.The company specializes in developing unique electronic paper and printed electronics solutions, setting itself apart in terms of product differentiation.

    Thinfilm's robust research and development capabilities and strong intellectual property portfolio enable the company to create advanced products that tackle current market challenges.Its strategic collaborations with industry stakeholders bolster its position within the market, enhancing its ability to deliver scalable solutions tailored to diverse applications in various sectors, including health and safety, consumer products, and logistics.The company's commitment to sustainability and efficiency in its manufacturing processes further solidifies its competitive edge within the Smart Labels Market.NXP Semiconductors is also a significant contender in the Smart Labels Market, offering a diverse range of products that cater to the needs of numerous industries.

    The company has a strong presence in the RFID segment, delivering solutions that ensure efficient asset tracking and management, which are essential for current market demands.NXP Semiconductors focuses on innovation, consistently enhancing its product suite to include advanced features such as improved read ranges and secure data transmission capabilities.

    By acquiring other technology companies, NXP has further strengthened its position in the market, improving its technological capabilities and expanding its service offerings.The company’s robust product line includes not only smart labels but also integrated circuits and sensing technologies that serve various applications globally, positioning it strategically within the competitive landscape of smart labeling solutions.Its emphasis on customer collaboration and adaptability to market trends further enables NXP Semiconductors to maintain its competitive advantage in the ever-evolving Smart Labels Market.

    Key Companies in the Smart Labels Market market include

    Industry Developments

    • Q2 2024: Avery Dennison launches atma.io connected product cloud for smart labels Avery Dennison announced the launch of its atma.io connected product cloud, a platform designed to enable end-to-end supply chain transparency and product authentication using smart labels and RFID technology.
    • Q2 2024: Zebra Technologies Introduces New RFID Smart Label Solutions for Retail and Healthcare Zebra Technologies unveiled a new line of RFID-enabled smart labels aimed at improving inventory management and patient safety in retail and healthcare sectors.
    • Q2 2024: CCL Industries Expands Smart Label Production with New Facility in Germany CCL Industries announced the opening of a new manufacturing facility in Germany dedicated to the production of smart labels, supporting increased demand in the European market.
    • Q3 2024: SATO and Fujitsu Partner to Develop Next-Generation RFID Smart Labels SATO Holdings Corporation entered into a partnership with Fujitsu to co-develop advanced RFID smart labels for logistics and supply chain applications.
    • Q3 2024: Thin Film Electronics ASA Announces Strategic Investment to Scale Smart Label Production Thin Film Electronics ASA secured a strategic investment to expand its smart label manufacturing capabilities, focusing on energy-efficient printed electronics.
    • Q3 2024: Avery Dennison Acquires Smart Label Startup PragmatIC Semiconductor Avery Dennison completed the acquisition of PragmatIC Semiconductor, a UK-based startup specializing in flexible electronics for smart labels, to enhance its product portfolio.
    • Q4 2024: Zebra Technologies Wins Major Smart Label Contract with Global Retailer Zebra Technologies secured a significant contract to supply RFID smart labels to a leading global retailer, supporting large-scale inventory tracking initiatives.
    • Q4 2024: Smartrac Launches Eco-Friendly Smart Labels for Food Packaging Smartrac introduced a new line of eco-friendly smart labels designed for food packaging, featuring recyclable materials and enhanced tracking capabilities.
    • Q1 2025: CCL Industries Appoints New President for Smart Labels Division CCL Industries announced the appointment of a new president to lead its Smart Labels Division, aiming to accelerate innovation and global expansion.
    • Q1 2025: Avery Dennison Unveils NFC-Enabled Smart Labels for Pharmaceutical Authentication Avery Dennison launched a new range of NFC-enabled smart labels designed to improve pharmaceutical product authentication and patient safety.
    • Q2 2025: SATO Opens New Smart Label R&D Center in Singapore SATO Holdings Corporation inaugurated a new research and development center in Singapore focused on advancing smart label technologies for logistics and healthcare.
    • Q2 2025: Zebra Technologies Partners with Microsoft to Integrate Smart Labels with Azure IoT Zebra Technologies announced a partnership with Microsoft to integrate its smart label solutions with Azure IoT, enabling enhanced data analytics and supply chain visibility.

    Future Outlook

    Smart Labels Market Future Outlook

    The Smart Labels Market is projected to grow at an 45.80% CAGR from 2025 to 2035, driven by advancements in RFID technology, increasing demand for supply chain transparency, and rising consumer awareness.

    New opportunities lie in:

    • Develop innovative smart label solutions for the pharmaceutical sector to enhance traceability and compliance.
    • Leverage IoT integration in smart labels for real-time data analytics and inventory management.
    • Expand into emerging markets with tailored smart label applications for retail and logistics industries.

    By 2035, the Smart Labels Market is expected to achieve substantial growth, reflecting evolving technological advancements and market demands.

    Market Segmentation

    Smart Labels Market Type Outlook

    • Electronic Shelf Labels
    • In-Mold Labels
    • Wearable Smart Labels

    Smart Labels Market End Use Outlook

    • Retail
    • Logistics
    • Healthcare
    • Manufacturing

    Smart Labels Market Material Outlook

    • Paper
    • Plastic
    • Metal
    • Wood

    Smart Labels Market Regional Outlook

    • North America
    • Europe
    • South America
    • Asia Pacific
    • Middle East and Africa

    Smart Labels Market Technology Outlook

    • RFID
    • NFC
    • QR Codes
    • Printed Electronics

    Report Scope

    Market Size 2024 9.49 Market Size 2025 13.84 Market Size 2035 600.82 Base Year 2024 Market Forecast Period 2025 - 2035 Compound Annual Growth Rate (CAGR) 45.80% (2025 - 2035)

    Market Highlights

    Author

    Snehal Singh
    Assistant Manager - Research

    She holds an experience of about 6+ years in market research and business consulting, working under the spectrum of information communication technology, telecommunications and semiconductor domains. aarti conceptualizes and implements a scalable business strategy and provides strategic leadership to the clients. her expertise lies in market estimation, competitive intelligence, pipeline analysis, customer assessment, etc.

    Leave a Comment

    Latest Comments

    John Doe
    john@example.com

    This is a great article! Really helped me understand the topic better.

    Posted on July 23, 2025, 10:15 AM
    Jane Smith
    jane@domain.com

    Thanks for sharing this. I’ve bookmarked it for later reference.

    Posted on July 22, 2025, 7:45 PM

    FAQs

    What was the market size for the Smart Labels Market in 2024?

    The Smart Labels Market was valued at 3.9 USD Billion in 2024.

    How much is the Smart Labels Market projected to be valued in 2035?

    By 2035, the Smart Labels Market is projected to reach a value of 9.5 USD Billion.

    What is the expected CAGR for the Smart Labels Market from 2025 to 2035?

    Smart Labels Market is expected to grow with a CAGR of 45.8% in the period 2025-2035

    Which region is predicted to have the largest market share in the Smart Labels Market by 2035?

    North America is predicted to hold the largest market share, with an estimated value of 2.536 USD Billion in 2035.

    What are the expected market values for RFID technology in the Smart Labels Market in 2024 and 2035?

    RFID technology was valued at 1.7 USD Billion in 2024 and is expected to reach 4.2 USD Billion in 2035.

    What are the market sizes for NFC technology within the Smart Labels Market by 2024 and 2035?

    NFC technology was valued at 0.9 USD Billion in 2024 and 2.2 USD Billion in 2035.

    Who are the major players in the Smart Labels Market?

    Key players in the Smart Labels Market include Thinfilm, NXP Semiconductors, Avery Dennison, and Zebra Technologies among others.

    What is the anticipated market growth for Europe in the Smart Labels Market by 2035?

    Europe is expected to achieve a market value of 2.14 USD Billion in the Smart Labels Market by 2035.

    What market size is expected for QR Code technology in the Smart Labels Market by 2024 and 2035?

    QR Code technology was valued at 0.8 USD Billion in 2024 and is likely to reach 2.4 USD Billion in 2035.

    What is the expected market value for Printed Electronics technology within the Smart Labels Market in 2024 and 2035?

    Printed Electronics technology was valued at 0.5 USD Billion in 2024 and is expected to reach 0.7 USD Billion in 2035.

    1. EXECUTIVE SUMMARY
      1. \r\n
      2. Market Overview
      3. \r\n 1.2. Key Findings
      4. \r\n
      5. Market Segmentation
      6. \r\n 1.4. Competitive Landscape
      7. \r\n 1.5. Challenges and Opportunities
      8. \r\n
      9. Future Outlook
      10. \r\n
      11. \r\n
      12. \r\n
      13. \r\n 2. MARKET INTRODUCTION
      14. \r\n 2.1. Definition
      15. \r\n
      16. Scope of the study
        1. Research Objective
        2. Assumption
      17. \r\n
      18. \r\n
      19. \r\n 2.2.3. Limitations
      20. \r\n 3. RESEARCH METHODOLOGY
      21. \r\n 3.1. Overview
      22. \r\n
      23. Data Mining
      24. \r\n
      25. Secondary Research
        1. Primary Interviews and Information Gathering Process
        2. Breakdown of Primary Respondents
      26. \r\n 3.4. Primary Research
      27. \r\n
      28. \r\n
      29. \r\n
      30. Forecasting Model
        1. Bottom-Up Approach
      31. \r\n 3.6. Market Size Estimation
      32. \r\n
      33. \r\n 3.6.2. Top-Down
      34. Approach
      35. \r\n 3.7. Data Triangulation
      36. \r\n 3.8. Validation
      37. \r\n
      38. \r\n
      39. \r\n
      40. \r\n 4.
    2. MARKET DYNAMICS
      1. \r\n
      2. Overview
      3. \r\n 4.2. Drivers
      4. \r\n 4.3. Restraints
      5. \r\n
      6. Opportunities
      7. \r\n 5. MARKET FACTOR ANALYSIS
      8. \r\n 5.1. Value chain Analysis
      9. \r\n
      10. Porter's Five Forces Analysis
        1. Bargaining Power of Buyers
        2. Threat of New Entrants
        3. Threat of Substitutes
        4. Opportunity and Threat Analysis
      11. \r\n 5.2.1. Bargaining Power of Suppliers
      12. \r\n
      13. \r\n
      14. \r\n
      15. \r\n 5.2.5. Intensity
      16. of Rivalry
      17. \r\n 5.3. COVID-19 Impact Analysis
      18. \r\n 5.3.1. Market
      19. Impact Analysis
      20. \r\n 5.3.2. Regional Impact
      21. \r\n
      22. \r\n
      23. \r\n
      24. \r\n
    3. \r\n 6. Smart Labels Market, BY Technology (USD Billion)
      1. \r\n
      2. RFID
      3. \r\n
      4. NFC
      5. \r\n 6.3. QR Codes
      6. \r\n 6.4. Printed Electronics
      7. \r\n
    4. Smart Labels Market, BY Type (USD Billion)
      1. \r\n 7.1. Electronic Shelf Labels
      2. \r\n
      3. In-Mold Labels
      4. \r\n 7.3. Wearable Smart Labels
      5. \r\n 8.
    5. Smart Labels Market, BY End Use (USD Billion)
      1. \r\n 8.1. Retail
      2. \r\n
      3. Logistics
      4. \r\n
      5. Healthcare
      6. \r\n 8.4. Manufacturing
      7. \r\n
    6. Smart Labels Market, BY Material (USD Billion)
      1. \r\n 9.1. Paper
      2. \r\n 9.2. Plastic
      3. \r\n
      4. Metal
      5. \r\n
      6. Wood
    7. \r\n 10. Smart Labels Market, BY Regional (USD
      1. Billion)
      2. \r\n
      3. North America
        1. Canada
        2. UK
        3. Russia
        4. Spain
        5. India
        6. South Korea
        7. Malaysia
        8. Indonesia
        9. Rest of APAC
        10. Brazil
        11. Argentina
        12. Rest of South America
        13. Rest of MEA
      4. \r\n 10.1.1. US
      5. \r\n
      6. \r\n 10.2. Europe
      7. \r\n 10.2.1. Germany
      8. \r\n
      9. \r\n 10.2.3. France
      10. \r\n
      11. \r\n 10.2.5. Italy
      12. \r\n
      13. \r\n 10.2.7. Rest
      14. of Europe
      15. \r\n 10.3. APAC
      16. \r\n 10.3.1. China
      17. \r\n
      18. \r\n 10.3.3. Japan
      19. \r\n
      20. \r\n
      21. \r\n 10.3.6. Thailand
      22. \r\n
      23. \r\n
      24. \r\n 10.4. South America
      25. \r\n
      26. \r\n 10.4.2. Mexico
      27. \r\n
      28. \r\n
      29. \r\n 10.5. MEA
      30. \r\n 10.5.1. GCC
      31. Countries
      32. \r\n 10.5.2. South Africa
      33. \r\n
      34. \r\n
      35. \r\n
      36. \r\n
      37. \r\n 11.
      38. Competitive Landscape
      39. \r\n
      40. Overview
      41. \r\n 11.2. Competitive Analysis
      42. \r\n 11.3. Market share Analysis
      43. \r\n
      44. Major Growth Strategy in the Smart Labels Market
      45. \r\n 11.5. Competitive Benchmarking
      46. \r\n
      47. Leading Players in Terms of Number of Developments in the Smart Labels
      48. Market
      49. \r\n
      50. Key developments and growth strategies
      51. \r\n 11.7.1. New
      52. Product Launch/Service Deployment
      53. \r\n 11.7.2. Merger
      54. & Acquisitions
      55. \r\n 11.7.3. Joint Ventures
      56. \r\n
      57. Major Players Financial Matrix
        1. Key Developments
        2. SWOT Analysis
        3. Key Developments
        4. SWOT Analysis
        5. Key Developments
        6. SWOT Analysis
        7. Key Developments
        8. SWOT Analysis
        9. Key Developments
        10. SWOT Analysis
        11. Key Developments
        12. SWOT Analysis
        13. Key Developments
        14. SWOT Analysis
        15. Key Developments
        16. SWOT Analysis
        17. Key Developments
        18. SWOT Analysis
        19. Key Developments
        20. SWOT Analysis
        21. Key Developments
        22. SWOT Analysis
        23. Key Developments
        24. SWOT Analysis
        25. Key Developments
        26. SWOT Analysis
        27. Key Developments
        28. SWOT Analysis
        29. Key Developments
        30. SWOT Analysis
      58. \r\n 11.8.1. Sales
      59. and Operating Income
      60. \r\n 11.8.2. Major Players R&D
      61. Expenditure. 2023
      62. \r\n 12. Company Profiles
      63. \r\n 12.1. Thinfilm
      64. \r\n 12.1.1. Financial
      65. Overview
      66. \r\n 12.1.2. Products Offered
      67. \r\n
      68. \r\n
      69. \r\n 12.1.5. Key
      70. Strategies
      71. \r\n 12.2. NXP Semiconductors
      72. \r\n 12.2.1. Financial
      73. Overview
      74. \r\n 12.2.2. Products Offered
      75. \r\n
      76. \r\n
      77. \r\n 12.2.5. Key
      78. Strategies
      79. \r\n 12.3. Avery Dennison
      80. \r\n 12.3.1. Financial
      81. Overview
      82. \r\n 12.3.2. Products Offered
      83. \r\n
      84. \r\n
      85. \r\n 12.3.5. Key
      86. Strategies
      87. \r\n 12.4. Smartrac
      88. \r\n 12.4.1. Financial
      89. Overview
      90. \r\n 12.4.2. Products Offered
      91. \r\n
      92. \r\n
      93. \r\n 12.4.5. Key
      94. Strategies
      95. \r\n 12.5. Paragon ID
      96. \r\n 12.5.1. Financial
      97. Overview
      98. \r\n 12.5.2. Products Offered
      99. \r\n
      100. \r\n
      101. \r\n 12.5.5. Key
      102. Strategies
      103. \r\n 12.6. CCL Industries
      104. \r\n 12.6.1. Financial
      105. Overview
      106. \r\n 12.6.2. Products Offered
      107. \r\n
      108. \r\n
      109. \r\n 12.6.5. Key
      110. Strategies
      111. \r\n 12.7. PragmatIC
      112. \r\n 12.7.1. Financial
      113. Overview
      114. \r\n 12.7.2. Products Offered
      115. \r\n
      116. \r\n
      117. \r\n 12.7.5. Key
      118. Strategies
      119. \r\n 12.8. Checkpoints Systems
      120. \r\n 12.8.1. Financial
      121. Overview
      122. \r\n 12.8.2. Products Offered
      123. \r\n
      124. \r\n
      125. \r\n 12.8.5. Key
      126. Strategies
      127. \r\n 12.9. RFID Solutions
      128. \r\n 12.9.1. Financial
      129. Overview
      130. \r\n 12.9.2. Products Offered
      131. \r\n
      132. \r\n
      133. \r\n 12.9.5. Key
      134. Strategies
      135. \r\n 12.10. OmniID
      136. \r\n 12.10.1. Financial
      137. Overview
      138. \r\n 12.10.2. Products Offered
      139. \r\n
      140. \r\n
      141. \r\n 12.10.5. Key
      142. Strategies
      143. \r\n 12.11. TSOP
      144. \r\n 12.11.1. Financial
      145. Overview
      146. \r\n 12.11.2. Products Offered
      147. \r\n
      148. \r\n
      149. \r\n 12.11.5. Key
      150. Strategies
      151. \r\n 12.12. Identiv
      152. \r\n 12.12.1. Financial
      153. Overview
      154. \r\n 12.12.2. Products Offered
      155. \r\n
      156. \r\n
      157. \r\n 12.12.5. Key
      158. Strategies
      159. \r\n 12.13. SATO Holdings
      160. \r\n 12.13.1. Financial
      161. Overview
      162. \r\n 12.13.2. Products Offered
      163. \r\n
      164. \r\n
      165. \r\n 12.13.5. Key
      166. Strategies
      167. \r\n 12.14. Zebra Technologies
      168. \r\n 12.14.1. Financial
      169. Overview
      170. \r\n 12.14.2. Products Offered
      171. \r\n
      172. \r\n
      173. \r\n 12.14.5. Key
      174. Strategies
      175. \r\n 12.15. Watershed Monitoring
      176. \r\n 12.15.1. Financial
      177. Overview
      178. \r\n 12.15.2. Products Offered
      179. \r\n
      180. \r\n
      181. \r\n 12.15.5. Key
      182. Strategies
      183. \r\n 13. Appendix
      184. \r\n 13.1. References
      185. \r\n
      186. Related Reports
      187. \r\nLIST Of tables
      188. \r\n
      189. \r\n Table 1. LIST OF ASSUMPTIONS
      190. \r\n Table 2. North America Smart Labels Market
      191. SIZE ESTIMATES & FORECAST, BY TECHNOLOGY, 2019-2035 (USD Billions)
      192. \r\n Table 3. North America Smart Labels Market
      193. SIZE ESTIMATES & FORECAST, BY TYPE, 2019-2035 (USD Billions)
      194. \r\n Table 4. North America Smart Labels Market
      195. SIZE ESTIMATES & FORECAST, BY END USE, 2019-2035 (USD Billions)
      196. \r\n Table 5. North America Smart Labels Market
      197. SIZE ESTIMATES & FORECAST, BY MATERIAL, 2019-2035 (USD Billions)
      198. \r\n Table 6. North America Smart Labels Market
      199. SIZE ESTIMATES & FORECAST, BY REGIONAL, 2019-2035 (USD Billions)
      200. \r\n Table 7. US Smart Labels Market SIZE ESTIMATES
      201. & FORECAST, BY TECHNOLOGY, 2019-2035 (USD Billions)
      202. \r\n Table 8. US Smart Labels Market SIZE ESTIMATES
      203. & FORECAST, BY TYPE, 2019-2035 (USD Billions)
      204. \r\n Table 9. US Smart Labels Market SIZE ESTIMATES
      205. & FORECAST, BY END USE, 2019-2035 (USD Billions)
      206. \r\n Table 10. US Smart Labels Market SIZE ESTIMATES
      207. & FORECAST, BY MATERIAL, 2019-2035 (USD Billions)
      208. \r\n Table 11. US Smart Labels Market SIZE ESTIMATES
      209. & FORECAST, BY REGIONAL, 2019-2035 (USD Billions)
      210. \r\n Table 12. Canada Smart Labels Market SIZE
      211. ESTIMATES & FORECAST, BY TECHNOLOGY, 2019-2035 (USD Billions)
      212. \r\n Table 13. Canada Smart Labels Market SIZE
      213. ESTIMATES & FORECAST, BY TYPE, 2019-2035 (USD Billions)
      214. \r\n Table 14. Canada Smart Labels Market SIZE
      215. ESTIMATES & FORECAST, BY END USE, 2019-2035 (USD Billions)
      216. \r\n Table 15. Canada Smart Labels Market SIZE
      217. ESTIMATES & FORECAST, BY MATERIAL, 2019-2035 (USD Billions)
      218. \r\n Table 16. Canada Smart Labels Market SIZE
      219. ESTIMATES & FORECAST, BY REGIONAL, 2019-2035 (USD Billions)
      220. \r\n Table 17. Europe Smart Labels Market SIZE
      221. ESTIMATES & FORECAST, BY TECHNOLOGY, 2019-2035 (USD Billions)
      222. \r\n Table 18. Europe Smart Labels Market SIZE
      223. ESTIMATES & FORECAST, BY TYPE, 2019-2035 (USD Billions)
      224. \r\n Table 19. Europe Smart Labels Market SIZE
      225. ESTIMATES & FORECAST, BY END USE, 2019-2035 (USD Billions)
      226. \r\n Table 20. Europe Smart Labels Market SIZE
      227. ESTIMATES & FORECAST, BY MATERIAL, 2019-2035 (USD Billions)
      228. \r\n Table 21. Europe Smart Labels Market SIZE
      229. ESTIMATES & FORECAST, BY REGIONAL, 2019-2035 (USD Billions)
      230. \r\n Table 22. Germany Smart Labels Market SIZE
      231. ESTIMATES & FORECAST, BY TECHNOLOGY, 2019-2035 (USD Billions)
      232. \r\n Table 23. Germany Smart Labels Market SIZE
      233. ESTIMATES & FORECAST, BY TYPE, 2019-2035 (USD Billions)
      234. \r\n Table 24. Germany Smart Labels Market SIZE
      235. ESTIMATES & FORECAST, BY END USE, 2019-2035 (USD Billions)
      236. \r\n Table 25. Germany Smart Labels Market SIZE
      237. ESTIMATES & FORECAST, BY MATERIAL, 2019-2035 (USD Billions)
      238. \r\n Table 26. Germany Smart Labels Market SIZE
      239. ESTIMATES & FORECAST, BY REGIONAL, 2019-2035 (USD Billions)
      240. \r\n Table 27. UK Smart Labels Market SIZE ESTIMATES
      241. & FORECAST, BY TECHNOLOGY, 2019-2035 (USD Billions)
      242. \r\n Table 28. UK Smart Labels Market SIZE ESTIMATES
      243. & FORECAST, BY TYPE, 2019-2035 (USD Billions)
      244. \r\n Table 29. UK Smart Labels Market SIZE ESTIMATES
      245. & FORECAST, BY END USE, 2019-2035 (USD Billions)
      246. \r\n Table 30. UK Smart Labels Market SIZE ESTIMATES
      247. & FORECAST, BY MATERIAL, 2019-2035 (USD Billions)
      248. \r\n Table 31. UK Smart Labels Market SIZE ESTIMATES
      249. & FORECAST, BY REGIONAL, 2019-2035 (USD Billions)
      250. \r\n Table 32. France Smart Labels Market SIZE
      251. ESTIMATES & FORECAST, BY TECHNOLOGY, 2019-2035 (USD Billions)
      252. \r\n Table 33. France Smart Labels Market SIZE
      253. ESTIMATES & FORECAST, BY TYPE, 2019-2035 (USD Billions)
      254. \r\n Table 34. France Smart Labels Market SIZE
      255. ESTIMATES & FORECAST, BY END USE, 2019-2035 (USD Billions)
      256. \r\n Table 35. France Smart Labels Market SIZE
      257. ESTIMATES & FORECAST, BY MATERIAL, 2019-2035 (USD Billions)
      258. \r\n Table 36. France Smart Labels Market SIZE
      259. ESTIMATES & FORECAST, BY REGIONAL, 2019-2035 (USD Billions)
      260. \r\n Table 37. Russia Smart Labels Market SIZE
      261. ESTIMATES & FORECAST, BY TECHNOLOGY, 2019-2035 (USD Billions)
      262. \r\n Table 38. Russia Smart Labels Market SIZE
      263. ESTIMATES & FORECAST, BY TYPE, 2019-2035 (USD Billions)
      264. \r\n Table 39. Russia Smart Labels Market SIZE
      265. ESTIMATES & FORECAST, BY END USE, 2019-2035 (USD Billions)
      266. \r\n Table 40. Russia Smart Labels Market SIZE
      267. ESTIMATES & FORECAST, BY MATERIAL, 2019-2035 (USD Billions)
      268. \r\n Table 41. Russia Smart Labels Market SIZE
      269. ESTIMATES & FORECAST, BY REGIONAL, 2019-2035 (USD Billions)
      270. \r\n Table 42. Italy Smart Labels Market SIZE
      271. ESTIMATES & FORECAST, BY TECHNOLOGY, 2019-2035 (USD Billions)
      272. \r\n Table 43. Italy Smart Labels Market SIZE
      273. ESTIMATES & FORECAST, BY TYPE, 2019-2035 (USD Billions)
      274. \r\n Table 44. Italy Smart Labels Market SIZE
      275. ESTIMATES & FORECAST, BY END USE, 2019-2035 (USD Billions)
      276. \r\n Table 45. Italy Smart Labels Market SIZE
      277. ESTIMATES & FORECAST, BY MATERIAL, 2019-2035 (USD Billions)
      278. \r\n Table 46. Italy Smart Labels Market SIZE
      279. ESTIMATES & FORECAST, BY REGIONAL, 2019-2035 (USD Billions)
      280. \r\n Table 47. Spain Smart Labels Market SIZE
      281. ESTIMATES & FORECAST, BY TECHNOLOGY, 2019-2035 (USD Billions)
      282. \r\n Table 48. Spain Smart Labels Market SIZE
      283. ESTIMATES & FORECAST, BY TYPE, 2019-2035 (USD Billions)
      284. \r\n Table 49. Spain Smart Labels Market SIZE
      285. ESTIMATES & FORECAST, BY END USE, 2019-2035 (USD Billions)
      286. \r\n Table 50. Spain Smart Labels Market SIZE
      287. ESTIMATES & FORECAST, BY MATERIAL, 2019-2035 (USD Billions)
      288. \r\n Table 51. Spain Smart Labels Market SIZE
      289. ESTIMATES & FORECAST, BY REGIONAL, 2019-2035 (USD Billions)
      290. \r\n Table 52. Rest of Europe Smart Labels Market
      291. SIZE ESTIMATES & FORECAST, BY TECHNOLOGY, 2019-2035 (USD Billions)
      292. \r\n Table 53. Rest of Europe Smart Labels Market
      293. SIZE ESTIMATES & FORECAST, BY TYPE, 2019-2035 (USD Billions)
      294. \r\n Table 54. Rest of Europe Smart Labels Market
      295. SIZE ESTIMATES & FORECAST, BY END USE, 2019-2035 (USD Billions)
      296. \r\n Table 55. Rest of Europe Smart Labels Market
      297. SIZE ESTIMATES & FORECAST, BY MATERIAL, 2019-2035 (USD Billions)
      298. \r\n Table 56. Rest of Europe Smart Labels Market
      299. SIZE ESTIMATES & FORECAST, BY REGIONAL, 2019-2035 (USD Billions)
      300. \r\n Table 57. APAC Smart Labels Market SIZE
      301. ESTIMATES & FORECAST, BY TECHNOLOGY, 2019-2035 (USD Billions)
      302. \r\n Table 58. APAC Smart Labels Market SIZE
      303. ESTIMATES & FORECAST, BY TYPE, 2019-2035 (USD Billions)
      304. \r\n Table 59. APAC Smart Labels Market SIZE
      305. ESTIMATES & FORECAST, BY END USE, 2019-2035 (USD Billions)
      306. \r\n Table 60. APAC Smart Labels Market SIZE
      307. ESTIMATES & FORECAST, BY MATERIAL, 2019-2035 (USD Billions)
      308. \r\n Table 61. APAC Smart Labels Market SIZE
      309. ESTIMATES & FORECAST, BY REGIONAL, 2019-2035 (USD Billions)
      310. \r\n Table 62. China Smart Labels Market SIZE
      311. ESTIMATES & FORECAST, BY TECHNOLOGY, 2019-2035 (USD Billions)
      312. \r\n Table 63. China Smart Labels Market SIZE
      313. ESTIMATES & FORECAST, BY TYPE, 2019-2035 (USD Billions)
      314. \r\n Table 64. China Smart Labels Market SIZE
      315. ESTIMATES & FORECAST, BY END USE, 2019-2035 (USD Billions)
      316. \r\n Table 65. China Smart Labels Market SIZE
      317. ESTIMATES & FORECAST, BY MATERIAL, 2019-2035 (USD Billions)
      318. \r\n Table 66. China Smart Labels Market SIZE
      319. ESTIMATES & FORECAST, BY REGIONAL, 2019-2035 (USD Billions)
      320. \r\n Table 67. India Smart Labels Market SIZE
      321. ESTIMATES & FORECAST, BY TECHNOLOGY, 2019-2035 (USD Billions)
      322. \r\n Table 68. India Smart Labels Market SIZE
      323. ESTIMATES & FORECAST, BY TYPE, 2019-2035 (USD Billions)
      324. \r\n Table 69. India Smart Labels Market SIZE
      325. ESTIMATES & FORECAST, BY END USE, 2019-2035 (USD Billions)
      326. \r\n Table 70. India Smart Labels Market SIZE
      327. ESTIMATES & FORECAST, BY MATERIAL, 2019-2035 (USD Billions)
      328. \r\n Table 71. India Smart Labels Market SIZE
      329. ESTIMATES & FORECAST, BY REGIONAL, 2019-2035 (USD Billions)
      330. \r\n Table 72. Japan Smart Labels Market SIZE
      331. ESTIMATES & FORECAST, BY TECHNOLOGY, 2019-2035 (USD Billions)
      332. \r\n Table 73. Japan Smart Labels Market SIZE
      333. ESTIMATES & FORECAST, BY TYPE, 2019-2035 (USD Billions)
      334. \r\n Table 74. Japan Smart Labels Market SIZE
      335. ESTIMATES & FORECAST, BY END USE, 2019-2035 (USD Billions)
      336. \r\n Table 75. Japan Smart Labels Market SIZE
      337. ESTIMATES & FORECAST, BY MATERIAL, 2019-2035 (USD Billions)
      338. \r\n Table 76. Japan Smart Labels Market SIZE
      339. ESTIMATES & FORECAST, BY REGIONAL, 2019-2035 (USD Billions)
      340. \r\n Table 77. South Korea Smart Labels Market
      341. SIZE ESTIMATES & FORECAST, BY TECHNOLOGY, 2019-2035 (USD Billions)
      342. \r\n Table 78. South Korea Smart Labels Market
      343. SIZE ESTIMATES & FORECAST, BY TYPE, 2019-2035 (USD Billions)
      344. \r\n Table 79. South Korea Smart Labels Market
      345. SIZE ESTIMATES & FORECAST, BY END USE, 2019-2035 (USD Billions)
      346. \r\n Table 80. South Korea Smart Labels Market
      347. SIZE ESTIMATES & FORECAST, BY MATERIAL, 2019-2035 (USD Billions)
      348. \r\n Table 81. South Korea Smart Labels Market
      349. SIZE ESTIMATES & FORECAST, BY REGIONAL, 2019-2035 (USD Billions)
      350. \r\n Table 82. Malaysia Smart Labels Market
      351. SIZE ESTIMATES & FORECAST, BY TECHNOLOGY, 2019-2035 (USD Billions)
      352. \r\n Table 83. Malaysia Smart Labels Market
      353. SIZE ESTIMATES & FORECAST, BY TYPE, 2019-2035 (USD Billions)
      354. \r\n Table 84. Malaysia Smart Labels Market
      355. SIZE ESTIMATES & FORECAST, BY END USE, 2019-2035 (USD Billions)
      356. \r\n Table 85. Malaysia Smart Labels Market
      357. SIZE ESTIMATES & FORECAST, BY MATERIAL, 2019-2035 (USD Billions)
      358. \r\n Table 86. Malaysia Smart Labels Market
      359. SIZE ESTIMATES & FORECAST, BY REGIONAL, 2019-2035 (USD Billions)
      360. \r\n Table 87. Thailand Smart Labels Market
      361. SIZE ESTIMATES & FORECAST, BY TECHNOLOGY, 2019-2035 (USD Billions)
      362. \r\n Table 88. Thailand Smart Labels Market
      363. SIZE ESTIMATES & FORECAST, BY TYPE, 2019-2035 (USD Billions)
      364. \r\n Table 89. Thailand Smart Labels Market
      365. SIZE ESTIMATES & FORECAST, BY END USE, 2019-2035 (USD Billions)
      366. \r\n Table 90. Thailand Smart Labels Market
      367. SIZE ESTIMATES & FORECAST, BY MATERIAL, 2019-2035 (USD Billions)
      368. \r\n Table 91. Thailand Smart Labels Market
      369. SIZE ESTIMATES & FORECAST, BY REGIONAL, 2019-2035 (USD Billions)
      370. \r\n Table 92. Indonesia Smart Labels Market
      371. SIZE ESTIMATES & FORECAST, BY TECHNOLOGY, 2019-2035 (USD Billions)
      372. \r\n Table 93. Indonesia Smart Labels Market
      373. SIZE ESTIMATES & FORECAST, BY TYPE, 2019-2035 (USD Billions)
      374. \r\n Table 94. Indonesia Smart Labels Market
      375. SIZE ESTIMATES & FORECAST, BY END USE, 2019-2035 (USD Billions)
      376. \r\n Table 95. Indonesia Smart Labels Market
      377. SIZE ESTIMATES & FORECAST, BY MATERIAL, 2019-2035 (USD Billions)
      378. \r\n Table 96. Indonesia Smart Labels Market
      379. SIZE ESTIMATES & FORECAST, BY REGIONAL, 2019-2035 (USD Billions)
      380. \r\n Table 97. Rest of APAC Smart Labels Market
      381. SIZE ESTIMATES & FORECAST, BY TECHNOLOGY, 2019-2035 (USD Billions)
      382. \r\n Table 98. Rest of APAC Smart Labels Market
      383. SIZE ESTIMATES & FORECAST, BY TYPE, 2019-2035 (USD Billions)
      384. \r\n Table 99. Rest of APAC Smart Labels Market
      385. SIZE ESTIMATES & FORECAST, BY END USE, 2019-2035 (USD Billions)
      386. \r\n Table 100. Rest of APAC Smart Labels Market
      387. SIZE ESTIMATES & FORECAST, BY MATERIAL, 2019-2035 (USD Billions)
      388. \r\n Table 101. Rest of APAC Smart Labels Market
      389. SIZE ESTIMATES & FORECAST, BY REGIONAL, 2019-2035 (USD Billions)
      390. \r\n Table 102. South America Smart Labels Market
      391. SIZE ESTIMATES & FORECAST, BY TECHNOLOGY, 2019-2035 (USD Billions)
      392. \r\n Table 103. South America Smart Labels Market
      393. SIZE ESTIMATES & FORECAST, BY TYPE, 2019-2035 (USD Billions)
      394. \r\n Table 104. South America Smart Labels Market
      395. SIZE ESTIMATES & FORECAST, BY END USE, 2019-2035 (USD Billions)
      396. \r\n Table 105. South America Smart Labels Market
      397. SIZE ESTIMATES & FORECAST, BY MATERIAL, 2019-2035 (USD Billions)
      398. \r\n Table 106. South America Smart Labels Market
      399. SIZE ESTIMATES & FORECAST, BY REGIONAL, 2019-2035 (USD Billions)
      400. \r\n Table 107. Brazil Smart Labels Market SIZE
      401. ESTIMATES & FORECAST, BY TECHNOLOGY, 2019-2035 (USD Billions)
      402. \r\n Table 108. Brazil Smart Labels Market SIZE
      403. ESTIMATES & FORECAST, BY TYPE, 2019-2035 (USD Billions)
      404. \r\n Table 109. Brazil Smart Labels Market SIZE
      405. ESTIMATES & FORECAST, BY END USE, 2019-2035 (USD Billions)
      406. \r\n Table 110. Brazil Smart Labels Market SIZE
      407. ESTIMATES & FORECAST, BY MATERIAL, 2019-2035 (USD Billions)
      408. \r\n Table 111. Brazil Smart Labels Market SIZE
      409. ESTIMATES & FORECAST, BY REGIONAL, 2019-2035 (USD Billions)
      410. \r\n Table 112. Mexico Smart Labels Market SIZE
      411. ESTIMATES & FORECAST, BY TECHNOLOGY, 2019-2035 (USD Billions)
      412. \r\n Table 113. Mexico Smart Labels Market SIZE
      413. ESTIMATES & FORECAST, BY TYPE, 2019-2035 (USD Billions)
      414. \r\n Table 114. Mexico Smart Labels Market SIZE
      415. ESTIMATES & FORECAST, BY END USE, 2019-2035 (USD Billions)
      416. \r\n Table 115. Mexico Smart Labels Market SIZE
      417. ESTIMATES & FORECAST, BY MATERIAL, 2019-2035 (USD Billions)
      418. \r\n Table 116. Mexico Smart Labels Market SIZE
      419. ESTIMATES & FORECAST, BY REGIONAL, 2019-2035 (USD Billions)
      420. \r\n Table 117. Argentina Smart Labels Market
      421. SIZE ESTIMATES & FORECAST, BY TECHNOLOGY, 2019-2035 (USD Billions)
      422. \r\n Table 118. Argentina Smart Labels Market
      423. SIZE ESTIMATES & FORECAST, BY TYPE, 2019-2035 (USD Billions)
      424. \r\n Table 119. Argentina Smart Labels Market
      425. SIZE ESTIMATES & FORECAST, BY END USE, 2019-2035 (USD Billions)
      426. \r\n Table 120. Argentina Smart Labels Market
      427. SIZE ESTIMATES & FORECAST, BY MATERIAL, 2019-2035 (USD Billions)
      428. \r\n Table 121. Argentina Smart Labels Market
      429. SIZE ESTIMATES & FORECAST, BY REGIONAL, 2019-2035 (USD Billions)
      430. \r\n Table 122. Rest of South America Smart
    8. Labels Market SIZE ESTIMATES & FORECAST, BY TECHNOLOGY, 2019-2035 (USD Billions)
      1. \r\n Table 123.
    9. Rest of South America Smart Labels Market SIZE ESTIMATES & FORECAST, BY TYPE,
      1. \r\n Table 124. Rest of South America Smart Labels Market SIZE
      2. ESTIMATES & FORECAST, BY END USE, 2019-2035 (USD Billions)
      3. \r\n Table 125. Rest of South America Smart
    10. Labels Market SIZE ESTIMATES & FORECAST, BY MATERIAL, 2019-2035 (USD Billions)
      1. \r\n Table 126.
    11. Rest of South America Smart Labels Market SIZE ESTIMATES & FORECAST, BY REGIONAL,
      1. \r\n Table 127. MEA Smart Labels Market SIZE ESTIMATES & FORECAST,
      2. BY TECHNOLOGY, 2019-2035 (USD Billions)
      3. \r\n Table 128. MEA Smart Labels Market SIZE ESTIMATES & FORECAST,
      4. BY TYPE, 2019-2035 (USD Billions)
      5. \r\n Table 129. MEA Smart Labels Market SIZE ESTIMATES & FORECAST,
      6. BY END USE, 2019-2035 (USD Billions)
      7. \r\n Table 130. MEA Smart Labels Market SIZE ESTIMATES & FORECAST,
      8. BY MATERIAL, 2019-2035 (USD Billions)
      9. \r\n Table 131. MEA Smart Labels Market SIZE ESTIMATES & FORECAST,
      10. BY REGIONAL, 2019-2035 (USD Billions)
      11. \r\n Table 132. GCC Countries Smart Labels Market SIZE ESTIMATES
      12. & FORECAST, BY TECHNOLOGY, 2019-2035 (USD Billions)
      13. \r\n Table 133. GCC Countries Smart Labels Market
      14. SIZE ESTIMATES & FORECAST, BY TYPE, 2019-2035 (USD Billions)
      15. \r\n Table 134. GCC Countries Smart Labels Market
      16. SIZE ESTIMATES & FORECAST, BY END USE, 2019-2035 (USD Billions)
      17. \r\n Table 135. GCC Countries Smart Labels Market
      18. SIZE ESTIMATES & FORECAST, BY MATERIAL, 2019-2035 (USD Billions)
      19. \r\n Table 136. GCC Countries Smart Labels Market
      20. SIZE ESTIMATES & FORECAST, BY REGIONAL, 2019-2035 (USD Billions)
      21. \r\n Table 137. South Africa Smart Labels Market
      22. SIZE ESTIMATES & FORECAST, BY TECHNOLOGY, 2019-2035 (USD Billions)
      23. \r\n Table 138. South Africa Smart Labels Market
      24. SIZE ESTIMATES & FORECAST, BY TYPE, 2019-2035 (USD Billions)
      25. \r\n Table 139. South Africa Smart Labels Market
      26. SIZE ESTIMATES & FORECAST, BY END USE, 2019-2035 (USD Billions)
      27. \r\n Table 140. South Africa Smart Labels Market
      28. SIZE ESTIMATES & FORECAST, BY MATERIAL, 2019-2035 (USD Billions)
      29. \r\n Table 141. South Africa Smart Labels Market
      30. SIZE ESTIMATES & FORECAST, BY REGIONAL, 2019-2035 (USD Billions)
      31. \r\n Table 142. Rest of MEA Smart Labels Market
      32. SIZE ESTIMATES & FORECAST, BY TECHNOLOGY, 2019-2035 (USD Billions)
      33. \r\n Table 143. Rest of MEA Smart Labels Market
      34. SIZE ESTIMATES & FORECAST, BY TYPE, 2019-2035 (USD Billions)
      35. \r\n Table 144. Rest of MEA Smart Labels Market
      36. SIZE ESTIMATES & FORECAST, BY END USE, 2019-2035 (USD Billions)
      37. \r\n Table 145. Rest of MEA Smart Labels Market
      38. SIZE ESTIMATES & FORECAST, BY MATERIAL, 2019-2035 (USD Billions)
      39. \r\n Table 146. Rest of MEA Smart Labels Market
      40. SIZE ESTIMATES & FORECAST, BY REGIONAL, 2019-2035 (USD Billions)
      41. \r\n Table 147. PRODUCT LAUNCH/PRODUCT DEVELOPMENT/APPROVAL
      42. \r\n Table 148.
      43. ACQUISITION/PARTNERSHIP
      44. \r\n
      45. \r\n
      46. \r\n
      47. \r\n
      48. \r\n
      49. \r\n
      50. \r\n
      51. \r\n
      52. \r\n
      53. \r\n
      54. \r\n
      55. \r\n
      56. \r\n
      57. \r\n
      58. \r\n
      59. \r\n
      60. \r\n
      61. \r\n
      62. \r\n
      63. \r\n
      64. \r\n
      65. \r\n
      66. \r\n
      67. \r\n
      68. \r\n
      69. \r\n
      70. \r\n
      71. \r\n
      72. \r\n
      73. \r\nLIST Of figures
      74. \r\n
      75. \r\n Figure
    12. MARKET SYNOPSIS
      1. \r\n
    13. NORTH AMERICA SMART LABELS MARKET ANALYSIS
      1. \r\n Figure 3. US SMART LABELS MARKET ANALYSIS
      2. BY TECHNOLOGY
      3. \r\n
    14. US SMART LABELS MARKET ANALYSIS BY TYPE
      1. \r\n Figure 5. US SMART LABELS MARKET ANALYSIS BY END USE
      2. \r\n Figure 6. US SMART LABELS MARKET ANALYSIS
      3. BY MATERIAL
      4. \r\n
    15. US SMART LABELS MARKET ANALYSIS BY REGIONAL
      1. \r\n Figure 8. CANADA SMART LABELS MARKET ANALYSIS
      2. BY TECHNOLOGY
      3. \r\n
    16. CANADA SMART LABELS MARKET ANALYSIS BY TYPE
      1. \r\n Figure 10. CANADA SMART LABELS MARKET ANALYSIS
      2. BY END USE
      3. \r\n
    17. CANADA SMART LABELS MARKET ANALYSIS BY MATERIAL
      1. \r\n Figure 12. CANADA SMART LABELS MARKET ANALYSIS
      2. BY REGIONAL
      3. \r\n
    18. EUROPE SMART LABELS MARKET ANALYSIS
      1. \r\n Figure 14. GERMANY SMART LABELS MARKET ANALYSIS BY TECHNOLOGY
      2. \r\n Figure 15. GERMANY SMART LABELS MARKET
      3. ANALYSIS BY TYPE
      4. \r\n
    19. GERMANY SMART LABELS MARKET ANALYSIS BY END USE
      1. \r\n Figure 17. GERMANY SMART LABELS MARKET
      2. ANALYSIS BY MATERIAL
      3. \r\n
    20. GERMANY SMART LABELS MARKET ANALYSIS BY REGIONAL
      1. \r\n Figure 19. UK SMART LABELS MARKET ANALYSIS
      2. BY TECHNOLOGY
      3. \r\n
    21. UK SMART LABELS MARKET ANALYSIS BY TYPE
      1. \r\n Figure 21. UK SMART LABELS MARKET ANALYSIS
      2. BY END USE
      3. \r\n
    22. UK SMART LABELS MARKET ANALYSIS BY MATERIAL
      1. \r\n Figure 23. UK SMART LABELS MARKET ANALYSIS
      2. BY REGIONAL
      3. \r\n
    23. FRANCE SMART LABELS MARKET ANALYSIS BY TECHNOLOGY
      1. \r\n Figure 25. FRANCE SMART LABELS MARKET ANALYSIS
      2. BY TYPE
      3. \r\n Figure
    24. FRANCE SMART LABELS MARKET ANALYSIS BY END USE
      1. \r\n Figure 27. FRANCE SMART LABELS MARKET ANALYSIS
      2. BY MATERIAL
      3. \r\n
    25. FRANCE SMART LABELS MARKET ANALYSIS BY REGIONAL
      1. \r\n Figure 29. RUSSIA SMART LABELS MARKET ANALYSIS
      2. BY TECHNOLOGY
      3. \r\n
    26. RUSSIA SMART LABELS MARKET ANALYSIS BY TYPE
      1. \r\n Figure 31. RUSSIA SMART LABELS MARKET ANALYSIS
      2. BY END USE
      3. \r\n
    27. RUSSIA SMART LABELS MARKET ANALYSIS BY MATERIAL
      1. \r\n Figure 33. RUSSIA SMART LABELS MARKET ANALYSIS
      2. BY REGIONAL
      3. \r\n
    28. ITALY SMART LABELS MARKET ANALYSIS BY TECHNOLOGY
      1. \r\n Figure 35. ITALY SMART LABELS MARKET ANALYSIS
      2. BY TYPE
      3. \r\n Figure
    29. ITALY SMART LABELS MARKET ANALYSIS BY END USE
      1. \r\n Figure 37. ITALY SMART LABELS MARKET ANALYSIS BY MATERIAL
      2. \r\n Figure 38. ITALY SMART LABELS MARKET ANALYSIS
      3. BY REGIONAL
      4. \r\n
    30. SPAIN SMART LABELS MARKET ANALYSIS BY TECHNOLOGY
      1. \r\n Figure 40. SPAIN SMART LABELS MARKET ANALYSIS
      2. BY TYPE
      3. \r\n Figure
    31. SPAIN SMART LABELS MARKET ANALYSIS BY END USE
      1. \r\n Figure 42. SPAIN SMART LABELS MARKET ANALYSIS BY MATERIAL
      2. \r\n Figure 43. SPAIN SMART LABELS MARKET ANALYSIS
      3. BY REGIONAL
      4. \r\n
    32. REST OF EUROPE SMART LABELS MARKET ANALYSIS BY TECHNOLOGY
      1. \r\n Figure 45. REST OF EUROPE SMART LABELS
      2. MARKET ANALYSIS BY TYPE
      3. \r\n
    33. REST OF EUROPE SMART LABELS MARKET ANALYSIS BY END USE
      1. \r\n Figure 47. REST OF EUROPE SMART LABELS
      2. MARKET ANALYSIS BY MATERIAL
      3. \r\n
    34. REST OF EUROPE SMART LABELS MARKET ANALYSIS BY REGIONAL
      1. \r\n Figure 49. APAC SMART LABELS MARKET ANALYSIS
      2. \r\n Figure 50. CHINA SMART LABELS MARKET ANALYSIS
      3. BY TECHNOLOGY
      4. \r\n
    35. CHINA SMART LABELS MARKET ANALYSIS BY TYPE
      1. \r\n Figure 52. CHINA SMART LABELS MARKET ANALYSIS
      2. BY END USE
      3. \r\n
    36. CHINA SMART LABELS MARKET ANALYSIS BY MATERIAL
      1. \r\n Figure 54. CHINA SMART LABELS MARKET ANALYSIS
      2. BY REGIONAL
      3. \r\n
    37. INDIA SMART LABELS MARKET ANALYSIS BY TECHNOLOGY
      1. \r\n Figure 56. INDIA SMART LABELS MARKET ANALYSIS
      2. BY TYPE
      3. \r\n Figure
    38. INDIA SMART LABELS MARKET ANALYSIS BY END USE
      1. \r\n Figure 58. INDIA SMART LABELS MARKET ANALYSIS BY MATERIAL
      2. \r\n Figure 59. INDIA SMART LABELS MARKET ANALYSIS
      3. BY REGIONAL
      4. \r\n
    39. JAPAN SMART LABELS MARKET ANALYSIS BY TECHNOLOGY
      1. \r\n Figure 61. JAPAN SMART LABELS MARKET ANALYSIS
      2. BY TYPE
      3. \r\n Figure
    40. JAPAN SMART LABELS MARKET ANALYSIS BY END USE
      1. \r\n Figure 63. JAPAN SMART LABELS MARKET ANALYSIS BY MATERIAL
      2. \r\n Figure 64. JAPAN SMART LABELS MARKET ANALYSIS
      3. BY REGIONAL
      4. \r\n
    41. SOUTH KOREA SMART LABELS MARKET ANALYSIS BY TECHNOLOGY
      1. \r\n Figure 66. SOUTH KOREA SMART LABELS MARKET
      2. ANALYSIS BY TYPE
      3. \r\n
    42. SOUTH KOREA SMART LABELS MARKET ANALYSIS BY END USE
      1. \r\n Figure 68. SOUTH KOREA SMART LABELS MARKET
      2. ANALYSIS BY MATERIAL
      3. \r\n
    43. SOUTH KOREA SMART LABELS MARKET ANALYSIS BY REGIONAL
      1. \r\n Figure 70. MALAYSIA SMART LABELS MARKET
      2. ANALYSIS BY TECHNOLOGY
      3. \r\n
    44. MALAYSIA SMART LABELS MARKET ANALYSIS BY TYPE
      1. \r\n Figure 72. MALAYSIA SMART LABELS MARKET
      2. ANALYSIS BY END USE
      3. \r\n
    45. MALAYSIA SMART LABELS MARKET ANALYSIS BY MATERIAL
      1. \r\n Figure 74. MALAYSIA SMART LABELS MARKET
      2. ANALYSIS BY REGIONAL
      3. \r\n
    46. THAILAND SMART LABELS MARKET ANALYSIS BY TECHNOLOGY
      1. \r\n Figure 76. THAILAND SMART LABELS MARKET
      2. ANALYSIS BY TYPE
      3. \r\n
    47. THAILAND SMART LABELS MARKET ANALYSIS BY END USE
      1. \r\n Figure 78. THAILAND SMART LABELS MARKET
      2. ANALYSIS BY MATERIAL
      3. \r\n
    48. THAILAND SMART LABELS MARKET ANALYSIS BY REGIONAL
      1. \r\n Figure 80. INDONESIA SMART LABELS MARKET
      2. ANALYSIS BY TECHNOLOGY
      3. \r\n
    49. INDONESIA SMART LABELS MARKET ANALYSIS BY TYPE
      1. \r\n Figure 82. INDONESIA SMART LABELS MARKET
      2. ANALYSIS BY END USE
      3. \r\n
    50. INDONESIA SMART LABELS MARKET ANALYSIS BY MATERIAL
      1. \r\n Figure 84. INDONESIA SMART LABELS MARKET
      2. ANALYSIS BY REGIONAL
      3. \r\n
    51. REST OF APAC SMART LABELS MARKET ANALYSIS BY TECHNOLOGY
      1. \r\n Figure 86. REST OF APAC SMART LABELS MARKET
      2. ANALYSIS BY TYPE
      3. \r\n
    52. REST OF APAC SMART LABELS MARKET ANALYSIS BY END USE
      1. \r\n Figure 88. REST OF APAC SMART LABELS MARKET
      2. ANALYSIS BY MATERIAL
      3. \r\n
    53. REST OF APAC SMART LABELS MARKET ANALYSIS BY REGIONAL
      1. \r\n Figure 90. SOUTH AMERICA SMART LABELS MARKET
      2. ANALYSIS
      3. \r\n Figure
    54. BRAZIL SMART LABELS MARKET ANALYSIS BY TECHNOLOGY
      1. \r\n Figure 92. BRAZIL SMART LABELS MARKET ANALYSIS
      2. BY TYPE
      3. \r\n Figure
    55. BRAZIL SMART LABELS MARKET ANALYSIS BY END USE
      1. \r\n Figure 94. BRAZIL SMART LABELS MARKET ANALYSIS
      2. BY MATERIAL
      3. \r\n
    56. BRAZIL SMART LABELS MARKET ANALYSIS BY REGIONAL
      1. \r\n Figure 96. MEXICO SMART LABELS MARKET ANALYSIS
      2. BY TECHNOLOGY
      3. \r\n
    57. MEXICO SMART LABELS MARKET ANALYSIS BY TYPE
      1. \r\n Figure 98. MEXICO SMART LABELS MARKET ANALYSIS
      2. BY END USE
      3. \r\n
    58. MEXICO SMART LABELS MARKET ANALYSIS BY MATERIAL
      1. \r\n Figure 100. MEXICO SMART LABELS MARKET
      2. ANALYSIS BY REGIONAL
      3. \r\n
    59. ARGENTINA SMART LABELS MARKET ANALYSIS BY TECHNOLOGY
      1. \r\n Figure 102. ARGENTINA SMART LABELS MARKET
      2. ANALYSIS BY TYPE
      3. \r\n
    60. ARGENTINA SMART LABELS MARKET ANALYSIS BY END USE
      1. \r\n Figure 104. ARGENTINA SMART LABELS MARKET
      2. ANALYSIS BY MATERIAL
      3. \r\n
    61. ARGENTINA SMART LABELS MARKET ANALYSIS BY REGIONAL
      1. \r\n Figure 106. REST OF SOUTH AMERICA SMART
      2. LABELS MARKET ANALYSIS BY TECHNOLOGY
      3. \r\n Figure 107. REST OF SOUTH AMERICA SMART LABELS MARKET ANALYSIS
      4. BY TYPE
      5. \r\n Figure
    62. REST OF SOUTH AMERICA SMART LABELS MARKET ANALYSIS BY END USE
      1. \r\n Figure 109. REST OF SOUTH AMERICA SMART
      2. LABELS MARKET ANALYSIS BY MATERIAL
      3. \r\n Figure 110. REST OF SOUTH AMERICA SMART LABELS MARKET ANALYSIS
      4. BY REGIONAL
      5. \r\n
    63. MEA SMART LABELS MARKET ANALYSIS
      1. \r\n Figure 112. GCC COUNTRIES SMART LABELS MARKET ANALYSIS BY
      2. TECHNOLOGY
      3. \r\n
    64. GCC COUNTRIES SMART LABELS MARKET ANALYSIS BY TYPE
      1. \r\n Figure 114. GCC COUNTRIES SMART LABELS
      2. MARKET ANALYSIS BY END USE
      3. \r\n
    65. GCC COUNTRIES SMART LABELS MARKET ANALYSIS BY MATERIAL
      1. \r\n Figure 116. GCC COUNTRIES SMART LABELS
      2. MARKET ANALYSIS BY REGIONAL
      3. \r\n
    66. SOUTH AFRICA SMART LABELS MARKET ANALYSIS BY TECHNOLOGY
      1. \r\n Figure 118. SOUTH AFRICA SMART LABELS MARKET
      2. ANALYSIS BY TYPE
      3. \r\n
    67. SOUTH AFRICA SMART LABELS MARKET ANALYSIS BY END USE
      1. \r\n Figure 120. SOUTH AFRICA SMART LABELS MARKET
      2. ANALYSIS BY MATERIAL
      3. \r\n
    68. SOUTH AFRICA SMART LABELS MARKET ANALYSIS BY REGIONAL
      1. \r\n Figure 122. REST OF MEA SMART LABELS MARKET
      2. ANALYSIS BY TECHNOLOGY
      3. \r\n
    69. REST OF MEA SMART LABELS MARKET ANALYSIS BY TYPE
      1. \r\n Figure 124. REST OF MEA SMART LABELS MARKET
      2. ANALYSIS BY END USE
      3. \r\n
    70. REST OF MEA SMART LABELS MARKET ANALYSIS BY MATERIAL
      1. \r\n Figure 126. REST OF MEA SMART LABELS MARKET
      2. ANALYSIS BY REGIONAL
      3. \r\n
    71. KEY BUYING CRITERIA OF SMART LABELS MARKET
      1. \r\n Figure 128. RESEARCH PROCESS OF MRFR
      2. \r\n Figure 129. DRO ANALYSIS OF SMART LABELS
      3. MARKET
      4. \r\n Figure
    72. DRIVERS IMPACT ANALYSIS: SMART LABELS MARKET
      1. \r\n Figure 131. RESTRAINTS IMPACT ANALYSIS: SMART LABELS MARKET
      2. \r\n Figure 132. SUPPLY / VALUE CHAIN: SMART
    73. LABELS MARKET
      1. \r\n
    74. SMART LABELS MARKET, BY TECHNOLOGY, 2025 (% SHARE)
    75. \r\n Figure 134. SMART LABELS MARKET, BY TECHNOLOGY,
      1. \r\n
    76. SMART LABELS MARKET, BY TYPE, 2025 (% SHARE)
    77. \r\n Figure 136. SMART LABELS MARKET, BY TYPE,
      1. \r\n
    78. SMART LABELS MARKET, BY END USE, 2025 (% SHARE)
    79. \r\n Figure 138. SMART LABELS MARKET, BY END
      1. USE, 2019 TO 2035 (USD Billions)
    80. \r\n Figure 139. SMART LABELS MARKET, BY MATERIAL, 2025 (% SHARE)
    81. \r\n Figure 140. SMART LABELS MARKET, BY MATERIAL,
      1. \r\n
    82. SMART LABELS MARKET, BY REGIONAL, 2025 (% SHARE)
    83. \r\n Figure 142. SMART LABELS MARKET, BY REGIONAL,
      1. \r\n
    84. BENCHMARKING OF MAJOR COMPETITORS
      1. \r\n

    Smart Labels Market Segmentation


    • Smart Labels Market By Technology (USD Billion, 2019-2035)

      • RFID
      • NFC
      • QR Codes
      • Printed Electronics


    • Smart Labels Market By Type (USD Billion, 2019-2035)

      • Electronic Shelf Labels
      • In-Mold Labels
      • Wearable Smart Labels


    • Smart Labels Market By End Use (USD Billion, 2019-2035)

      • Retail
      • Logistics
      • Healthcare
      • Manufacturing


    • Smart Labels Market By Material (USD Billion, 2019-2035)

      • Paper
      • Plastic
      • Metal
      • Wood


    • Smart Labels Market By Regional (USD Billion, 2019-2035)

      • North America
      • Europe
      • South America
      • Asia Pacific
      • Middle East and Africa


    Smart Labels Market Regional Outlook (USD Billion, 2019-2035)


    • North America Outlook (USD Billion, 2019-2035)

      • North America Smart Labels Market by Technology Type

        • RFID
        • NFC
        • QR Codes
        • Printed Electronics
      • North America Smart Labels Market by Type

        • Electronic Shelf Labels
        • In-Mold Labels
        • Wearable Smart Labels
      • North America Smart Labels Market by End Use Type

        • Retail
        • Logistics
        • Healthcare
        • Manufacturing
      • North America Smart Labels Market by Material Type

        • Paper
        • Plastic
        • Metal
        • Wood
      • North America Smart Labels Market by Regional Type

        • US
        • Canada
      • US Outlook (USD Billion, 2019-2035)
      • US Smart Labels Market by Technology Type

        • RFID
        • NFC
        • QR Codes
        • Printed Electronics
      • US Smart Labels Market by Type

        • Electronic Shelf Labels
        • In-Mold Labels
        • Wearable Smart Labels
      • US Smart Labels Market by End Use Type

        • Retail
        • Logistics
        • Healthcare
        • Manufacturing
      • US Smart Labels Market by Material Type

        • Paper
        • Plastic
        • Metal
        • Wood
      • CANADA Outlook (USD Billion, 2019-2035)
      • CANADA Smart Labels Market by Technology Type

        • RFID
        • NFC
        • QR Codes
        • Printed Electronics
      • CANADA Smart Labels Market by Type

        • Electronic Shelf Labels
        • In-Mold Labels
        • Wearable Smart Labels
      • CANADA Smart Labels Market by End Use Type

        • Retail
        • Logistics
        • Healthcare
        • Manufacturing
      • CANADA Smart Labels Market by Material Type

        • Paper
        • Plastic
        • Metal
        • Wood
    • Europe Outlook (USD Billion, 2019-2035)

      • Europe Smart Labels Market by Technology Type

        • RFID
        • NFC
        • QR Codes
        • Printed Electronics
      • Europe Smart Labels Market by Type

        • Electronic Shelf Labels
        • In-Mold Labels
        • Wearable Smart Labels
      • Europe Smart Labels Market by End Use Type

        • Retail
        • Logistics
        • Healthcare
        • Manufacturing
      • Europe Smart Labels Market by Material Type

        • Paper
        • Plastic
        • Metal
        • Wood
      • Europe Smart Labels Market by Regional Type

        • Germany
        • UK
        • France
        • Russia
        • Italy
        • Spain
        • Rest of Europe
      • GERMANY Outlook (USD Billion, 2019-2035)
      • GERMANY Smart Labels Market by Technology Type

        • RFID
        • NFC
        • QR Codes
        • Printed Electronics
      • GERMANY Smart Labels Market by Type

        • Electronic Shelf Labels
        • In-Mold Labels
        • Wearable Smart Labels
      • GERMANY Smart Labels Market by End Use Type

        • Retail
        • Logistics
        • Healthcare
        • Manufacturing
      • GERMANY Smart Labels Market by Material Type

        • Paper
        • Plastic
        • Metal
        • Wood
      • UK Outlook (USD Billion, 2019-2035)
      • UK Smart Labels Market by Technology Type

        • RFID
        • NFC
        • QR Codes
        • Printed Electronics
      • UK Smart Labels Market by Type

        • Electronic Shelf Labels
        • In-Mold Labels
        • Wearable Smart Labels
      • UK Smart Labels Market by End Use Type

        • Retail
        • Logistics
        • Healthcare
        • Manufacturing
      • UK Smart Labels Market by Material Type

        • Paper
        • Plastic
        • Metal
        • Wood
      • FRANCE Outlook (USD Billion, 2019-2035)
      • FRANCE Smart Labels Market by Technology Type

        • RFID
        • NFC
        • QR Codes
        • Printed Electronics
      • FRANCE Smart Labels Market by Type

        • Electronic Shelf Labels
        • In-Mold Labels
        • Wearable Smart Labels
      • FRANCE Smart Labels Market by End Use Type

        • Retail
        • Logistics
        • Healthcare
        • Manufacturing
      • FRANCE Smart Labels Market by Material Type

        • Paper
        • Plastic
        • Metal
        • Wood
      • RUSSIA Outlook (USD Billion, 2019-2035)
      • RUSSIA Smart Labels Market by Technology Type

        • RFID
        • NFC
        • QR Codes
        • Printed Electronics
      • RUSSIA Smart Labels Market by Type

        • Electronic Shelf Labels
        • In-Mold Labels
        • Wearable Smart Labels
      • RUSSIA Smart Labels Market by End Use Type

        • Retail
        • Logistics
        • Healthcare
        • Manufacturing
      • RUSSIA Smart Labels Market by Material Type

        • Paper
        • Plastic
        • Metal
        • Wood
      • ITALY Outlook (USD Billion, 2019-2035)
      • ITALY Smart Labels Market by Technology Type

        • RFID
        • NFC
        • QR Codes
        • Printed Electronics
      • ITALY Smart Labels Market by Type

        • Electronic Shelf Labels
        • In-Mold Labels
        • Wearable Smart Labels
      • ITALY Smart Labels Market by End Use Type

        • Retail
        • Logistics
        • Healthcare
        • Manufacturing
      • ITALY Smart Labels Market by Material Type

        • Paper
        • Plastic
        • Metal
        • Wood
      • SPAIN Outlook (USD Billion, 2019-2035)
      • SPAIN Smart Labels Market by Technology Type

        • RFID
        • NFC
        • QR Codes
        • Printed Electronics
      • SPAIN Smart Labels Market by Type

        • Electronic Shelf Labels
        • In-Mold Labels
        • Wearable Smart Labels
      • SPAIN Smart Labels Market by End Use Type

        • Retail
        • Logistics
        • Healthcare
        • Manufacturing
      • SPAIN Smart Labels Market by Material Type

        • Paper
        • Plastic
        • Metal
        • Wood
      • REST OF EUROPE Outlook (USD Billion, 2019-2035)
      • REST OF EUROPE Smart Labels Market by Technology Type

        • RFID
        • NFC
        • QR Codes
        • Printed Electronics
      • REST OF EUROPE Smart Labels Market by Type

        • Electronic Shelf Labels
        • In-Mold Labels
        • Wearable Smart Labels
      • REST OF EUROPE Smart Labels Market by End Use Type

        • Retail
        • Logistics
        • Healthcare
        • Manufacturing
      • REST OF EUROPE Smart Labels Market by Material Type

        • Paper
        • Plastic
        • Metal
        • Wood
    • APAC Outlook (USD Billion, 2019-2035)

      • APAC Smart Labels Market by Technology Type

        • RFID
        • NFC
        • QR Codes
        • Printed Electronics
      • APAC Smart Labels Market by Type

        • Electronic Shelf Labels
        • In-Mold Labels
        • Wearable Smart Labels
      • APAC Smart Labels Market by End Use Type

        • Retail
        • Logistics
        • Healthcare
        • Manufacturing
      • APAC Smart Labels Market by Material Type

        • Paper
        • Plastic
        • Metal
        • Wood
      • APAC Smart Labels Market by Regional Type

        • China
        • India
        • Japan
        • South Korea
        • Malaysia
        • Thailand
        • Indonesia
        • Rest of APAC
      • CHINA Outlook (USD Billion, 2019-2035)
      • CHINA Smart Labels Market by Technology Type

        • RFID
        • NFC
        • QR Codes
        • Printed Electronics
      • CHINA Smart Labels Market by Type

        • Electronic Shelf Labels
        • In-Mold Labels
        • Wearable Smart Labels
      • CHINA Smart Labels Market by End Use Type

        • Retail
        • Logistics
        • Healthcare
        • Manufacturing
      • CHINA Smart Labels Market by Material Type

        • Paper
        • Plastic
        • Metal
        • Wood
      • INDIA Outlook (USD Billion, 2019-2035)
      • INDIA Smart Labels Market by Technology Type

        • RFID
        • NFC
        • QR Codes
        • Printed Electronics
      • INDIA Smart Labels Market by Type

        • Electronic Shelf Labels
        • In-Mold Labels
        • Wearable Smart Labels
      • INDIA Smart Labels Market by End Use Type

        • Retail
        • Logistics
        • Healthcare
        • Manufacturing
      • INDIA Smart Labels Market by Material Type

        • Paper
        • Plastic
        • Metal
        • Wood
      • JAPAN Outlook (USD Billion, 2019-2035)
      • JAPAN Smart Labels Market by Technology Type

        • RFID
        • NFC
        • QR Codes
        • Printed Electronics
      • JAPAN Smart Labels Market by Type

        • Electronic Shelf Labels
        • In-Mold Labels
        • Wearable Smart Labels
      • JAPAN Smart Labels Market by End Use Type

        • Retail
        • Logistics
        • Healthcare
        • Manufacturing
      • JAPAN Smart Labels Market by Material Type

        • Paper
        • Plastic
        • Metal
        • Wood
      • SOUTH KOREA Outlook (USD Billion, 2019-2035)
      • SOUTH KOREA Smart Labels Market by Technology Type

        • RFID
        • NFC
        • QR Codes
        • Printed Electronics
      • SOUTH KOREA Smart Labels Market by Type

        • Electronic Shelf Labels
        • In-Mold Labels
        • Wearable Smart Labels
      • SOUTH KOREA Smart Labels Market by End Use Type

        • Retail
        • Logistics
        • Healthcare
        • Manufacturing
      • SOUTH KOREA Smart Labels Market by Material Type

        • Paper
        • Plastic
        • Metal
        • Wood
      • MALAYSIA Outlook (USD Billion, 2019-2035)
      • MALAYSIA Smart Labels Market by Technology Type

        • RFID
        • NFC
        • QR Codes
        • Printed Electronics
      • MALAYSIA Smart Labels Market by Type

        • Electronic Shelf Labels
        • In-Mold Labels
        • Wearable Smart Labels
      • MALAYSIA Smart Labels Market by End Use Type

        • Retail
        • Logistics
        • Healthcare
        • Manufacturing
      • MALAYSIA Smart Labels Market by Material Type

        • Paper
        • Plastic
        • Metal
        • Wood
      • THAILAND Outlook (USD Billion, 2019-2035)
      • THAILAND Smart Labels Market by Technology Type

        • RFID
        • NFC
        • QR Codes
        • Printed Electronics
      • THAILAND Smart Labels Market by Type

        • Electronic Shelf Labels
        • In-Mold Labels
        • Wearable Smart Labels
      • THAILAND Smart Labels Market by End Use Type

        • Retail
        • Logistics
        • Healthcare
        • Manufacturing
      • THAILAND Smart Labels Market by Material Type

        • Paper
        • Plastic
        • Metal
        • Wood
      • INDONESIA Outlook (USD Billion, 2019-2035)
      • INDONESIA Smart Labels Market by Technology Type

        • RFID
        • NFC
        • QR Codes
        • Printed Electronics
      • INDONESIA Smart Labels Market by Type

        • Electronic Shelf Labels
        • In-Mold Labels
        • Wearable Smart Labels
      • INDONESIA Smart Labels Market by End Use Type

        • Retail
        • Logistics
        • Healthcare
        • Manufacturing
      • INDONESIA Smart Labels Market by Material Type

        • Paper
        • Plastic
        • Metal
        • Wood
      • REST OF APAC Outlook (USD Billion, 2019-2035)
      • REST OF APAC Smart Labels Market by Technology Type

        • RFID
        • NFC
        • QR Codes
        • Printed Electronics
      • REST OF APAC Smart Labels Market by Type

        • Electronic Shelf Labels
        • In-Mold Labels
        • Wearable Smart Labels
      • REST OF APAC Smart Labels Market by End Use Type

        • Retail
        • Logistics
        • Healthcare
        • Manufacturing
      • REST OF APAC Smart Labels Market by Material Type

        • Paper
        • Plastic
        • Metal
        • Wood
    • South America Outlook (USD Billion, 2019-2035)

      • South America Smart Labels Market by Technology Type

        • RFID
        • NFC
        • QR Codes
        • Printed Electronics
      • South America Smart Labels Market by Type

        • Electronic Shelf Labels
        • In-Mold Labels
        • Wearable Smart Labels
      • South America Smart Labels Market by End Use Type

        • Retail
        • Logistics
        • Healthcare
        • Manufacturing
      • South America Smart Labels Market by Material Type

        • Paper
        • Plastic
        • Metal
        • Wood
      • South America Smart Labels Market by Regional Type

        • Brazil
        • Mexico
        • Argentina
        • Rest of South America
      • BRAZIL Outlook (USD Billion, 2019-2035)
      • BRAZIL Smart Labels Market by Technology Type

        • RFID
        • NFC
        • QR Codes
        • Printed Electronics
      • BRAZIL Smart Labels Market by Type

        • Electronic Shelf Labels
        • In-Mold Labels
        • Wearable Smart Labels
      • BRAZIL Smart Labels Market by End Use Type

        • Retail
        • Logistics
        • Healthcare
        • Manufacturing
      • BRAZIL Smart Labels Market by Material Type

        • Paper
        • Plastic
        • Metal
        • Wood
      • MEXICO Outlook (USD Billion, 2019-2035)
      • MEXICO Smart Labels Market by Technology Type

        • RFID
        • NFC
        • QR Codes
        • Printed Electronics
      • MEXICO Smart Labels Market by Type

        • Electronic Shelf Labels
        • In-Mold Labels
        • Wearable Smart Labels
      • MEXICO Smart Labels Market by End Use Type

        • Retail
        • Logistics
        • Healthcare
        • Manufacturing
      • MEXICO Smart Labels Market by Material Type

        • Paper
        • Plastic
        • Metal
        • Wood
      • ARGENTINA Outlook (USD Billion, 2019-2035)
      • ARGENTINA Smart Labels Market by Technology Type

        • RFID
        • NFC
        • QR Codes
        • Printed Electronics
      • ARGENTINA Smart Labels Market by Type

        • Electronic Shelf Labels
        • In-Mold Labels
        • Wearable Smart Labels
      • ARGENTINA Smart Labels Market by End Use Type

        • Retail
        • Logistics
        • Healthcare
        • Manufacturing
      • ARGENTINA Smart Labels Market by Material Type

        • Paper
        • Plastic
        • Metal
        • Wood
      • REST OF SOUTH AMERICA Outlook (USD Billion, 2019-2035)
      • REST OF SOUTH AMERICA Smart Labels Market by Technology Type

        • RFID
        • NFC
        • QR Codes
        • Printed Electronics
      • REST OF SOUTH AMERICA Smart Labels Market by Type

        • Electronic Shelf Labels
        • In-Mold Labels
        • Wearable Smart Labels
      • REST OF SOUTH AMERICA Smart Labels Market by End Use Type

        • Retail
        • Logistics
        • Healthcare
        • Manufacturing
      • REST OF SOUTH AMERICA Smart Labels Market by Material Type

        • Paper
        • Plastic
        • Metal
        • Wood
    • MEA Outlook (USD Billion, 2019-2035)

      • MEA Smart Labels Market by Technology Type

        • RFID
        • NFC
        • QR Codes
        • Printed Electronics
      • MEA Smart Labels Market by Type

        • Electronic Shelf Labels
        • In-Mold Labels
        • Wearable Smart Labels
      • MEA Smart Labels Market by End Use Type

        • Retail
        • Logistics
        • Healthcare
        • Manufacturing
      • MEA Smart Labels Market by Material Type

        • Paper
        • Plastic
        • Metal
        • Wood
      • MEA Smart Labels Market by Regional Type

        • GCC Countries
        • South Africa
        • Rest of MEA
      • GCC COUNTRIES Outlook (USD Billion, 2019-2035)
      • GCC COUNTRIES Smart Labels Market by Technology Type

        • RFID
        • NFC
        • QR Codes
        • Printed Electronics
      • GCC COUNTRIES Smart Labels Market by Type

        • Electronic Shelf Labels
        • In-Mold Labels
        • Wearable Smart Labels
      • GCC COUNTRIES Smart Labels Market by End Use Type

        • Retail
        • Logistics
        • Healthcare
        • Manufacturing
      • GCC COUNTRIES Smart Labels Market by Material Type

        • Paper
        • Plastic
        • Metal
        • Wood
      • SOUTH AFRICA Outlook (USD Billion, 2019-2035)
      • SOUTH AFRICA Smart Labels Market by Technology Type

        • RFID
        • NFC
        • QR Codes
        • Printed Electronics
      • SOUTH AFRICA Smart Labels Market by Type

        • Electronic Shelf Labels
        • In-Mold Labels
        • Wearable Smart Labels
      • SOUTH AFRICA Smart Labels Market by End Use Type

        • Retail
        • Logistics
        • Healthcare
        • Manufacturing
      • SOUTH AFRICA Smart Labels Market by Material Type

        • Paper
        • Plastic
        • Metal
        • Wood
      • REST OF MEA Outlook (USD Billion, 2019-2035)
      • REST OF MEA Smart Labels Market by Technology Type

        • RFID
        • NFC
        • QR Codes
        • Printed Electronics
      • REST OF MEA Smart Labels Market by Type

        • Electronic Shelf Labels
        • In-Mold Labels
        • Wearable Smart Labels
      • REST OF MEA Smart Labels Market by End Use Type

        • Retail
        • Logistics
        • Healthcare
        • Manufacturing
      • REST OF MEA Smart Labels Market by Material Type

        • Paper
        • Plastic
        • Metal
        • Wood


    Infographic

    Free Sample Request

    Kindly complete the form below to receive a free sample of this Report

    Get Free Sample

    Customer Strories

    “I am very pleased with how market segments have been defined in a relevant way for my purposes (such as "Portable Freezers & refrigerators" and "last-mile"). In general the report is well structured. Thanks very much for your efforts.”

    Victoria Milne

    Founder
    Case Study
    Chemicals and Materials