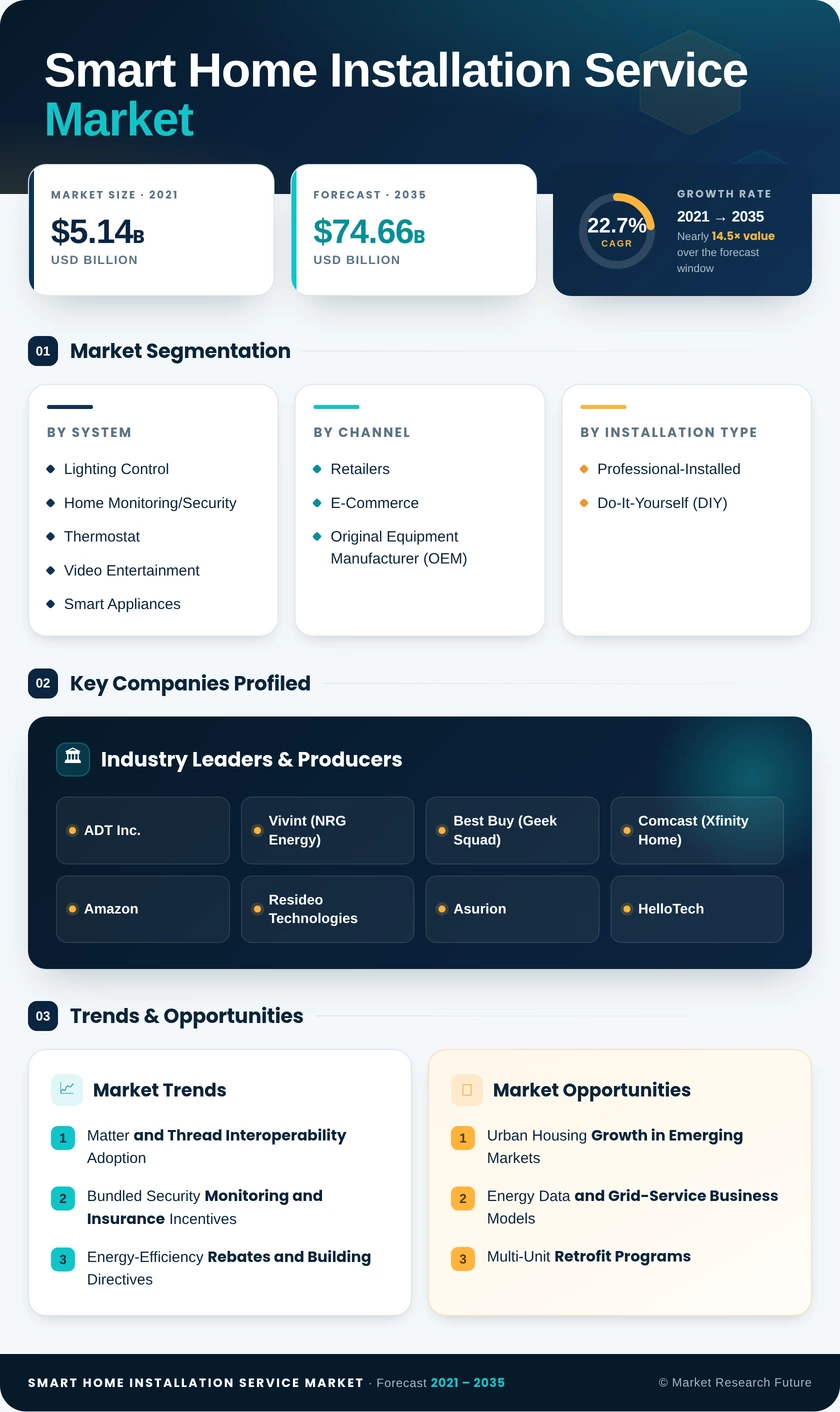
Smart Home Installation Service Market (2026 - 2035)

ID: MRFR/ICT/26380-HCR 128 Pages Ankit Gupta Last Updated: October 15, 2026
Smart Home Installation Service Market Size, Share and Research Report By System (Lighting Control, Home Monitoring/Security, Thermostat, Video Entertainment, Smart Appliances, Other Systems), By Channel (Retailers, E-Commerce, Original Equipment Manufacturer (OEM)), By Installation Type (Professional-Installed, Do-It-Yourself (DIY)), By Customer Type (Residential, Commercial/Small Business), By Dwelling Type (Single-Family Homes, Multi-Unit Dwellings, New-Build Constructions, Retrofit Projects), By Connectivity Standard (Wi-Fi, Zigbee, Z-Wave, Thread, Bluetooth Mesh) and By Regional (North America, Europe, South America, Asia Pacific, Middle East and Africa) - Industry Forecast to 2035.
Smart Home Installation Service Market
Market Size
Forecast Period2026-2035
CAGR (2026-2035)22.7%
2025 Market SizeUSD 9.62 Billion
2035 Market SizeUSD 74.66 Billion
Key Players
ADT Inc.
Vivint
Best Buy
Comcast
Amazon
Resideo Technologies
Opportunities
  • Urban Housing Growth in Emerging Markets
  • Energy Data and Grid-Service Business Models
  • Multi-Unit Retrofit Programs
  1. 1 Market Summary | |
  2. 2 Key Report Takeaways | |
    1. 2.1 By System | |
    2. 2.2 By Channel | |
    3. 2.3 By Installation Type | |
    4. 2.4 By Customer Type | |
    5. 2.5 By Dwelling Type | |
    6. 2.6 By Connectivity Standard | |
    7. 2.7 By Region | |
  3. 3 Market Size and Forecast (2021–2035) | |
    1. 3.1 Historical Market Size (2021–2025) | |
    2. 3.2 Forecast Market Size (2026–2035) | |
    3. 3.3 Year-over-Year Growth Analysis | |
  4. 4 Driver Impact Analysis | |
    1. 4.1 Matter and Thread Interoperability Adoption | |
    2. 4.2 Bundled Security Monitoring and Insurance Incentives | |
    3. 4.3 Energy-Efficiency Rebates and Building Directives | |
    4. 4.4 Connected Appliance Commissioning | |
    5. 4.5 Aging-in-Place and Remote Care Demand | |
    6. 4.6 Builder-Integrated Packages in New Construction | |
    7. 4.7 Retail and Online Bundled Installation Offers | |
  5. 5 Restraints Impact Analysis | |
    1. 5.1 Shortage of Skilled Low-Voltage Technicians | |
    2. 5.2 Data Privacy and Cybersecurity Compliance Costs | |
    3. 5.3 Upfront Cost Sensitivity in Emerging Economies | |
    4. 5.4 Legacy Protocol Fragmentation | |
    5. 5.5 Marketplace Commission and DIY Price Pressure | |
  6. 6 Opportunities | |
    1. 6.1 Urban Housing Growth in Emerging Markets | |
    2. 6.2 Energy Data and Grid-Service Business Models | |
    3. 6.3 Multi-Unit Retrofit Programs | |
    4. 6.4 Managed Aging-in-Place Services | |
    5. 6.5 Commercial and Small Business Fit-Outs | |
  7. 7 Regional Market Share and Country-Level Analysis | |
    1. 7.1 North America | | |
      1. 7.1.1 United States | | |
      2. 7.1.2 Canada | | |
      3. 7.1.3 Mexico | |
    2. 7.2 South America | | |
      1. 7.2.1 Brazil | | |
      2. 7.2.2 Argentina | | |
      3. 7.2.3 Rest of South America | |
    3. 7.3 Europe | | |
      1. 7.3.1 Germany | | |
      2. 7.3.2 United Kingdom | | |
      3. 7.3.3 France | | |
      4. 7.3.4 Italy | | |
      5. 7.3.5 Spain | | |
      6. 7.3.6 Rest of Europe | |
    4. 7.4 Asia Pacific | | |
      1. 7.4.1 China | | |
      2. 7.4.2 Japan | | |
      3. 7.4.3 India | | |
      4. 7.4.4 South Korea | | |
      5. 7.4.5 Rest of Asia Pacific | |
    5. 7.5 Middle East and Africa | | |
      1. 7.5.1 Middle East | | |
      2. 7.5.2 Saudi Arabia | | |
      3. 7.5.3 United Arab Emirates | | |
      4. 7.5.4 Turkey | | |
      5. 7.5.5 Rest of Middle East | | |
      6. 7.5.6 Africa | | |
      7. 7.5.7 South Africa | | |
      8. 7.5.8 Nigeria | | |
      9. 7.5.9 Kenya | | |
      10. 7.5.10 Rest of Africa | |
  8. 8 Future Outlook (2026–2035) | |
    1. 8.1 AI-Assisted Diagnostics and Remote Commissioning | |
    2. 8.2 Grid-Interactive Homes and Energy Management | |
    3. 8.3 Subscription Platforms and Recurring Revenue | |
    4. 8.4 Security Labeling and Trust as Differentiators | |
  9. 9 Segmentation Analysis | |
    1. 9.1 By System | | |
      1. 9.1.1 Lighting Control | | |
      2. 9.1.2 Home Monitoring/Security | | |
      3. 9.1.3 Thermostat | | |
      4. 9.1.4 Video Entertainment | | |
      5. 9.1.5 Smart Appliances | | |
      6. 9.1.6 Other Systems | |
    2. 9.2 By Channel | | |
      1. 9.2.1 Retailers | | |
      2. 9.2.2 E-Commerce | | |
      3. 9.2.3 Original Equipment Manufacturer (OEM) | |
    3. 9.3 By Installation Type | | |
      1. 9.3.1 Professional-Installed | | |
      2. 9.3.2 Do-It-Yourself (DIY) | |
    4. 9.4 By Customer Type | | |
      1. 9.4.1 Residential | | |
      2. 9.4.2 Commercial/Small Business | |
    5. 9.5 By Dwelling Type | | |
      1. 9.5.1 Single-Family Homes | | |
      2. 9.5.2 Multi-Unit Dwellings | | |
      3. 9.5.3 New-Build Constructions | | |
      4. 9.5.4 Retrofit Projects | |
    6. 9.6 By Connectivity Standard | | |
      1. 9.6.1 Wi-Fi | | |
      2. 9.6.2 Zigbee | | |
      3. 9.6.3 Z-Wave | | |
      4. 9.6.4 Thread | | |
      5. 9.6.5 Bluetooth Mesh | |
  10. 10 Competitive Landscape | |
    1. 10.1 Market Concentration Analysis | |
    2. 10.2 Competitive Benchmarking Matrix | |
    3. 10.3 Company Profiles | | |
      1. 10.3.1 ADT Inc. | | |
      2. 10.3.2 Vivint (NRG Energy) | | |
      3. 10.3.3 Best Buy (Geek Squad) | | |
      4. 10.3.4 Comcast (Xfinity Home) | | |
      5. 10.3.5 Amazon | | |
      6. 10.3.6 Resideo Technologies | | |
      7. 10.3.7 Asurion | | |
      8. 10.3.8 HelloTech | | |
      9. 10.3.9 Angi | | |
      10. 10.3.10 Brinks Home | | |
      11. 10.3.11 Vector Security | |
  11. 11 Recent News & Developments | |
  12. 12 Report Scope and Methodology | |
  13. 13 Detailed Sources and Citations | |
  14. 14 Frequently Asked Questions (FAQs) | | LIST OF TABLES | |
  15. TABLE 1 Market Snapshot, 2025–2035 | |
  16. TABLE 2 Global Market Size & Forecast, by Revenue (USD Billion), 2021–2035 | |
  17. TABLE 3 Driver Impact Analysis, 2026–2035 | |
  18. TABLE 4 Restraints Impact Analysis, 2026–2035 | |
  19. TABLE 5 Regional Summary, 2025 | |
  20. TABLE 6 North America Market, by Country, 2025 | |
  21. TABLE 7 South America Market, by Country, 2025 | |
  22. TABLE 8 Europe Market, by Country, 2025 | |
  23. TABLE 9 Asia Pacific Market, by Country, 2025 | |
  24. TABLE 10 Middle East and Africa Market, by Country, 2025 | |
  25. TABLE 11 Market Segmentation, by System, 2025 | |
  26. TABLE 12 Market Segmentation, by Channel, 2025 | |
  27. TABLE 13 Market Segmentation, by Installation Type, 2025 | |
  28. TABLE 14 Market Segmentation, by Customer Type, 2025 | |
  29. TABLE 15 Market Segmentation, by Dwelling Type, 2025 | |
  30. TABLE 16 Market Segmentation, by Connectivity Standard, 2025 | |
  31. TABLE 17 Competitive Benchmarking Matrix, 2025 | |
  32. TABLE 18 Report Scope and Methodology | |
  33. TABLE 19 Detailed Sources and Citations | |
  34. TABLE 20 Segmentation Quick Reference | | LIST OF FIGURES | |
  35. FIGURE 1 Market Dynamics Overview (Drivers, Restraints, Opportunities) | |
  36. FIGURE 2 Industry Value Chain Analysis | |
  37. FIGURE 3 Porter's Five Forces Analysis | |
  38. FIGURE 4 Global Market Size Trend, 2021–2035 (USD Billion) | |
  39. FIGURE 5 Year-over-Year Growth Trend, 2022–2035 | |
  40. FIGURE 6 Market Share by System, 2025 | |
  41. FIGURE 7 Market Share by Channel, 2025 | |
  42. FIGURE 8 Market Share by Installation Type, 2025 | |
  43. FIGURE 9 Market Share by Customer Type, 2025 | |
  44. FIGURE 10 Market Share by Dwelling Type, 2025 | |
  45. FIGURE 11 Market Share by Connectivity Standard, 2025 | |
  46. FIGURE 12 Regional Market Share, 2025 | |
  47. FIGURE 13 Regional Growth Comparison, 2026–2035 | |
  48. FIGURE 14 Competitive Landscape: Estimated Revenue Share Ranges, 2025

Segmentation Quick Reference

DimensionSub-SegmentsDominant SegmentFastest Growing Segment
By SystemLighting Control, Home Monitoring/Security, Thermostat, Video Entertainment, Smart Appliances, Other SystemsHome Monitoring/Security (42.6% share)Smart Appliances (24.3% CAGR)
By ChannelRetailers, E-Commerce, Original Equipment Manufacturer (OEM)Retailers (48.0% share)E-Commerce (23.1% CAGR)
By Installation TypeProfessional-Installed, Do-It-Yourself (DIY)Professional-Installed (65.6% share)Do-It-Yourself (DIY) (26.6% CAGR)
By Customer TypeResidential, Commercial/Small BusinessResidential (77.9% share)Commercial/Small Business (24.8% CAGR)
By Dwelling TypeSingle-Family Homes, Multi-Unit Dwellings, New-Build Constructions, Retrofit ProjectsSingle-Family Homes (58.4% share)Multi-Unit Dwellings (25.4% CAGR)
By Connectivity StandardWi-Fi, Zigbee, Z-Wave, Thread, Bluetooth MeshWi-Fi (46.3% share)Thread (27.9% CAGR)
By RegionNorth America, South America, Europe, Asia Pacific, Middle East and AfricaNorth America (38.5% share)Asia Pacific (26.1% CAGR)

Market Segmentation Overview

By System

Sub-SegmentKey Trend
Lighting ControlScene programming tied to occupancy and daylight sensing
Home Monitoring/SecurityAI-enabled cameras bundled with monitoring contracts
ThermostatRebate-funded installs linked to heat pump controls
Video EntertainmentWhole-home audio and premium media room integration
Smart AppliancesMatter-certified appliances requiring commissioning
Other SystemsLeak detection, motorized shades, and access control

Home Monitoring/Security leads at 42.6% share because monitoring contracts finance installation and make security the first system most households buy. Smart Appliances grows fastest at a 24.3% CAGR as Matter 1.2 brought refrigerators, washers, and dishwashers into a common commissioning workflow. Installers that start with security often return to add lighting control and appliances, so the leading and fastest segments reinforce each other.

By Channel

Sub-SegmentKey Trend
RetailersIn-store demonstrations converted into same-day bookings
E-CommerceFixed-price installation attached at online checkout
Original Equipment Manufacturer (OEM)Vertically integrated hardware, installation, and monitoring

Retailers hold a 48.0% share because advisors and financing at the point of sale turn device shoppers into installation customers. E-Commerce grows fastest at a 23.1% CAGR, as marketplaces publish installation prices upfront and guarantee arrival windows. Original Equipment Manufacturer (OEM) channels remain strong where security and appliance brands control the full service chain.

By Installation Type

Sub-SegmentKey Trend
Professional-InstalledDesign, network optimization, and maintenance subscriptions
Do-It-Yourself (DIY)QR-code onboarding and adhesive-mount hardware

Professional-Installed services lead with a 65.6% share because structured wiring and multi-vendor integration exceed typical homeowner skills. Do-It-Yourself (DIY) grows faster at a 26.6% CAGR as app-guided setup makes doorbells and plugs simple to install. DIY buyers frequently graduate to professional projects, which keeps demand for paid design and programming intact.

By Customer Type

Sub-SegmentKey Trend
ResidentialSafety, energy savings, and voice-assistant convenience
Commercial/Small BusinessAccess control and energy monitoring at small-site pricing

Residential customers account for a 77.9% share, driven by security and comfort upgrades in owner-occupied homes. Commercial/Small Business grows fastest at a 24.8% CAGR as shops and clinics seek access control and energy monitoring without enterprise integrator costs. Residential installers adding commercial tiers lift average ticket sizes and gain service-level contracts.

By Dwelling Type

Sub-SegmentKey Trend
Single-Family HomesOwner-funded whole-home system installations
Multi-Unit DwellingsPortfolio-wide landlord platforms installed at turnover
New-Build ConstructionsBuilder pre-wiring and handover commissioning
Retrofit ProjectsRoom-by-room upgrades in aging housing stock

Single-Family Homes lead with a 58.4% share because owners control their property and invest in multi-system projects. Multi-Unit Dwellings grow fastest at a 25.4% CAGR as landlords standardize keyless entry, thermostats, and leak detection across portfolios. New-Build Constructions and Retrofit Projects divide the remaining work between builder contracts and upgrades to existing homes.

By Connectivity Standard

Sub-SegmentKey Trend
Wi-FiDefault transport for cameras and video doorbells
ZigbeeInstalled base in lighting and sensor ecosystems
Z-WavePersistence in legacy security panels and locks
ThreadLow-power mesh backed by Matter certification
Bluetooth MeshGrowing use in lighting fixtures and smart locks

Wi-Fi leads with a 46.3% share because cameras, doorbells, and streaming devices need its bandwidth. Thread grows fastest at a 27.9% CAGR as Matter-certified devices and hub-embedded border routers simplify mesh networks for installers. Zigbee and Z-Wave remain in legacy panels, so technicians must bridge older protocols while migrating households toward Thread.


Download PDF ×

We do not share your information with anyone. However, we may send you emails based on your report interest from time to time. You may contact us at any time to opt-out.