Small Molecule API Market (2026 - 2035)

ID: MRFR/HC/0279-CR 200 Pages Rahul Gotadki Last Updated: November 12, 2026
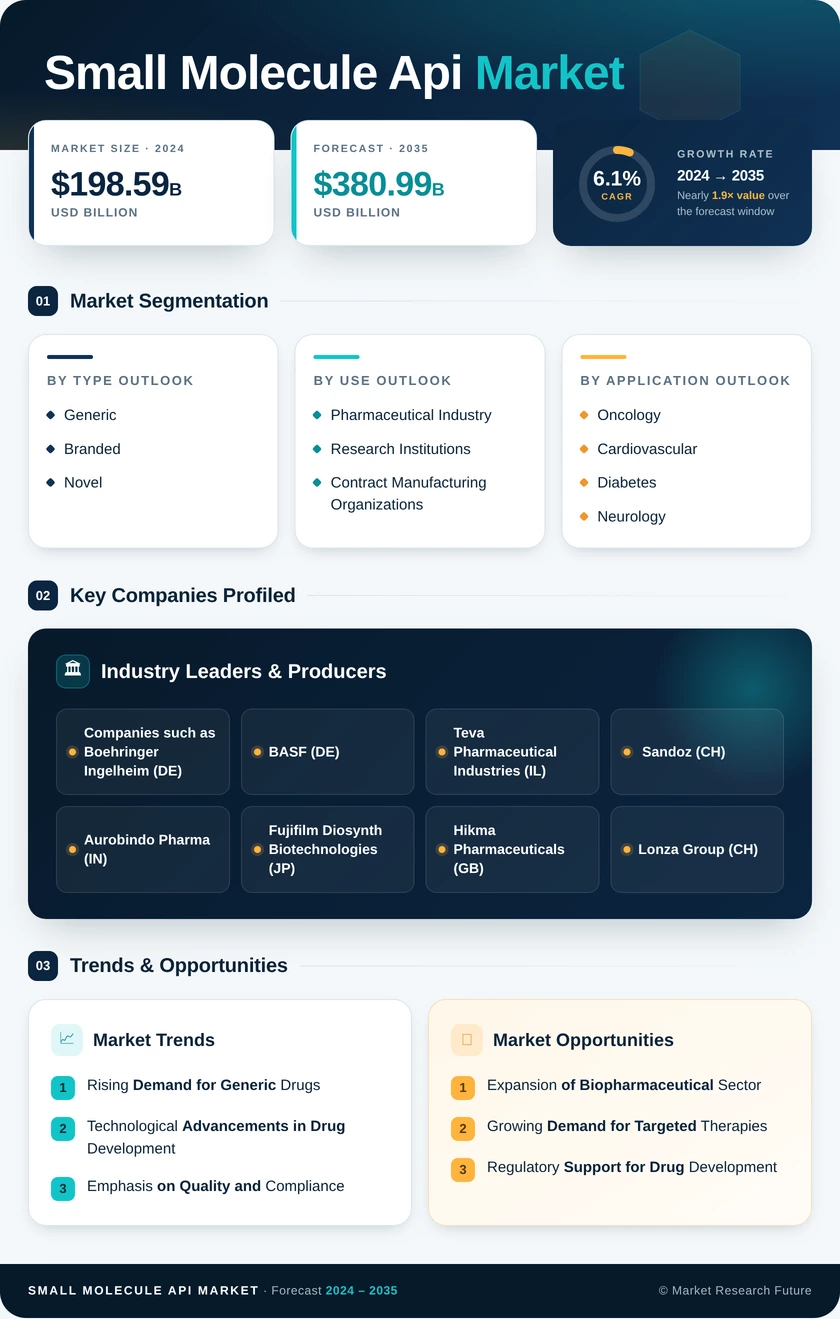
Small Molecule API Market Research Report: Size, Share, Trend Analysis By Applications (Oncology, Cardiovascular, Diabetes, Neurology), By Types (Generic, Branded, Novel), By Formulation (Oral, Injectable, Topical, Inhalation), By End Use (Pharmaceutical Industry, Research Institutions, Contract Manufacturing Organizations) and By Regional (North America, Europe, South America, Asia Pacific, Middle East and Africa) - Growth Outlook & Industry Forecast 2025 To 2035
Small Molecule API Market
Market Size
Forecast Period2026-2035
CAGR (2026-2035)6.92%
2025 Market SizeUSD 160.24 Billion
2035 Market SizeUSD 335.86 Billion
Key Players
Lonza Group AG
Teva API
Dr. Reddy's Laboratories
Aurobindo Pharma
Sun Pharmaceutical Industries
Divi's Laboratories
Opportunities
  • Friend-Shored Regulated-Market Capacity
  • Peptide and Oligonucleotide Substance Capability
  • Emerging-Market Domestic Substance Manufacturing
  1. 1 Market Summary | |
    1. 1.1 Study Assumptions & Market Definition | |
    2. 1.2 Scope of the Study | |
    3. 1.3 Research Methodology | |
  2. 2 Key Report Takeaways | |
    1. 2.1 By Therapeutic Area | |
    2. 2.2 By Region | |
  3. 3 Market Size and Forecast (2021–2035) | |
    1. 3.1 Historical Market Size (2021–2025) | |
    2. 3.2 Current & Forecast Market Size (2026–2035) | |
    3. 3.3 Year-over-Year Growth Analysis | |
  4. 4 Driver Impact Analysis | |
    1. 4.1 Chronic Disease and Oncology Burden | |
    2. 4.2 Loss of Exclusivity and Generic Conversion | |
    3. 4.3 CDMO Outsourcing by Biotech Sponsors | |
    4. 4.4 Government Reshoring Incentives | |
    5. 4.5 Continuous Manufacturing Adoption | |
    6. 4.6 Emerging-Market Access Expansion | |
    7. 4.7 Complex Generics and Peptide Chemistry | |
  5. 5 Restraints Impact Analysis | |
    1. 5.1 Nitrosamine and Impurity Control Tightening | |
    2. 5.2 Key Starting Material Concentration Risk | |
    3. 5.3 Price Erosion in Mature Generics | |
    4. 5.4 Environmental Compliance and Solvent Cost | |
    5. 5.5 Regulatory Inspection Backlogs | |
  6. 6 Opportunities | |
    1. 6.1 Friend-Shored Regulated-Market Capacity | |
    2. 6.2 Peptide and Oligonucleotide Substance Capability | |
    3. 6.3 Emerging-Market Domestic Substance Manufacturing | |
    4. 6.4 Process Data and Quality Analytics as a Commercial Service | |
    5. 6.5 Biocatalysis and Green Chemistry Route Redesign | |
  7. 7 Regional Market Share and Country-Level Analysis | |
    1. 7.1 Asia-Pacific | | |
      1. 7.1.1 China | | |
      2. 7.1.2 India | | |
      3. 7.1.3 Japan | | |
      4. 7.1.4 South Korea | | |
      5. 7.1.5 ASEAN | | |
      6. 7.1.6 Rest of Asia-Pacific | |
    2. 7.2 Europe | | |
      1. 7.2.1 Germany | | |
      2. 7.2.2 UK | | |
      3. 7.2.3 France | | |
      4. 7.2.4 Italy | | |
      5. 7.2.5 Spain | | |
      6. 7.2.6 Nordic Countries | | |
      7. 7.2.7 Russia | | |
      8. 7.2.8 Rest of Europe | |
    3. 7.3 North America | | |
      1. 7.3.1 US | | |
      2. 7.3.2 Canada | | |
      3. 7.3.3 Mexico | |
    4. 7.4 South America | | |
      1. 7.4.1 Brazil | | |
      2. 7.4.2 Argentina | | |
      3. 7.4.3 Rest of South America | |
    5. 7.5 Middle East & Africa | | |
      1. 7.5.1 Saudi Arabia | | |
      2. 7.5.2 UAE | | |
      3. 7.5.3 South Africa | | |
      4. 7.5.4 Egypt | | |
      5. 7.5.5 Rest of MEA | |
  8. 8 Future Outlook (2026–2035) | |
    1. 8.1 Process Intensification and Continuous Flow | |
    2. 8.2 Machine Learning in Route Design and Impurity Prediction | |
    3. 8.3 Supply Chain Regionalization | |
    4. 8.4 Sustainability Metrics as Procurement Criteria | |
  9. 9 Segmentation Analysis | |
    1. 9.1 By Therapeutic Area | | |
      1. 9.1.1 Oncology | | |
      2. 9.1.2 Cardiovascular Diseases | | |
      3. 9.1.3 Central Nervous System and Neurology | | |
      4. 9.1.4 Infectious Diseases | | |
      5. 9.1.5 Metabolic Disorders | | |
      6. 9.1.6 Respiratory Disorders | | |
      7. 9.1.7 Gastroenterology | | |
      8. 9.1.8 Ophthalmology | | |
      9. 9.1.9 Dermatology | | |
      10. 9.1.10 Urology | | |
      11. 9.1.11 Other Therapeutic Areas | |
  10. 10 Competitive Landscape | |
    1. 10.1 Market Concentration Analysis | |
    2. 10.2 Competitive Benchmarking Matrix | |
    3. 10.3 Company Profiles | |
  11. 11 Recent News & Developments | |
  12. 12 Report Scope and Methodology | |
  13. 13 Detailed Sources and Citations | |
  14. 14 Frequently Asked Questions | | LIST OF TABLES | |
  15. TABLE 1 Global Small Molecule API Market Size & Forecast, by Revenue (USD Billion), 2021–2035 | |
  16. TABLE 2 Global Small Molecule API Market – Year-over-Year Growth Analysis, 2021–2035 | |
  17. TABLE 3 Driver Impact Analysis – Global Small Molecule API Market, 2026–2035 | |
  18. TABLE 4 Restraint Impact Analysis – Global Small Molecule API Market, 2026–2035 | |
  19. TABLE 5 Global Small Molecule API Market Size, by Region, 2021–2035 (USD Billion) | |
  20. TABLE 6 Asia-Pacific Small Molecule API Market Size, by Country, 2021–2035 (USD Billion) | |
  21. TABLE 7 Europe Small Molecule API Market Size, by Country, 2021–2035 (USD Billion) | |
  22. TABLE 8 North America Small Molecule API Market Size, by Country, 2021–2035 (USD Billion) | |
  23. TABLE 9 South America Small Molecule API Market Size, by Country, 2021–2035 (USD Billion) | |
  24. TABLE 10 Middle East & Africa Small Molecule API Market Size, by Country, 2021–2035 (USD Billion) | |
  25. TABLE 11 Global Small Molecule API Market Size, by Therapeutic Area, 2021–2035 (USD Billion) | |
  26. TABLE 12 Asia-Pacific Small Molecule API Market Size, by Therapeutic Area, 2021–2035 (USD Billion) | |
  27. TABLE 13 Europe Small Molecule API Market Size, by Therapeutic Area, 2021–2035 (USD Billion) | |
  28. TABLE 14 North America Small Molecule API Market Size, by Therapeutic Area, 2021–2035 (USD Billion) | |
  29. TABLE 15 South America Small Molecule API Market Size, by Therapeutic Area, 2021–2035 (USD Billion) | |
  30. TABLE 16 Middle East & Africa Small Molecule API Market Size, by Therapeutic Area, 2021–2035 (USD Billion) | |
  31. TABLE 17 Competitive Benchmarking Matrix – Global Small Molecule API Market, 2026 | |
  32. TABLE 18 Company Profiles – Key Players, Global Small Molecule API Market | |
  33. TABLE 19 Recent Developments & Strategic Announcements, 2023–2025 | |
  34. TABLE 20 Report Scope & Methodology Summary | |
  35. TABLE 21 Detailed Sources and Citations Index | | LIST OF FIGURES | |
  36. FIGURE 1 Global Small Molecule API Market – Market Dynamics Overview | |
  37. FIGURE 2 Industry Value Chain Analysis – Small Molecule API Manufacturing | |
  38. FIGURE 3 Porter's Five Forces Analysis – Global Small Molecule API Market | |
  39. FIGURE 4 Global Small Molecule API Market Size Trend, 2021–2035 (USD Billion) | |
  40. FIGURE 5 Year-over-Year Growth Trajectory, 2022–2035 (%) | |
  41. FIGURE 6 Market Share by Therapeutic Area, 2025 vs 2035 (%) | |
  42. FIGURE 7 Fastest Growing Therapeutic Areas by CAGR, 2026–2035 (%) | |
  43. FIGURE 8 Regional Market Share Distribution, 2025 (%) | |
  44. FIGURE 9 Regional CAGR Comparison, 2026–2035 (%) | |
  45. FIGURE 10 Asia-Pacific Country-Level Share Breakdown, 2025 (%) | |
  46. FIGURE 11 Competitive Landscape – Estimated Revenue Share Bands, 2026 | |
  47. FIGURE 12 Driver and Restraint Impact Weighting Chart

Segmentation Quick Reference

DimensionSub-SegmentsDominant SegmentFastest Growing Segment
By Therapeutic AreaOncology; Cardiovascular Diseases; Central Nervous System and Neurology; Infectious Diseases; Metabolic Disorders; Respiratory Disorders; Gastroenterology; Ophthalmology; Dermatology; Urology; Other Therapeutic AreasOncology (24.65% share)Central Nervous System and Neurology (7.41% CAGR)


Market Segmentation Overview

By Therapeutic Area

Sub-SegmentKey Trend
OncologyTargeted and cytotoxic chemistry moving into earlier treatment lines
Cardiovascular DiseasesStable high-tonnage demand under sustained tender price pressure
Central Nervous System and NeurologyNeurodegenerative and psychiatric pipelines lifting specialized synthesis need
Infectious DiseasesStewardship and tender systems limiting pricing flexibility on legacy molecules
Metabolic DisordersIncretin and antidiabetic scale-up driving peptide-capable capacity build
Respiratory DisordersInhaled maintenance therapy requiring tight particle and purity specification
GastroenterologyMature oral agents with steady volume and low differentiation
OphthalmologyAgeing demographics supporting specialty substance demand.
DermatologyOral and topical immunomodulators expanding prescription base
UrologySteady chronic demand concentrated in a narrow molecule set.
Other Therapeutic AreasOrphan and specialty indications adding low-volume, high-value work


Oncology leads this dimension at 24.65% share because targeted agents carry high per-kilogram value and demand tightly controlled containment chemistry that few plants can provide. Central nervous system and neurology grow fastest at 7.41% CAGR, driven by neurodegenerative programs reaching commercial scale and by the blood-brain-barrier-optimized structures they require. Cardiovascular diseases and metabolic disorders supply the tonnage base, but tender pricing in the former limits value growth even as volumes hold steady. Infectious diseases sit at the opposite end, where stewardship policy and public procurement compress margins on molecules that have been off-patent for decades.




Download PDF ×

We do not share your information with anyone. However, we may send you emails based on your report interest from time to time. You may contact us at any time to opt-out.