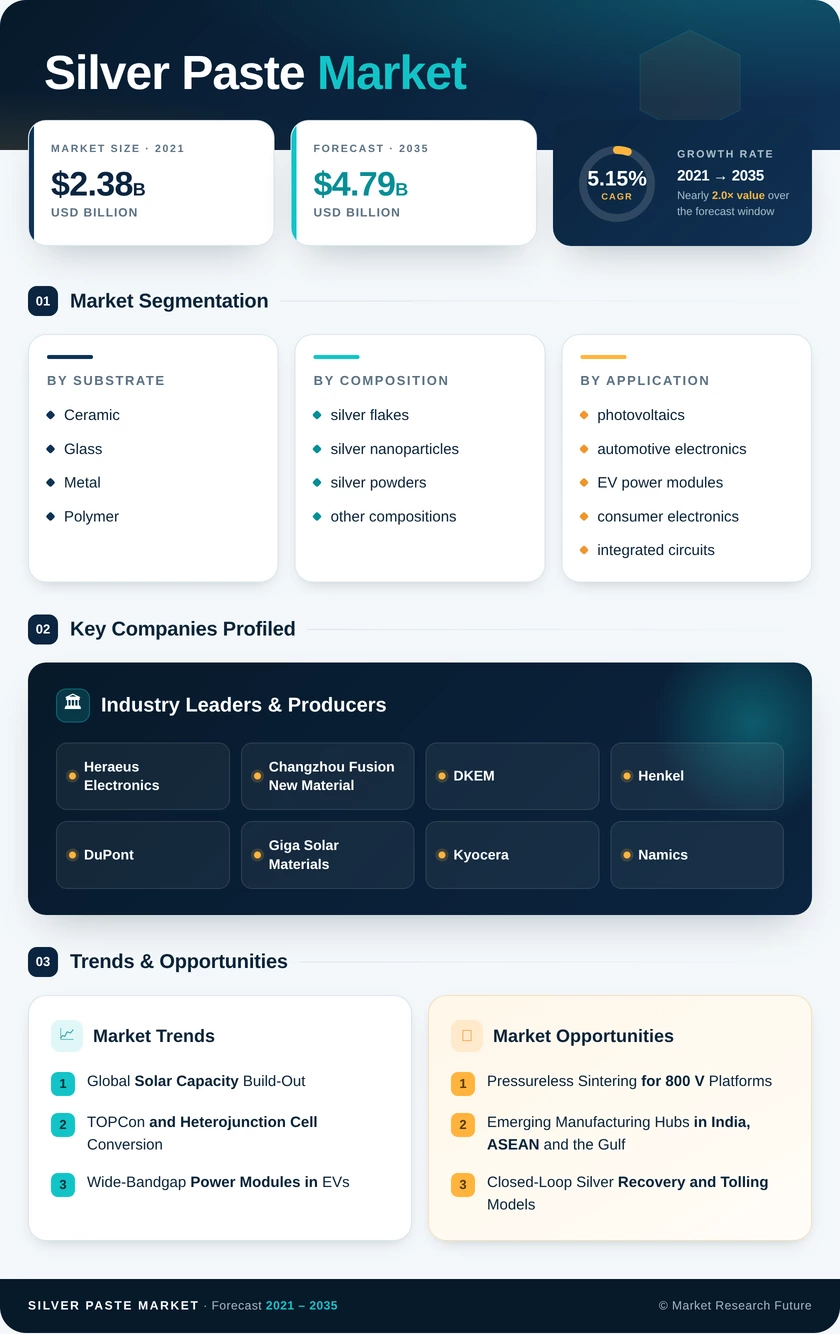
Silver Paste Market (2026 - 2035)

ID: MRFR/CnM/29129-HCR 128 Pages Priya Nagrale Last Updated: November 12, 2026
Silver Paste Market Research Report Information By Substrate (Ceramic, Glass, Metal, and Polymer), By Composition (Silver Flakes, Silver Nanoparticles, Silver Powders, and Other Compositions), By Application (Photovoltaics, Automotive Electronics and EV Power Modules, Consumer Electronics, Integrated Circuits and Semiconductors, and Other Applications), And By Region (North America, Europe, Asia-Pacific, and Rest of the World) – Market Forecast Till 2035.
Silver Paste Market
Market Size
Forecast Period2026-2035
CAGR (2026-2035)5.15%
2025 Market SizeUSD 2.90 Billion
2035 Market SizeUSD 4.79 Billion
Key Players
Heraeus Electronics
Changzhou Fusion New Material
DKEM
Henkel
DuPont
Giga Solar Materials
Opportunities
  • Pressureless Sintering for 800 V Platforms
  • Emerging Manufacturing Hubs in India, ASEAN and the Gulf
  • Closed-Loop Silver Recovery and Tolling Models
  1. 1 Market Summary | |
  2. 2 Key Report Takeaways | |
    1. 2.1 By Substrate | |
    2. 2.2 By Composition | |
    3. 2.3 By Application | |
    4. 2.4 By Region | |
  3. 3 Market Size and Forecast (2021–2035) | |
    1. 3.1 Historical Market Size (2021–2025) | |
    2. 3.2 Forecast Market Size (2026–2035) | |
    3. 3.3 Year-over-Year Growth Analysis | |
  4. 4 Driver Impact Analysis | |
    1. 4.1 Global Solar Capacity Build-Out | |
    2. 4.2 TOPCon and Heterojunction Cell Conversion | |
    3. 4.3 Wide-Bandgap Power Modules in EVs | |
    4. 4.4 Manufacturing Incentives and Localization | |
    5. 4.5 Semiconductor Packaging Investment | |
    6. 4.6 Flexible, Wearable and Display Electronics | |
    7. 4.7 AI Data-Center Power Infrastructure | |
  5. 5 Restraints Impact Analysis | |
    1. 5.1 Silver Price Volatility | |
    2. 5.2 Silver Thrifting and Copper Substitution | |
    3. 5.3 Module Oversupply and Price Compression | |
    4. 5.4 Raw-Material Concentration and Policy Risk | |
    5. 5.5 Environmental and Product Compliance | |
  6. 6 Opportunities | |
    1. 6.1 Pressureless Sintering for 800 V Platforms | |
    2. 6.2 Emerging Manufacturing Hubs in India, ASEAN and the Gulf | |
    3. 6.3 Closed-Loop Silver Recovery and Tolling Models | |
    4. 6.4 Low-Temperature Pastes for Tandem Cells | |
    5. 6.5 Process-Data Services and Line Analytics | |
  7. 7 Regional Market Share and Country-Level Analysis | |
    1. 7.1 North America | | |
      1. 7.1.1 US | | |
      2. 7.1.2 Canada | | |
      3. 7.1.3 Mexico | |
    2. 7.2 Europe | | |
      1. 7.2.1 Germany | | |
      2. 7.2.2 UK | | |
      3. 7.2.3 France | | |
      4. 7.2.4 Italy | | |
      5. 7.2.5 Spain | | |
      6. 7.2.6 Nordic Countries | | |
      7. 7.2.7 Russia | | |
      8. 7.2.8 Rest of Europe | |
    3. 7.3 Asia-Pacific | | |
      1. 7.3.1 China | | |
      2. 7.3.2 India | | |
      3. 7.3.3 Japan | | |
      4. 7.3.4 South Korea | | |
      5. 7.3.5 ASEAN | | |
      6. 7.3.6 Rest of Asia-Pacific | |
    4. 7.4 South America | | |
      1. 7.4.1 Brazil | | |
      2. 7.4.2 Argentina | | |
      3. 7.4.3 Rest of South America | |
    5. 7.5 Middle East & Africa | | |
      1. 7.5.1 Saudi Arabia | | |
      2. 7.5.2 UAE | | |
      3. 7.5.3 South Africa | | |
      4. 7.5.4 Egypt | | |
      5. 7.5.5 Rest of MEA | |
  8. 8 Future Outlook (2026–2035) | |
    1. 8.1 Terawatt-Scale Solar and the Silver Intensity Race | |
    2. 8.2 Wide-Bandgap Electrification | |
    3. 8.3 AI-Assisted Formulation and Inline Process Control | |
    4. 8.4 Critical-Materials Policy, Recycling and ESG Disclosure | |
  9. 9 Segmentation Analysis | |
    1. 9.1 By Substrate | | |
      1. 9.1.1 Ceramic | | |
      2. 9.1.2 Glass | | |
      3. 9.1.3 Metal | | |
      4. 9.1.4 Polymer | |
    2. 9.2 By Composition | | |
      1. 9.2.1 silver flakes | | |
      2. 9.2.2 silver nanoparticles | | |
      3. 9.2.3 silver powders | | |
      4. 9.2.4 other compositions | |
    3. 9.3 By Application | | |
      1. 9.3.1 photovoltaics | | |
      2. 9.3.2 automotive electronics and EV power modules | | |
      3. 9.3.3 consumer electronics | | |
      4. 9.3.4 integrated circuits and semiconductors | | |
      5. 9.3.5 other applications | |
  10. 10 Competitive Landscape | |
    1. 10.1 Market Concentration Analysis | |
    2. 10.2 Competitive Benchmarking Table | |
    3. 10.3 Company Profiles | | |
      1. 10.3.1 Heraeus Electronics | | |
      2. 10.3.2 Changzhou Fusion New Material | | |
      3. 10.3.3 DKEM | | |
      4. 10.3.4 Henkel | | |
      5. 10.3.5 DuPont | | |
      6. 10.3.6 Giga Solar Materials | | |
      7. 10.3.7 Kyocera | | |
      8. 10.3.8 Namics | | |
      9. 10.3.9 Indium Corporation | | |
      10. 10.3.10 Vibrantz Technologies | |
  11. 11 Recent News & Developments | |
  12. 12 Report Scope and Methodology | |
  13. 13 Detailed Sources and Citations | |
  14. 14 Frequently Asked Questions (FAQs) | | LIST OF TABLES | |
  15. TABLE 1 Global Market Size & Forecast, by Revenue (USD Billion), 2021–2035 | |
  16. TABLE 2 Year-over-Year Growth Analysis, 2021–2035 | |
  17. TABLE 3 Driver Impact Analysis | |
  18. TABLE 4 Restraints Impact Analysis | |
  19. TABLE 5 Regional Summary, 2025 | |
  20. TABLE 6 North America, by Country, 2025 | |
  21. TABLE 7 Europe, by Country, 2025 | |
  22. TABLE 8 Asia-Pacific, by Country, 2025 | |
  23. TABLE 9 South America, by Country, 2025 | |
  24. TABLE 10 Middle East & Africa, by Country, 2025 | |
  25. TABLE 11 Global Market, by Substrate, 2025 | |
  26. TABLE 12 Global Market, by Composition, 2025 | |
  27. TABLE 13 Global Market, by Application, 2025 | |
  28. TABLE 14 Competitive Benchmarking Table | |
  29. TABLE 15 Report Scope and Methodology | |
  30. TABLE 16 Detailed Sources and Citations | |
  31. TABLE 17 Segmentation Quick Reference | | LIST OF FIGURES | |
  32. FIGURE 1 Market Dynamics Overview (Drivers, Restraints, Opportunities) | |
  33. FIGURE 2 Industry Value Chain Analysis | |
  34. FIGURE 3 Porter's Five Forces Analysis | |
  35. FIGURE 4 Global Market Size Trend, 2021–2035 (USD Billion) | |
  36. FIGURE 5 Market Share by Substrate, 2025 | |
  37. FIGURE 6 Market Share by Composition, 2025 | |
  38. FIGURE 7 Market Share by Application, 2025 | |
  39. FIGURE 8 Regional Market Share, 2025 | |
  40. FIGURE 9 Country-Level Share within Asia-Pacific, 2025 | |
  41. FIGURE 10 Competitive Landscape Positioning Matrix | |
  42. FIGURE 11 Estimated Revenue Share Ranges of Key Players

Segmentation Quick Reference

DimensionSub-SegmentsDominant SegmentFastest Growing Segment
By SubstrateCeramic, Glass, Metal, PolymerCeramic (48.3% share)Polymer (5.72% CAGR)
By Compositionsilver flakes, silver nanoparticles, silver powders, other compositionssilver flakes (51.4% share)silver nanoparticles (6.41% CAGR)
By Applicationphotovoltaics, automotive electronics and EV power modules, consumer electronics, integrated circuits and semiconductors, other applicationsphotovoltaics (54.0% share)automotive electronics and EV power modules (7.64% CAGR)
By RegionNorth America, Europe, Asia-Pacific, South America, Middle East & AfricaAsia-Pacific (66.8% share)Asia-Pacific (66.8% share)

Market Segmentation Overview

By Substrate

Sub-SegmentKey Trend
CeramicHigh-temperature bondlines for DBC and AMB power modules
GlassDefroster grids, touch panels and display electrodes
MetalDie-attach to copper lead frames and heat spreaders
PolymerLow-cure formulations on polyimide and PET films

Ceramic leads this dimension because EV inverters and industrial drives demand bondlines that tolerate temperatures above 250 °C while isolating high voltages. Polymer grows fastest as low-temperature curing chemistries allow conductive traces on polyimide and PET without damaging the film. Glass and Metal remain steady, tied to automotive glazing and lead-frame packaging respectively.

By Composition

Sub-SegmentKey Trend
silver flakesDense packing for high-speed solar screen printing
silver nanoparticlesPressureless sintering for SiC and GaN die-attach
silver powdersFired thick-film conductors and electrodes
other compositionsSilver-coated copper hybrids lowering metal cost

Silver flakes hold the lead because their platelet geometry delivers low line resistance at the print speeds cell makers require. Silver nanoparticles grow fastest, since their sintering at 200–250 °C without pressure suits wide-bandgap modules that cannot tolerate solder fatigue. Other compositions, chiefly silver-coated copper, gain where heterojunction producers trade a little conductivity for lower metal cost.

By Application

Sub-SegmentKey Trend
photovoltaicsn-type cell metallization with falling laydown per watt
automotive electronics and EV power modulesSintered die-attach for 800 V SiC inverters
consumer electronicsFine-line pastes for displays and wearables
integrated circuits and semiconductorsPackaging capacity additions outside traditional hubs
other applicationsRFID, LEDs and medical devices with mixed substitution risk

Photovoltaics remains the largest application because every crystalline-silicon solar cell still relies on screen-printed silver contacts, even as thrifting trims grams per cell. Automotive electronics and EV power modules grow fastest, driven by SiC inverters whose junction temperatures demand sintered joints and justify premium pricing. Integrated circuits and semiconductors add value from new packaging lines in the U.S., Japan and South Korea.


Download PDF ×

We do not share your information with anyone. However, we may send you emails based on your report interest from time to time. You may contact us at any time to opt-out.