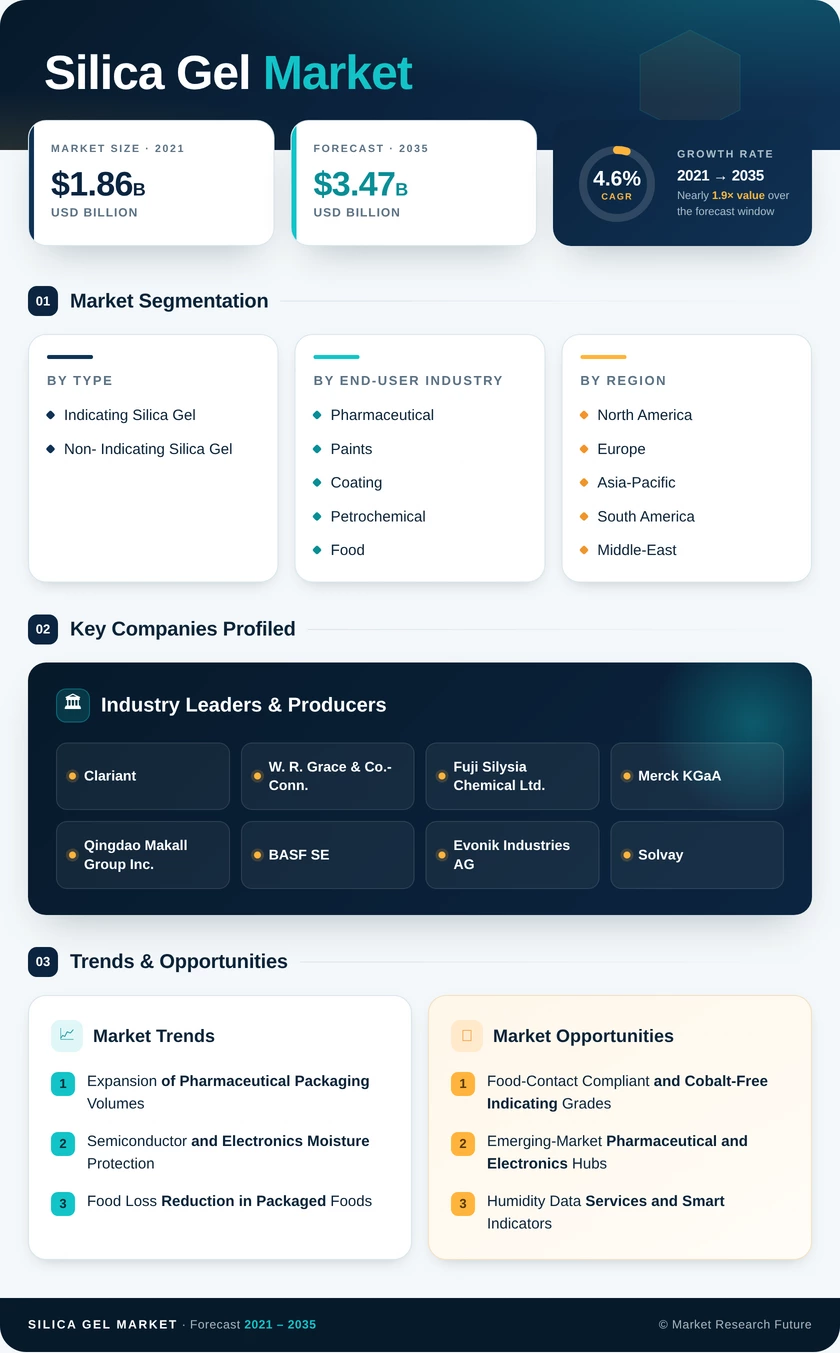
Silica Gel Market (2026 - 2035)

ID: MRFR/CnM/3715-HCR 111 Pages Chitranshi Jaiswal Last Updated: October 17, 2026
Silica Gel Market Research Report Information By Type (Indicating Silica Gel and Non- Indicating Silica Gel), and By End-user Industry (Pharmaceutical, Paints and Coating, Petrochemical, Food and Beverages, Personal Care, Plastics, and Other End-user Industries) – Forecast Till 2035.
Silica Gel Market
Market Size
Forecast Period2026-2035
CAGR (2026-2035)4.6%
2025 Market SizeUSD 2.21 Billion
2035 Market SizeUSD 3.47 Billion
Key Players
Clariant
W. R. Grace & Co.-Conn.
Fuji Silysia Chemical Ltd.
Merck KGaA
Qingdao Makall Group Inc.
BASF SE
Opportunities
  • Food-Contact Compliant and Cobalt-Free Indicating Grades
  • Emerging-Market Pharmaceutical and Electronics Hubs
  • Humidity Data Services and Smart Indicators
  1. 1 Market Summary | |
  2. 2 Key Report Takeaways | |
    1. 2.1 By Type | |
    2. 2.2 By End-user Industry | |
    3. 2.3 By Region | |
  3. 3 Market Size and Forecast (2021–2035) | |
    1. 3.1 Historical Market Size (2021–2024) | |
    2. 3.2 Base Year and Forecast Market Size (2025–2035) | |
    3. 3.3 Year-over-Year Growth Analysis | |
  4. 4 Driver Impact Analysis | |
    1. 4.1 Expansion of Pharmaceutical Packaging Volumes | |
    2. 4.2 Semiconductor and Electronics Moisture Protection | |
    3. 4.3 Food Loss Reduction in Packaged Foods | |
    4. 4.4 Natural Gas and Petrochemical Dehydration | |
    5. 4.5 Seaborne Cargo and E-commerce Moisture Damage Prevention | |
    6. 4.6 Shift to Cobalt-Free Indicating Grades | |
  5. 5 Restraints Impact Analysis | |
    1. 5.1 Low-Cost Substitutes | |
    2. 5.2 Feedstock and Energy Cost Volatility | |
    3. 5.3 Compliance Cost of Cobalt-Based Indicator Restrictions | |
    4. 5.4 Single-Use Packaging Waste Rules | |
    5. 5.5 Price Competition from Fragmented Regional Producers | |
  6. 6 Opportunities | |
    1. 6.1 Food-Contact Compliant and Cobalt-Free Indicating Grades | |
    2. 6.2 Emerging-Market Pharmaceutical and Electronics Hubs | |
    3. 6.3 Humidity Data Services and Smart Indicators | |
    4. 6.4 Regeneration and Take-Back Service Models | |
    5. 6.5 Battery Manufacturing Dry Rooms | |
  7. 7 Regional Market Share and Country-Level Analysis | |
    1. 7.1 North America | | |
      1. 7.1.1 United States | | |
      2. 7.1.2 Canada | | |
      3. 7.1.3 Mexico | |
    2. 7.2 Europe | | |
      1. 7.2.1 Germany | | |
      2. 7.2.2 United Kingdom | | |
      3. 7.2.3 Italy | | |
      4. 7.2.4 France | | |
      5. 7.2.5 Rest of Europe | |
    3. 7.3 Asia-Pacific | | |
      1. 7.3.1 China | | |
      2. 7.3.2 India | | |
      3. 7.3.3 Japan | | |
      4. 7.3.4 South Korea | | |
      5. 7.3.5 Rest of Asia-Pacific | |
    4. 7.4 South America | | |
      1. 7.4.1 Brazil | | |
      2. 7.4.2 Argentina | | |
      3. 7.4.3 Rest of South America | |
    5. 7.5 Middle-East and Africa | | |
      1. 7.5.1 Saudi Arabia | | |
      2. 7.5.2 South Africa | | |
      3. 7.5.3 Rest of Middle-East and Africa | |
  8. 8 Future Outlook (2026–2035) | |
    1. 8.1 Advanced Semiconductor Packaging Raises Purity Requirements | |
    2. 8.2 Circularity and ESG Reporting | |
    3. 8.3 Biologics, Diagnostics and Specialty Drug Formats | |
    4. 8.4 Digital Humidity Monitoring | |
  9. 9 Segmentation Analysis | |
    1. 9.1 By Type | | |
      1. 9.1.1 Indicating Silica Gel | | |
      2. 9.1.2 Non- Indicating Silica Gel | |
    2. 9.2 By End-user Industry | | |
      1. 9.2.1 Pharmaceutical | | |
      2. 9.2.2 Paints and Coating | | |
      3. 9.2.3 Petrochemical | | |
      4. 9.2.4 Food and Beverages | | |
      5. 9.2.5 Personal Care | | |
      6. 9.2.6 Plastics | | |
      7. 9.2.7 Other End-user Industries | |
  10. 10 Competitive Landscape | |
    1. 10.1 Market Concentration Analysis | |
    2. 10.2 Competitive Benchmarking Table | |
  11. 11 Recent News & Developments | |
  12. 12 Report Scope and Methodology | |
  13. 13 Detailed Sources and Citations | |
  14. 14 Frequently Asked Questions (FAQs) | | LIST OF TABLES | |
  15. TABLE 1 Global Market Snapshot, 2025 and 2035 | |
  16. TABLE 2 Global Market Size and Forecast, by Revenue (USD Billion), 2021–2035 | |
  17. TABLE 3 Driver Impact Analysis, 2026–2035 | |
  18. TABLE 4 Restraints Impact Analysis, 2026–2035 | |
  19. TABLE 5 Regional Summary, 2025 | |
  20. TABLE 6 North America Market, by Country, 2025 | |
  21. TABLE 7 Europe Market, by Country, 2025 | |
  22. TABLE 8 Asia-Pacific Market, by Country, 2025 | |
  23. TABLE 9 South America Market, by Country, 2025 | |
  24. TABLE 10 Middle-East and Africa Market, by Country, 2025 | |
  25. TABLE 11 Market Segmentation, by Type, 2025–2035 | |
  26. TABLE 12 Market Segmentation, by End-user Industry, 2025–2035 | |
  27. TABLE 13 Competitive Benchmarking Table, 2025 | |
  28. TABLE 14 Report Scope and Methodology | |
  29. TABLE 15 Detailed Sources and Citations | |
  30. TABLE 16 Segmentation Quick Reference | | LIST OF FIGURES | |
  31. FIGURE 1 Market Dynamics Overview — Drivers, Restraints and Opportunities | |
  32. FIGURE 2 Industry Value Chain Analysis | |
  33. FIGURE 3 Porter's Five Forces Analysis | |
  34. FIGURE 4 Global Market Size Trend, 2021–2035 (USD Billion) | |
  35. FIGURE 5 Year-over-Year Growth Trend, 2022–2035 | |
  36. FIGURE 6 Market Share, by Type, 2025 | |
  37. FIGURE 7 Market Share, by End-user Industry, 2025 | |
  38. FIGURE 8 Regional Market Share, 2025 | |
  39. FIGURE 9 Country-Level Share within Asia-Pacific, 2025 | |
  40. FIGURE 10 Competitive Landscape — Estimated Revenue Share Ranges, 2025

Segmentation Quick Reference

DimensionSub-SegmentsDominant SegmentFastest Growing Segment
By TypeIndicating Silica Gel; Non- Indicating Silica GelNon- Indicating Silica Gel (68.5% share)Indicating Silica Gel (5.3% CAGR)
By End-user IndustryPharmaceutical; Paints and Coating; Petrochemical; Food and Beverages; Personal Care; Plastics; Other End-user IndustriesPharmaceutical (27.5% share)Food and Beverages (5.6% CAGR)
By RegionNorth America; Europe; Asia-Pacific; South America; Middle-East and AfricaAsia-Pacific (46.0% share)Asia-Pacific (46.0% share)

Market Segmentation Overview

By Type

Sub-SegmentKey Trend
Indicating Silica GelRapid transition from cobalt chloride blue to cobalt-free orange and green indicators
Non- Indicating Silica GelShift from loose sachets toward molded canisters and film-integrated inserts

Non- Indicating Silica Gel leads with a 68.5% share because drug, food and cargo packs need inert, low-cost moisture capacity without visual saturation cues. Indicating Silica Gel grows fastest at a 5.3% CAGR as compliant cobalt-free formulations reopen European and pharmaceutical channels once closed by SVHC restrictions. Premium pricing on these new indicators lifts the segment's value faster than its tonnage.

By End-user Industry

Sub-SegmentKey Trend
PharmaceuticalQualified canisters for moisture-sensitive solid doses and high-purity purification grades
Paints and CoatingSilica matting agents for low-gloss architectural and industrial finishes
PetrochemicalBead-form media for LNG pre-treatment and gas dew point control
Food and BeveragesInserts for dried foods, spices and nutraceutical capsules in humid climates
Personal CareSpherical grades for oil absorption in powders and foundations
PlasticsAnti-blocking additives for polyolefin films
Other End-user IndustriesElectronics dry-packing, footwear, textiles and container cargo protection

Pharmaceutical holds the largest share at 27.5%, as USP-qualified inserts are locked into approved drug packs for a product's lifetime. Food and Beverages grows fastest at a 5.6% CAGR, led by brands in Southeast Asia and Latin America extending shelf life for dried products. Petrochemical provides steady replacement demand tied to gas-processing capacity, while Personal Care gains from spherical grades in oil-control cosmetics.


Download PDF ×

We do not share your information with anyone. However, we may send you emails based on your report interest from time to time. You may contact us at any time to opt-out.