Segmentation Quick Reference
| Dimension | Sub-Segments | Dominant Segment | Fastest Growing Segment |
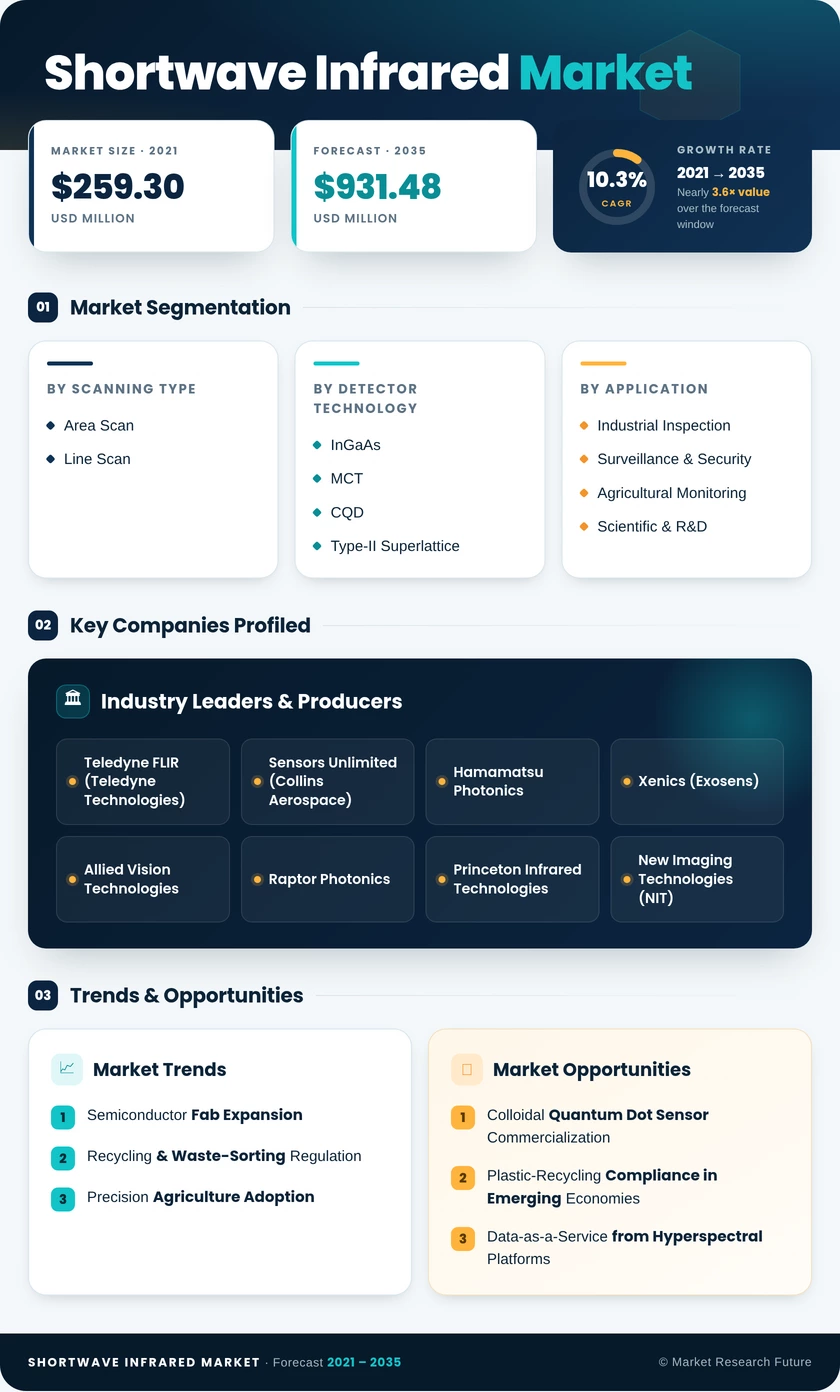
| Scanning Type | Area Scan, Line Scan | Area Scan | Line Scan |
| Detector Technology | InGaAs, MCT, CQD, Type-II Superlattice | InGaAs | CQD |
| Application | Industrial Inspection, Surveillance & Security, Agricultural Monitoring, Scientific & R&D | Industrial Inspection | Agricultural Monitoring |
| Spectral Band | 0.9–1.4 µm, 1.4–2.2 µm, 2.2–3.0 µm | 0.9–1.4 µm | 2.2–3.0 µm |
| Platform | Fixed/Mounted Systems, Handheld & Portable, UAV/Drone-Integrated | Fixed/Mounted Systems | UAV/Drone-Integrated |
Market Segmentation Overview
By Scanning Type
| Sub-Segment | Key Trend |
| Area Scan | Dominant format for semiconductor and defense inspection; migrating toward higher-resolution 1280×1024 arrays |
| Line Scan | Rapid adoption in recycling conveyors and food-grading lines, enabling per-pixel spectral classification at 50 kHz+ |
Area scan configurations remain the workhorse of the Shortwave Infrared Market, prized for full-frame capture in static or low-speed environments. Line scan systems are closing the gap in throughput-critical sorting and web-inspection applications.
By Detector Technology
| Sub-Segment | Key Trend |
| InGaAs | Industry standard with mature epitaxial supply chain; dominant in 0.9–1.7 µm commercial and defense applications |
| MCT (HgCdTe) | Extended-wavelength coverage for specialized military and scientific use; limited by high unit cost and export controls |
| CQD (Colloidal Quantum Dot) | Solution-processed thin-film technology approaching commercial viability; potential to reduce SWIR sensor costs by 70–80% |
| Type-II Superlattice | High-operating-temperature alternative to MCT; gaining traction in military imaging programs |
InGaAs maintains its position as the backbone detector material, while CQD technology attracts the most investment as the primary pathway to democratizing shortwave infrared sensing across consumer and industrial markets.
By Application
| Sub-Segment | Key Trend |
| Industrial Inspection | Semiconductor wafer, solar-cell, and pharmaceutical QA driving sustained volume |
| Surveillance & Security | Defense, ISR and border-monitoring programs supporting premium camera demand |
| Agricultural Monitoring | Government-funded hyperspectral programs in India and Brazil are accelerating field deployment. |
| Scientific & R&D | Material characterization and spectroscopy are driving niche but stable demand. |
Industrial inspection anchors the Shortwave Infrared Market, with semiconductor fabs representing the single largest demand pool. Agricultural monitoring is the fastest-growing vertical as governments invest in food-security technology.
By Spectral Band
| Sub-Segment | Key Trend |
| 0.9–1.4 µm | Preferred for silicon-transparency inspection and moisture detection; lowest-cost InGaAs detectors operate here |
| 1.4–2.2 µm | Growing adoption in chemical identification and gas-leak sensing |
| 2.2–3.0 µm | Accelerating in petrochemical and plastics sorting requires cooled detector configurations |
The 0.9–1.4 µm band dominates due to its alignment with the most cost-effective InGaAs detector architectures. The 2.2–3.0 µm band is expanding as recycling mandates demand precise polymer identification.
By Platform
| Sub-Segment | Key Trend |
| Fixed/Mounted Systems | Inline factory inspection and perimeter security installations drive the largest platform share. |
| Handheld & Portable | Gaining in field-maintenance, counterfeit detection, and art-authentication use cases |
| UAV/Drone-Integrated | Fastest-growing platform as agricultural and pipeline-survey drones adopt miniaturized SWIR payloads. |
Fixed systems dominate installed-base counts, but UAV-integrated platforms are reshaping the Shortwave Infrared Market as SWaP-optimized camera cores enable aerial hyperspectral data collection at scale.