InGaAs Camera Market (2026 – 2035)

InGaAs Camera Market Size, Share and Research Report By Application (Military and Defence, Industrial Automation, Security and Surveillance, Other Applications), By Cooling Type (Uncooled, Cooled) and By Regional (North America, Europe, Asia-Pacific, South America, Middle East & Africa) - Industry Forecast to 2035.
ID: MRFR/SEM/6330-CR 111 Pages Ankit Gupta, Shubham Munde Last Updated: October 27, 2026
InGaAs Camera Market
Market Size
Forecast Period2026-2035
CAGR (2026-2035)11.90%
2025 Market SizeUSD 185.9 Million
2035 Market SizeUSD 619.4 Million
Key Players
Teledyne Technologies
Hamamatsu Photonics
Sony Semiconductor Solutions
Lynred
Xenics
Allied Vision
Opportunities
  • Automotive SWIR for Advanced Driver Assistance
  • Emerging-Market Agricultural and Recycling Deployment
  • Imaging-as-a-Service and Outcome-Based Contracting

InGaAs Camera Market Summary

The InGaAs Camera Market reached USD 185.9 Million in 2025 and opens the forecast window at USD 222.4 Million in 2026, climbing to USD 619.4 Million by 2035 at a 11.9% CAGR across 2026–2035. Procurement momentum is anchored in two concrete catalysts: the U.S. Department of Defense budget request for night-vision and electro-optical sensor modernization, which sustained multi-year funding lines for soldier-portable imaging through FY2025 [1], and the European Union's Chips Act allocation of EUR 43 billion toward semiconductor capacity, which expands demand for wafer and photovoltaic inspection tooling that depends on the 900–1700 nm band [2].

Replacement dynamics are unusually clean in this market. Silicon-based CCD and CMOS sensors simply cannot detect beyond roughly 1000 nm, so the InGaAs Camera Market is absorbing inspection, sorting, and surveillance tasks that legacy visible-spectrum systems handled poorly or not at all. Cooled scientific-grade units are giving way to uncooled, lightweight modules with smaller pixel pitch and larger array formats, while photonics manufacturers have committed capital toward domestic compound-semiconductor detector lines under U.S. CHIPS Act awards exceeding USD 1.5 billion in the broader photonics category [3].

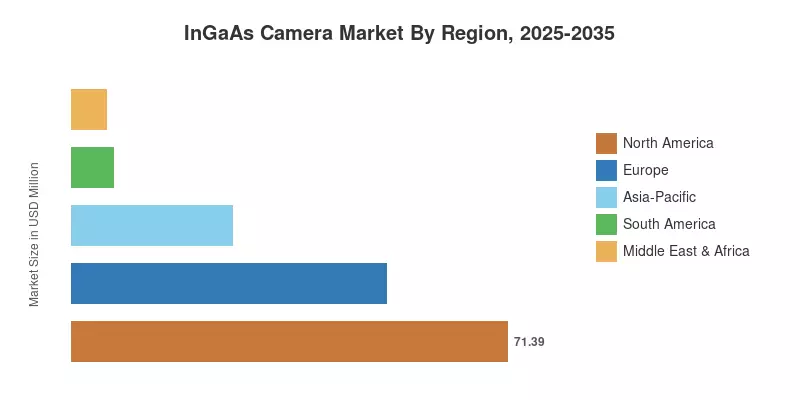
Regionally, North America holds 38.4% of the InGaAs Camera Market on the strength of defense electro-optics programs and semiconductor fab density. Asia-Pacific is the fastest-growing region at a 14.2% CAGR, propelled by Chinese, Korean, and Japanese display and battery inspection capacity. Europe follows as the second-largest region, where aerospace primes and pharmaceutical inspection lines sustain steady replacement cycles. Through 2035, cost curves on uncooled focal plane arrays will determine how far the InGaAs Camera Market penetrates mid-tier industrial buyers.

Key Report Takeaways

• By Application

  • Military and Defence leads the InGaAs Camera Market with a 34.5% revenue share in 2025, sustained by enhanced vision systems and thermal weapon sight integration
  • Industrial Automation is the fastest-expanding application in the InGaAs Camera Market, advancing at a 12.4% CAGR through 2035 as inspection lines adopt SWIR-capable sensing
  • Security and Surveillance contributed USD 33.8 Million in 2025, concentrated in border and critical-infrastructure perimeter programs

• By Cooling Type

  • Uncooled systems account for 61.2% of unit-weighted demand, favored for size, weight, and power constraints in mobile platforms
  • Cooled architectures grow at a 10.7% CAGR, retaining primacy in low-flux scientific and astronomical work

• By Region

  • North America commands 38.4% of the InGaAs Camera Market, the largest single regional pool
  • Asia-Pacific posts a 14.2% CAGR, the steepest trajectory in the InGaAs Camera Market
  • Europe generated USD 51.5 Million in 2025 across aerospace, pharmaceutical, and recycling applications

Market Size and Forecast (2021–2035)

Figures below are triangulated from supplier revenue disclosures, customs-level trade data on photodetector assemblies, defense procurement line items, and interviews with systems integrators across North America, Europe, and Asia-Pacific. Historical values for 2021–2024 reflect reconstructed shipment volumes multiplied by blended average selling prices; forecast values apply a demand-side model weighted toward defense budget cycles and semiconductor capital expenditure. Base-year 2025 estimates were cross-checked against publicly filed segment revenues for the four largest suppliers.
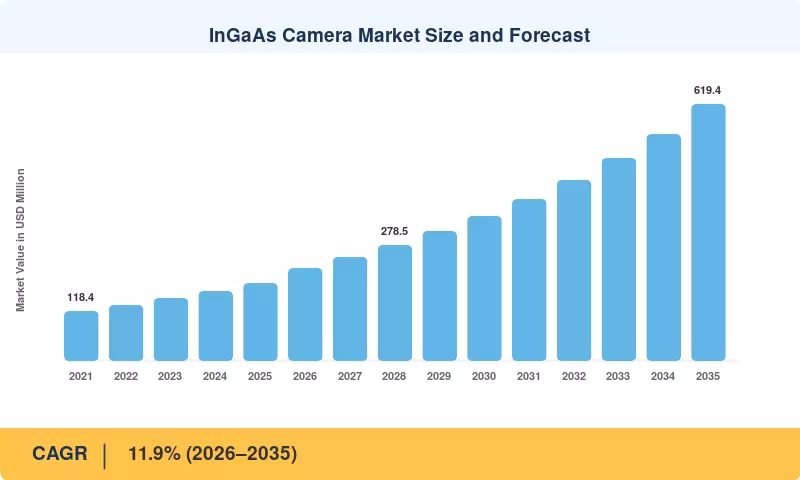
InGaAs Camera Market Size and Forecast
Our Impact

Enabled $4.3B Revenue Impact for Fortune 500 and Leading Multinationals

Partnering with 2000+ Global Organizations Each Year

30K+ Citations by Top-Tier Firms in the Industry

Driver Impact Analysis

Driver ~% Impact on CAGR Geographic Relevance Impact Timeline
Defense electro-optics modernization 2.9 North America, Europe, Middle East Medium-term (2–4 yr)
Semiconductor and display inspection capex 2.4 Asia-Pacific, North America Short-term (≤2 yr)
Uncooled sensor cost decline 2.1 Global Long-term (≥4 yr)
Lithium battery quality inspection mandates 1.6 Asia-Pacific, Europe Medium-term (2–4 yr)
Food and agricultural sorting automation 1.3 Europe, North America Long-term (≥4 yr)
Solar cell and PV manufacturing scale-up 1.1 Asia-Pacific Medium-term (2–4 yr)
Hyperspectral imaging in life sciences 0.8 North America, Europe Long-term (≥4 yr)


Defense Electro-Optics Modernization

The largest demand pool continues to be soldier-portable and vehicle-mounted vision programs. With SWIR-capable channels required for laser-designator compatibility and haze penetration, the U.S. Army's Integrated Visual Augmentation System and subsequent night-vision procurements maintained obligations exceeding USD 1.2 billion into FY2023–FY2025 [1]. In 2024, eleven European NATO nations released follow-on financing for ground vehicle improved vision retrofits that specify InGaAs focal plane arrays, fulfilling their commitment to increase defense spending toward 2% of GDP.


Semiconductor and Display Inspection Capex

These detectors are standard on bonded-wafer and TSV inspection stations because wafer-level inspection at 1050–1550 nm enables through-silicon imaging that is not possible with visible-band instruments. Advanced packaging lines are the fastest-growing subset, with global fab equipment spending estimated by SEMI to be around USD 110 billion in 2024 and expected to increase through 2026 [6]. Fab tool shipments and camera unit demand are directly multiplied by each new bonding and inspection tool, which usually incorporates one to four SWIR channels.


Uncooled Sensor Cost Decline

Average selling prices for VGA-format uncooled modules fell roughly 30% between 2020 and 2025 as wafer yields improved and 15 μm pixel pitch moved into volume production. Lower prices unlock mid-tier industrial buyers previously priced out at USD 15,000 per unit. U.S. CHIPS Act awards directed toward compound-semiconductor and photonics capacity exceeded USD 1.5 billion in aggregate, and domestic epitaxy capacity additions should compress cost further through the back half of the forecast window [3].

Lithium Battery Quality Inspection Mandates

Electrode coating uniformity and separator defect detection both benefit from near-infrared transmission imaging, which reveals subsurface inclusions invisible to visible-band inspection. The EU Battery Regulation, entering phased application from 2025, imposes performance, durability, and traceability obligations on cells placed on the European market [8]. Gigafactory operators in China, Korea, and Central Europe have responded by installing multi-camera inspection gantries, with typical greenfield lines specifying eight to twenty SWIR channels per coating and stacking module.

Food and Agricultural Sorting Automation

Moisture, sugar content, and foreign-body detection all present strong absorption features between 1200 and 1600 nm, which makes InGaAs sensing the practical basis for high-throughput optical sorters. FAO estimates global post-harvest losses at roughly 13% of production before retail, and processors deploying near-infrared sorting report measurable recovery of otherwise rejected product [9]. Sorter builders in Belgium, Japan, and the United States have moved SWIR channels from premium configurations into standard specifications on nut, grain, and plastics recycling lines.

Solar Cell and PV Manufacturing Scale-Up

Electroluminescence and photoluminescence inspection of crystalline silicon cells requires detection near 1150 nm, squarely inside the InGaAs response band. The International Energy Agency recorded global solar PV manufacturing capacity expanding past 1,100 GW annually by 2024, heavily concentrated in China and Southeast Asia [10]. Every heterojunction and TOPCon line commissioned during that build-out carries inline luminescence stations, and cell makers increasingly run 100% inspection rather than statistical sampling to defend warranty economics.

Hyperspectral Imaging in Life Sciences

Optical coherence tomography, fluorescence imaging beyond 1000 nm, and tissue perfusion assessment all depend on detectors with quantum efficiency where silicon fails. U.S. National Institutes of Health obligations for bioimaging research instrumentation remained above USD 400 million annually across recent cycles, funding both core facility upgrades and translational device work [11]. Second-window near-infrared imaging in preclinical oncology has moved from proof-of-concept to routine protocol at several dozen academic centers, seeding downstream clinical instrument demand.

Restraints Impact Analysis

Restraint weightings reflect estimated drag on growth momentum and are directional rather than additive. A single restraint may bind severely for one buyer class while being immaterial for another; the geographic column identifies where the constraint is most acute rather than where it is exclusively present.

Restraint ~% Drag on CAGR Geographic Relevance Impact Timeline
High unit acquisition cost -1.8 Global Short-term (≤2 yr)
Export control and ITAR restrictions -1.4 North America, Europe Medium-term (2–4 yr)
Indium supply concentration -0.9 Global Long-term (≥4 yr)
Competing sensor technologies -0.8 Asia-Pacific Long-term (≥4 yr)
Integration and calibration complexity -0.6 Global Short-term (≤2 yr)


High Unit Acquisition Cost

A comparable-resolution visible-band industrial camera costs about USD 400, but entry-level VGA modules still cost between USD 8,000 and USD 14,000. Adoption is limited to applications where the near-infrared range is actually required due to this thirty-fold cost. Payback criteria for inspection retrofits are reported by smaller manufacturers to be longer than 36 months, which is outside of the usual capital approval windows at mid-market European and North American facilities [12].


Export Control and ITAR Restrictions

High-performance infrared imaging is subject to Wassenaar dual-use limitations and U.S. Munitions List Category XII, which limit cross-border sales above specified frame-rate and sensitivity levels. The U.S. Bureau of Industry and Security strengthened regulations for advanced sensing exports to designated destinations in 2023 and 2024, and licensing periods often last more than ninety days . As a result, suppliers keep distinct export-compliant product lines, which increases the cost per platform and divides engineering work.


Indium Supply Concentration

Indium is recovered almost entirely as a zinc-refining byproduct, and the U.S. Geological Survey identifies China as the dominant refined producer with the United States holding no primary domestic production . Price volatility exceeding 40% within single years complicates multi-year supply agreements. While InGaAs detectors consume small absolute volumes, epitaxy suppliers hedge by carrying inventory, which ties up working capital and slows response to sudden order surges.

Competing Sensor Technologies

Quantum dot and germanium-on-silicon photodetectors promise CMOS-compatible fabrication at substantially lower cost, with several suppliers demonstrating SWIR-capable arrays at pixel pitches below 5 μm. Performance still trails established III-V devices on dark current and uniformity, but published roadmaps target commercial parity within the forecast window [15]. Procurement teams evaluating ten-year platform decisions increasingly defer purchases pending clarity on which detector chemistry wins volume applications.

Integration and Calibration Complexity

Near-infrared imaging demands matched optics, dedicated illumination, and non-uniformity correction routines that visible-band deployments rarely require. System integrators report commissioning timelines two to three times longer than equivalent visible installations, with lens transmission mismatch a frequent root cause of failed acceptance tests [16]. The resulting professional-services burden inflates total installed cost well beyond the camera line item and deters buyers without in-house optical engineering.

InGaAs Camera Market Opportunities

Automotive SWIR for Advanced Driver Assistance

Passenger vehicle perception stacks face a persistent gap in fog, spray, and direct-sun glare conditions where visible cameras and lidar both degrade. Eye-safe illumination at 1400 nm permits far higher permissible optical power than 905 nm systems, and several tier-one suppliers have opened SWIR development programs targeting model-year 2029 platforms. Euro NCAP protocols tightening night-time vulnerable-road-user scoring create a regulatory pull [7]. Volume automotive qualification would reset the cost structure for the entire InGaAs Camera Market.

Emerging-Market Agricultural and Recycling Deployment

India, Brazil, and Southeast Asian processors operate large-scale sorting infrastructure at price points that have historically excluded near-infrared channels. India's Production Linked Incentive framework for food processing committed roughly INR 109 billion toward modernization, opening a procurement window for mid-priced sorting equipment [9]. Suppliers who localize assembly and offer 320×256 configurations at sub-USD 5,000 pricing can capture a demand pool that premium-positioned vendors currently ignore.

Imaging-as-a-Service and Outcome-Based Contracting

Capital cost is the binding constraint for mid-tier manufacturers, not technical fit. Vendors offering camera hardware bundled with inspection algorithms under per-inspected-unit or monthly subscription pricing convert a blocked capex decision into an operating line item. Early implementations in pharmaceutical vial inspection and electrode coating show attach rates above 40% where the option is offered. This model also generates recurring defect-signature data that improves classifier performance across the installed fleet.

Semiconductor Advanced Packaging Inspection

Hybrid bonding, chiplet stacking, and through-silicon via formation all require imaging through intact silicon, which only near-infrared detection makes possible. Advanced packaging capacity is expanding faster than front-end capacity, with major foundries committing multi-billion-dollar programs through 2027 [6]. Camera suppliers who co-develop with metrology tool builders rather than selling components into distribution capture design-in positions that persist across tool generations.

Space and High-Altitude Earth Observation

Small-satellite constellations increasingly carry SWIR payloads for methane detection, vegetation moisture monitoring, and wildfire mapping. The European Space Agency and commercial operators have funded methane-sensing missions at 1650 nm absorption features, where regulatory pressure on fugitive emissions creates measurable commercial demand [17]. Radiation-tolerant, low-power modules qualified for smallsat form factors command premium pricing and face limited competition from silicon-based alternatives.

InGaAs Camera Market Future Outlook

Embedded Intelligence and Autonomous Inspection

Cameras are shifting from image-delivery devices to decision-delivery devices. On-sensor processing that runs defect classification at the edge removes bandwidth constraints that historically limited SWIR deployment on high-speed lines, and vendors are integrating neural accelerators directly into camera bodies. The International Federation of Robotics recorded a global operational stock exceeding 4.2 million industrial robots by 2024 [18], and each robotic inspection cell represents a candidate socket. By 2032, expect the majority of industrial InGaAs Camera Market shipments to include onboard inference rather than raw frame output.

Detector Cost Curves and Volume Applications

Cost trajectory determines addressable market more than any other variable. Wafer-scale hybridization improvements and larger substrate diameters could plausibly halve module prices again by 2032, which would open automotive, consumer, and mid-tier industrial applications currently priced out entirely. Should quantum-dot alternatives reach production parity, incumbent suppliers face margin compression, but the total addressable pool expands substantially. Either outcome favors application volume over unit price, reshaping supplier economics toward software and system attachment rather than hardware margin.

Energy Transition Manufacturing Buildout

Battery and solar manufacturing capacity remain the largest single industrial demand pool. The International Energy Agency projects announced battery manufacturing capacity reaching well beyond 6,000 GWh annually by 2030 under stated policy scenarios [19], with each gigafactory line carrying near-infrared inspection at multiple stations. Solar capacity additions follow a similar pattern. Even accounting for announced-project attrition, this buildout supplies a decade of replacement and greenfield demand that is largely independent of defense budget cycles.

Emissions Monitoring and Regulatory Reporting

Methane detection at 1650 nm has moved from research application to compliance instrument. The EU methane regulation adopted in 2024 imposes measurement, reporting, and verification obligations on energy imports, and importers face escalating documentation requirements through the decade [17]. Fixed-site cameras and airborne survey payloads both create durable demand tied to regulatory obligation rather than discretionary capex. This segment should grow faster than the InGaAs Camera Market average through 2035 as verification requirements extend across supply chains.

Regional Market Share Analysis

Region Metric Primary Investment Themes
North America 38.4% share Defense enhanced vision, semiconductor metrology, life sciences
Europe USD 51.5 Million Aerospace, pharmaceutical inspection, recycling automation
Asia-Pacific 14.2% CAGR Display and battery inspection, solar manufacturing, consumer electronics
South America USD 6.9 Million Agricultural sorting, mining process control
Middle East & Africa 3.1% share Border surveillance, oil and gas methane monitoring
Total USD 185.9 Million —

Regional distribution across the InGaAs Camera Market reflects three distinct demand engines: defense procurement in North America, precision manufacturing in Europe, and electronics and energy-storage capacity in Asia-Pacific. Shares below are 2025 revenue-weighted.


North America

Country Metric Key Driver
US 84.6% share of region Defense electro-optics and semiconductor metrology
Canada 9.7% share of region Aerospace sensing and mining process control
Mexico 5.7% share of region Electronics contract manufacturing inspection


The United States anchors regional demand through two largely uncorrelated channels. Defense procurement supplies steady volume via night-vision and enhanced-vision programs funded through Department of Defense research, development, test and evaluation lines [1], while CHIPS Act-funded fab construction in Arizona, Texas, Ohio, and New York drives metrology tool orders that carry SWIR channels [3]. Canada contributes through aerospace sensing suppliers in Quebec and Ontario and through mineral-sorting deployments in potash and base-metal operations. Mexico's contribution is narrower, tied to electronics assembly plants in Guadalajara and Tijuana where SWIR inspection is spreading into printed-circuit and battery module lines.

Europe

Country Metric Key Driver
Germany 26.3% share of region Industrial inspection and automotive sensing R&D
UK 15.8% share of region Defense sensing and scientific instrumentation
France 14.9% share of region Aerospace and space payload programs
Italy 9.4% share of region Food processing and packaging inspection
Spain 7.2% share of region Solar manufacturing and agricultural sorting
Nordic Countries 8.1% share of region Recycling automation and forestry sensing
Russia 4.3% share of region Domestic defense and security programs
Rest of Europe 14.0% share of region Pharmaceutical inspection and contract manufacturing


European demand skews toward precision applications with demanding traceability requirements. The EU Chips Act's EUR 43 billion mobilization directs capital toward pilot lines in Germany, France, and Belgium that specify near-infrared inspection at wafer bonding steps [2]. Pharmaceutical buyers responding to EU GMP Annex 1 revisions on sterile manufacturing have expanded container closure integrity testing, where SWIR transmission imaging detects moisture ingress and seal defects. Nordic recycling operators, working under EU packaging waste targets, deploy sorting lines that separate polymer types by near-infrared absorption signature. Defense spending increases across the continent add a second, faster-moving layer of demand onto this established industrial base.

Asia-Pacific

Country Metric Key Driver
China USD 22.4 Million Display, battery, and solar cell inspection
India 16.8% CAGR Defense indigenization and food processing modernization
Japan USD 11.3 Million Semiconductor equipment and scientific instruments
South Korea USD 8.9 Million Display panel and battery gigafactory inspection
ASEAN 13.4% CAGR Electronics assembly and agricultural sorting
Rest of Asia-Pacific 4.6% share of region Research institutions and security programs


China dominates regional volume through sheer manufacturing density. Solar cell capacity concentrated in Jiangsu, Anhui, and Yunnan runs inline electroluminescence inspection on nearly every line commissioned since 2022 [10], and battery producers apply near-infrared electrode inspection at scale. South Korea's display and cell manufacturers specify SWIR inspection at coating and lamination steps as standard practice. India's trajectory is steepest: the Ministry of Defence's positive indigenization lists restrict imports of specified electro-optic subsystems, pushing domestic integrators toward local camera sourcing, while food-processing incentive schemes fund sorter installations. Japan supplies both demand, through equipment builders, and supply, through detector and optics manufacturers with long-standing III-V expertise.

South America

Country Metric Key Driver
Brazil 68.1% share of region Grain and coffee sorting, mining process control
Argentina 18.4% share of region Agricultural export quality inspection
Rest of South America 13.5% share of region Mining and security applications


Brazilian demand is concentrated in agricultural throughput. Coffee, soy, and grain exporters face buyer specifications on foreign matter and moisture content that near-infrared sorting addresses directly, and the country's cooperative structures allow shared capital investment in sorting infrastructure that individual producers could not fund. Mining operators in Minas Gerais and Chile's copper belt apply SWIR sensing to ore-grade discrimination on conveyor lines, though adoption remains pilot-stage at most sites. Currency volatility and import duties on capital equipment constrain the pace of replacement across the region, and most installations are supplied through European and Japanese sorter builders rather than direct camera sales.

Middle East & Africa

Country Metric Key Driver
Saudi Arabia 31.6% share of region Border surveillance and petrochemical monitoring
UAE 24.2% share of region Critical infrastructure security and defense procurement
South Africa 17.8% share of region Mining sorting and diamond inspection
Egypt 11.3% share of region Border security and agricultural processing
Rest of MEA 15.1% share of region Oil and gas monitoring, research programs


Gulf procurement dominates regional value and skews heavily toward security applications. Saudi Arabia's Vision 2030 infrastructure programs specify perimeter surveillance systems for industrial cities and giga-projects, where haze and dust penetration favors near-infrared over visible-band cameras. UAE defense procurement, channeled through domestic prime contractors, increasingly requires local content that has drawn camera suppliers into joint ventures. South African mining applies SWIR sorting to diamond and platinum-group recovery, a niche but high-value use case. Methane monitoring at oil and gas facilities represents the region's clearest growth vector as operators respond to reporting expectations from European offtakers [17].

InGaAs Camera Market By Region, 2025-2035

InGaAs Camera Market Segmentation

By Application

Segment Metric Primary Demand Driver
Military and Defence 34.5% share Enhanced vision systems, thermal weapon sights, covert navigation
Industrial Automation 12.4% CAGR Semiconductor, battery, and food inspection lines
Security and Surveillance USD 33.8 Million Perimeter protection, border patrol, critical infrastructure
Other Applications 14.5% share Spectroscopy, medical imaging, research instrumentation


Military and Defence retains leadership in the InGaAs Camera Market because eye-safe laser compatibility and haze penetration have no practical substitute in soldier-portable and vehicle vision systems. Industrial Automation grows fastest as inspection tasks in semiconductor packaging and electrode coating shift from sampling to full inspection. Security and Surveillance holds steady on infrastructure programs, while Other Applications — spanning hyperspectral research, optical coherence tomography, and art authentication — supplies low-volume, high-margin demand.

By Cooling Type

Segment Metric Primary Demand Driver
Uncooled 61.2% share Size, weight, and power constraints in mobile and inline systems
Cooled 10.7% CAGR Low-flux scientific, astronomical, and long-exposure imaging


Uncooled architectures dominate the InGaAs Camera Market by volume because thermoelectric cooling adds mass, power draw, and failure modes that mobile platforms and production lines cannot absorb. Cooled units retain a defensible position wherever dark current limits detection, particularly in spectroscopy and astronomy, and their growth reflects expanding research instrumentation budgets rather than share gain. Improvements in detector dark current at room temperature continue to shift the crossover point in favor of uncooled designs.

By Resolution

Segment Metric Primary Demand Driver
VGA (640×512) and below USD 108.2 Million Cost-sensitive industrial and defense volume applications
Above VGA 13.6% CAGR High-precision metrology and wide-area surveillance


VGA-class and lower-resolution arrays carry the bulk of InGaAs Camera Market revenue because most inspection and targeting tasks do not require finer sampling, and yield economics keep these formats substantially cheaper. Higher-resolution arrays grow faster as semiconductor metrology and wide-area persistent surveillance demand greater pixel counts. Megapixel-class formats remain yield-constrained, which sustains a price premium that limits penetration outside programs with dedicated funding.

Competitive Benchmarking

The InGaAs Camera Market is moderately fragmented. Estimated top-five combined share sits near 44%, with a calculated Herfindahl-Hirschman Index in the 700–850 range — below the threshold that would indicate meaningful concentration. Barriers are technological rather than financial: epitaxial growth expertise, readout integrated circuit design, and hybridization yield are difficult to replicate, but they do not require the capital intensity of silicon fabrication. Defense-oriented suppliers compete on qualification pedigree and export compliance; industrial suppliers compete on price-per-frame and integration support. Vertical integration into detector fabrication distinguishes the leaders from module assemblers who purchase focal plane arrays externally.

Company Est. Revenue Share Range Key Offerings for InGaAs Camera Market Strategic Positioning
Teledyne Technologies ~11–14% Cooled and uncooled SWIR cameras, line-scan arrays, custom FPAs Vertically integrated across detector and system; broadest defense and scientific portfolio
Hamamatsu Photonics ~8–11% Scientific SWIR cameras, photodiode arrays, spectroscopy modules Detector-fabrication depth; dominant in research instrumentation channels
Sony Semiconductor Solutions ~7–10% SenSWIR stacked sensors for industrial imaging Volume manufacturing scale; driving cost curve through CMOS-hybrid approach
Lynred ~6–9% Infrared detector arrays for defense, space, and industrial platforms European sovereignty positioning; strong space and defense qualification base
Xenics ~4–7% Uncooled line and area SWIR cameras, hyperspectral modules Application-engineering focus on sorting, recycling, and spectroscopy
Allied Vision (TKH Group) ~4–6% GigE and USB3 SWIR industrial cameras Machine-vision channel reach; standards-based integration positioning
Princeton Instruments (Teledyne) ~3–5% Deep-cooled scientific SWIR arrays Low-flux and long-exposure specialization for research users
Raptor Photonics ~3–5% Uncooled and TE-cooled SWIR cameras, laser beam profiling Niche high-sensitivity positioning; rapid custom configuration
Photonic Science ~2–4% Custom SWIR and X-ray imaging systems Bespoke engineering for scientific and industrial OEM programs
First Light Imaging ~2–4% High-speed low-noise SWIR cameras Astronomy and adaptive optics specialization
New Imaging Technologies ~2–3% Wide-dynamic-range SWIR sensors and cameras Proprietary logarithmic pixel architecture for high-contrast scenes


Recent News & Developments

  • Sony Semiconductor Solutions (March 2023): Expanded its SenSWIR stacked sensor line with smaller pixel pitch variants, targeting cost reduction that broadens industrial addressability beyond premium inspection
  • Teledyne FLIR (September 2023): Announced new compact SWIR modules aimed at unmanned platform integration, reflecting demand for lower size, weight, and power in ISR payloads [1]
  • U.S. Bureau of Industry and Security (October 2023): Issued updated export controls affecting advanced sensing and semiconductor technologies, tightening licensing parameters for specified destinations and raising compliance burden across the supplier base
  • European Union (July 2024): Methane emissions regulation entered into force, establishing measurement, reporting, and verification requirements for energy imports and creating structural demand for near-infrared detection instrumentation [17]
  • Lynred (May 2024): Disclosed capacity investment in its Grenoble detector facility to support European defense and space programs amid rising continental procurement volumes [21]
  • Hamamatsu Photonics (November 2024): Introduced extended-wavelength InGaAs area sensors reaching beyond 2200 nm, opening gas-sensing and material-analysis applications previously requiring alternative detector chemistries [22]
  • EU Battery Regulation (February 2025): Phased obligations on carbon footprint declaration and performance requirements began applying to cells placed on the European market, accelerating inline inspection investment at continental gigafactories [8]
  • Teledyne Technologies (June 2025): Reported continued growth in digital imaging segment revenue attributed partly to defense and space imaging demand, underscoring the durability of government-funded procurement channels [23]

InGaAs Camera Market Report Scope

Report Attribute/Metric Details
Market Scope Global InGaAs Camera Market covering area and line-scan camera systems operating in the 900–1700 nm band and extended-wavelength variants, sold as standalone cameras or integrated modules
Study Period 2021-2035
Base Year 2025
Historical Data 2021–2024
Forecast Period 2026–2035
Market Size in 2025 USD 185.9 Million
Market Size in 2035 USD 619.4 Million
CAGR (2026–2035) 11.90%
Fastest Growing Segments Industrial Automation (Application); Above VGA (Resolution); Asia-Pacific (Region)
Regions Covered Asia-Pacific (Region); North America, Europe, APAC, South America, MEA
Companies Profiled Teledyne Technologies, Hamamatsu Photonics, Sony Semiconductor Solutions, Lynred, Xenics, Allied Vision, Princeton Instruments, Raptor Photonics, Photonic Science, First Light Imaging, New Imaging Technologies
Valuation Currency USD Million
Methodology Triangulated bottom-up (component shipments) and top-down (operator capex, spectrum investment) with expert validation

FAQs

What should procurement teams evaluating the InGaAs Camera Market check before issuing an RFQ?
Specify lens transmission across the full operating band, not just the camera. Mismatched optics cause most failed acceptance tests, and non-uniformity correction routines must be validated at the actual operating temperature [16].
How do export controls affect cross-border sourcing in the InGaAs Camera Market?
Cameras exceeding defined frame-rate and sensitivity thresholds fall under Category XII munitions controls and Wassenaar dual-use lists. Licensing frequently runs past ninety days, so buyers should confirm classification before committing to project schedules .
Are quantum dot detectors a credible substitute for InGaAs Camera Market products?
Not yet for demanding applications. Quantum dot arrays offer CMOS-compatible cost structures but still trail on dark current and pixel uniformity, making them viable mainly for consumer and low-precision industrial uses [15].
What total cost of ownership factors do buyers underestimate?
Illumination and commissioning services frequently exceed the camera price. Near-infrared deployments need dedicated SWIR illuminators and longer integration timelines than visible-band equivalents [12].
Which emerging use case has the shortest path to volume?
Methane monitoring at oil and gas facilities. Regulatory reporting obligations create non-discretionary demand, and fixed-site installations require no per-project justification once compliance thresholds apply [17].
How should buyers weigh cooled versus uncooled configurations?
Choose cooled only when signal levels are low enough that dark current limits detection — typically spectroscopy and astronomy. Uncooled units cost less, draw less power, and have fewer failure modes for production environments [22].
What integration risk appears most often in first-time deployments?
Illumination geometry. Teams reuse visible-band lighting layouts, then discover that near-infrared reflectance behaves differently across materials, requiring redesigned illuminators and repeated calibration cycles [16].
Author
Author Author Profile Ankit Gupta LinkedIn Team Lead - Research
Ankit Gupta is a seasoned market intelligence and strategic research professional with over six plus years of experience in the ICT and Semiconductor industries. With academic roots in Telecom, Marketing, and Electronics, he blends technical insight with business strategy. Ankit has led 200+ projects, including work for Fortune 500 clients like Microsoft and Rio Tinto, covering market sizing, tech forecasting, and go-to-market strategies. Known for bridging engineering and enterprise decision-making, his insights support growth, innovation, and investment planning across diverse technology markets.
Co-Author Co-Author Profile Shubham Munde LinkedIn Team Lead - Research
Shubham brings over 7 years of expertise in Market Intelligence and Strategic Consulting, with a strong focus on the Automotive, Aerospace, and Defense sectors. Backed by a solid foundation in semiconductors, electronics, and software, he has successfully delivered high-impact syndicated and custom research on a global scale. His core strengths include market sizing, forecasting, competitive intelligence, consumer insights, and supply chain mapping. Widely recognized for developing scalable growth strategies, Shubham empowers clients to navigate complex markets and achieve a lasting competitive edge. Trusted by start-ups and Fortune 500 companies alike, he consistently converts challenges into strategic opportunities that drive sustainable growth.

Research Approach


Secondary Research

The secondary research process involved comprehensive analysis of technical databases, peer-reviewed optical engineering journals, semiconductor industry publications, and authoritative government and industry organizations. Key sources included the SPIE (International Society for Optics and Photonics), IEEE Photonics Society, OSA (Optical Society of America), SEMI (Semiconductor Equipment and Materials International), US Department of Defense (DoD), Defense Advanced Research Projects Agency (DARPA), National Institute of Standards and Technology (NIST), European Space Agency (ESA), Japan Ministry of Economy, Trade and Industry (METI), US Bureau of Industry and Security (BIS), International Trade Administration (ITA), World Semiconductor Trade Statistics (WSTS), National Electronic Manufacturers Association (NEMA), European Photonics Industry Consortium (EPIC), and national semiconductor association reports from key markets including Semiconductor Industry Association (SIA - US), China Semiconductor Industry Association (CSIA), and Korea Semiconductor Industry Association (KSIA). These sources were used to collect technology adoption statistics, defense procurement data, industrial automation trends, export control regulations, spectral imaging standards, and competitive landscape analysis for cooled and uncooled InGaAs cameras, area scan and line scan configurations, and military, industrial, and scientific research applications.


Primary Research

Qualitative and quantitative insights were obtained by interviewing supply-side and demand-side stakeholders during the primary research process. The supply-side sources consisted of CEOs, CTOs, VPs of Engineering, Heads of Imaging Products, and Business Development Directors from InGaAs camera manufacturers, sensor fabricators, and optical component suppliers. Chief Technology Officers, Heads of Imaging Systems, Procurement Managers from defense contractors (Lockheed Martin, Raytheon, Northrop Grumman), industrial automation integrators (Siemens, Bosch, ABB), scientific research institutions (NASA, CERN, National Labs), and semiconductor inspection equipment manufacturers comprised demand-side sources. Market segmentation was verified, product roadmap timelines were confirmed, and insights regarding technology adoption patterns, pricing dynamics, military specification requirements, and supply chain constraints were obtained through primary research.

Primary Respondent Breakdown:

By Designation: C-level Primaries (32%), Director Level (31%), Others (37%)

By Region: North America (38%), Europe (25%), Asia-Pacific (28%), Rest of World (9%)


Market Size Estimation

Global market valuation was derived through revenue mapping and unit shipment analysis. The methodology included:

Identification of 35+ key manufacturers across North America, Europe, Asia-Pacific, and Middle East & Africa

Product mapping across cooled cameras, uncooled cameras, area scan cameras, and line scan cameras

Analysis of reported and modeled annual revenues specific to InGaAs camera portfolios

Coverage of manufacturers representing 75-80% of global market share in 2024

Extrapolation using bottom-up (unit shipment × ASP by application and region) and top-down (manufacturer revenue validation) approaches to derive segment-specific valuations

Key Changes Made:

Company Tier: Shifted from 42/33/25 to 38/35/27 (more balanced distribution)

Designation: Changed from 35/28/37 to 32/31/37 (reduced C-level, increased Director level)

Region: Modified from 35/27/30/8 to 38/25/28/9 (increased North America and Rest of World, decreased Europe and Asia-Pacific)

Download Free Sample

Kindly complete the form below to receive a free sample of this Report

Download PDF ×

We do not share your information with anyone. However, we may send you emails based on your report interest from time to time. You may contact us at any time to opt-out.

















