Sheet Metal Market (2026 - 2035)

ID: MRFR/CnM/7112-HCR 111 Pages Chitranshi Jaiswal Last Updated: October 27, 2026
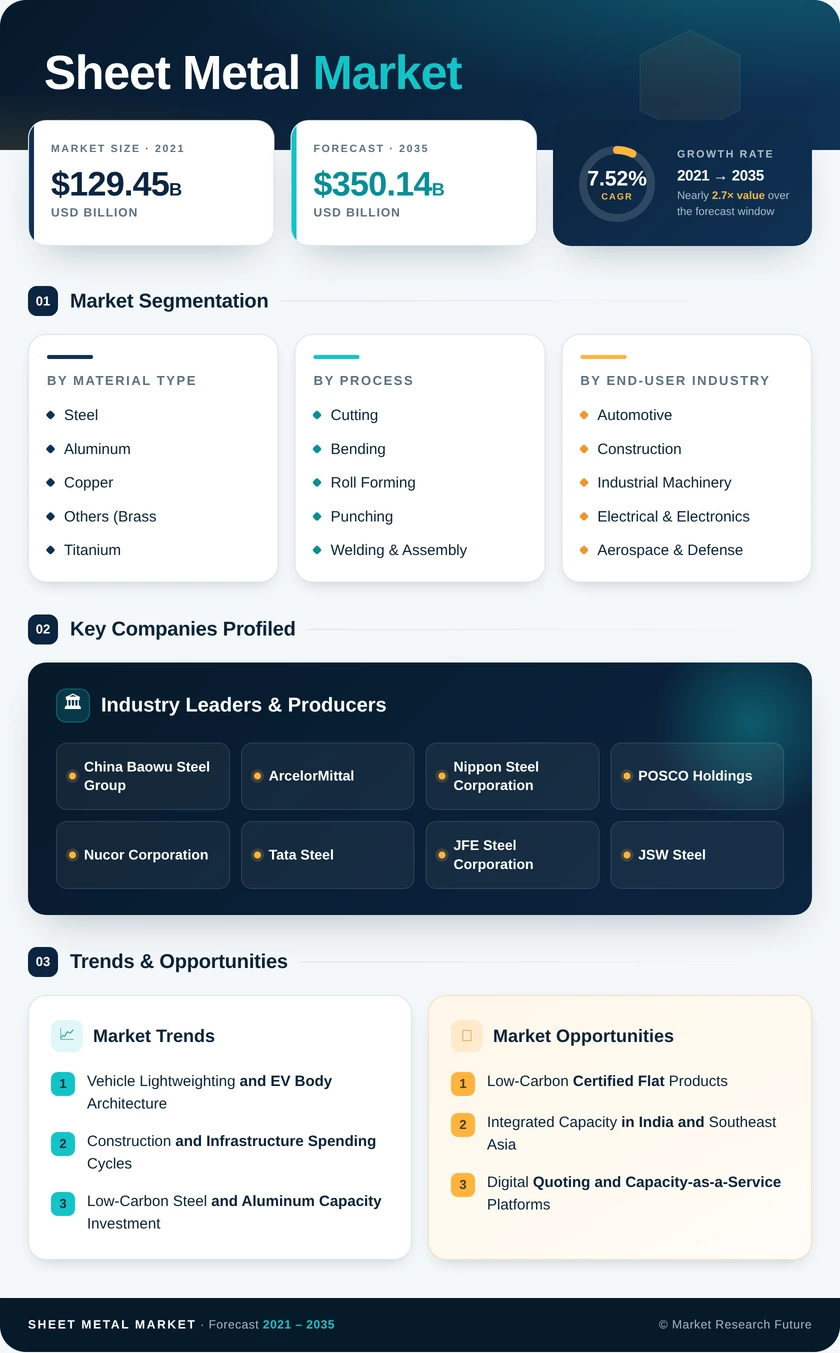
Sheet Metal Market Research Report Information By Material Type (Steel, Aluminum, Copper, and Others (Brass, Titanium, Alloys)), By Process (Cutting, Bending, Roll Forming, Punching, and Welding & Assembly), and By End-User Industry (Automotive, Construction, Industrial Machinery, Electrical & Electronics, Aerospace & Defense, and Others) – Forecast Till 2035.
Sheet Metal Market
Market Size
Forecast Period2026-2035
CAGR (2026-2035)7.52%
2025 Market SizeUSD 178.02 Billion
2035 Market SizeUSD 350.14 Billion
Key Players
China Baowu Steel Group
ArcelorMittal
Nippon Steel Corporation
POSCO Holdings
Nucor Corporation
Tata Steel
Opportunities
  • Low-Carbon Certified Flat Products
  • Integrated Capacity in India and Southeast Asia
  • Digital Quoting and Capacity-as-a-Service Platforms
  1. 1 Market Overview | |
    1. 1.1 Study Assumptions & Market Definition | |
    2. 1.2 Scope of the Study | |
    3. 1.3 Research Methodology | |
  2. 2 Market Summary & Key Takeaways | |
    1. 2.1 By Material Type | |
    2. 2.2 By Process | |
    3. 2.3 By End-User Industry | |
    4. 2.4 By Geography | |
  3. 3 Market Size & Forecast (2021–2035) | |
    1. 3.1 Historical Market Size (2021–2025) | |
    2. 3.2 Current & Forecast Market Size (2026–2035) | |
    3. 3.3 Market Size by Revenue (USD Billion) | |
    4. 3.4 Year-over-Year Growth Analysis | |
  4. 4 Market Drivers Analysis | |
    1. 4.1 Vehicle Lightweighting and EV Body Architecture | |
    2. 4.2 Construction and Infrastructure Spending Cycles | |
    3. 4.3 Low-Carbon Steel and Aluminum Capacity Investment | |
    4. 4.4 Automation of Cutting and Forming Operations | |
    5. 4.5 Electrical Steel Demand from Grid and Motor Build-Out | |
    6. 4.6 Reshoring and Supply Chain Regionalization | |
    7. 4.7 Data Center and Electronics Enclosure Growth | |
  5. 5 Market Restraints Analysis | |
    1. 5.1 Steel and Aluminum Price Volatility | |
    2. 5.2 Energy Cost Exposure in Melting and Rolling | |
    3. 5.3 Skilled Operator and Welder Shortages | |
    4. 5.4 Capital Intensity of Line Modernization | |
    5. 5.5 Substitution by Composites and Polymers | |
  6. 6 Market Opportunity Analysis | |
    1. 6.1 Low-Carbon Certified Flat Products | |
    2. 6.2 Integrated Capacity in India and Southeast Asia | |
    3. 6.3 Digital Quoting and Capacity-as-a-Service Platforms | |
    4. 6.4 Electrical Steel and Transformer Core Supply | |
    5. 6.5 Scrap-Based Circular Supply Chains | |
    6. 6.6 Industry Value Chain Analysis | |
    7. 6.7 Porter's Five Forces Analysis | |
  7. 7 Regional Analysis | |
    1. 7.1 North America | | |
      1. 7.1.1 US | | |
      2. 7.1.2 Canada | | |
      3. 7.1.3 Mexico | |
    2. 7.2 Europe | | |
      1. 7.2.1 Germany | | |
      2. 7.2.2 UK | | |
      3. 7.2.3 France | | |
      4. 7.2.4 Italy | | |
      5. 7.2.5 Spain | | |
      6. 7.2.6 Nordic Countries | | |
      7. 7.2.7 Russia | | |
      8. 7.2.8 Rest of Europe | |
    3. 7.3 Asia-Pacific | | |
      1. 7.3.1 China | | |
      2. 7.3.2 India | | |
      3. 7.3.3 Japan | | |
      4. 7.3.4 South Korea | | |
      5. 7.3.5 ASEAN | | |
      6. 7.3.6 Rest of Asia-Pacific | |
    4. 7.4 South America | | |
      1. 7.4.1 Brazil | | |
      2. 7.4.2 Argentina | | |
      3. 7.4.3 Rest of South America | |
    5. 7.5 Middle East & Africa | | |
      1. 7.5.1 Saudi Arabia | | |
      2. 7.5.2 UAE | | |
      3. 7.5.3 South Africa | | |
      4. 7.5.4 Egypt | | |
      5. 7.5.5 Rest of MEA | |
  8. 8 Future Outlook (2026–2035) | |
    1. 8.1 Autonomous Fabrication Cells and Machine Learning Nesting | |
    2. 8.2 The Electrification Supercycle | |
    3. 8.3 Embedded Carbon Accounting as a Commercial Requirement | |
    4. 8.4 Consolidation of the Fabrication Middle Tier | |
  9. 9 Segmentation Analysis | |
    1. 9.1 By Material Type | | |
      1. 9.1.1 Steel | | |
      2. 9.1.2 Aluminum | | |
      3. 9.1.3 Copper | | |
      4. 9.1.4 Others (Brass, Titanium, Alloys) | |
    2. 9.2 By Process | | |
      1. 9.2.1 Cutting | | |
      2. 9.2.2 Bending | | |
      3. 9.2.3 Roll Forming | | |
      4. 9.2.4 Punching | | |
      5. 9.2.5 Welding & Assembly | |
    3. 9.3 By End-User Industry | | |
      1. 9.3.1 Automotive | | |
      2. 9.3.2 Construction | | |
      3. 9.3.3 Industrial Machinery | | |
      4. 9.3.4 Electrical & Electronics | | |
      5. 9.3.5 Aerospace & Defense | | |
      6. 9.3.6 Others | |
  10. 10 Competitive Landscape | |
    1. 10.1 Market Concentration Analysis (2026) | |
    2. 10.2 Competitive Benchmarking Matrix | |
    3. 10.3 Company Profiles | | |
      1. 10.3.1 China Baowu Steel Group | | |
      2. 10.3.2 ArcelorMittal | | |
      3. 10.3.3 Nippon Steel Corporation | | |
      4. 10.3.4 POSCO Holdings | | |
      5. 10.3.5 Nucor Corporation | | |
      6. 10.3.6 Tata Steel | | |
      7. 10.3.7 JFE Steel Corporation | | |
      8. 10.3.8 JSW Steel | | |
      9. 10.3.9 Novelis (Hindalco) | | |
      10. 10.3.10 Cleveland-Cliffs | | |
      11. 10.3.11 Steel Dynamics | | |
      12. 10.3.12 Constellium | |
  11. 11 Recent Developments & News | |
  12. 12 Report Scope & Methodology | |
    1. 12.1 Study Period & Base Year | |
    2. 12.2 Valuation Currency & Assumptions | |
    3. 12.3 Abbreviations | |
  13. 13 Detailed Sources & Citations | |
  14. 14 Frequently Asked Questions (FAQs) | | LIST OF TABLES | |
  15. TABLE 1 Global Sheet Metal Market Size & Forecast, by Revenue (USD Billion), 2021–2035 | |
  16. TABLE 2 Global Sheet Metal Market – Year-over-Year Growth Analysis, 2021–2035 | |
  17. TABLE 3 Global Sheet Metal Market – Driver Impact Analysis, 2026–2035 | |
  18. TABLE 4 Global Sheet Metal Market – Restraint Impact Analysis, 2026–2035 | |
  19. TABLE 5 Global Sheet Metal Market Size, by Material Type, 2021–2035 (USD Billion) | |
  20. TABLE 6 Global Sheet Metal Market Size, by Process, 2021–2035 (USD Billion) | |
  21. TABLE 7 Global Sheet Metal Market Size, by End-User Industry, 2021–2035 (USD Billion) | |
  22. TABLE 8 Global Sheet Metal Market Size, by Region, 2021–2035 (USD Billion) | |
  23. TABLE 9 North America Sheet Metal Market Size, by Country, 2021–2035 (USD Billion) | |
  24. TABLE 10 Europe Sheet Metal Market Size, by Country, 2021–2035 (USD Billion) | |
  25. TABLE 11 Asia-Pacific Sheet Metal Market Size, by Country, 2021–2035 (USD Billion) | |
  26. TABLE 12 South America Sheet Metal Market Size, by Country, 2021–2035 (USD Billion) | |
  27. TABLE 13 Middle East & Africa Sheet Metal Market Size, by Country, 2021–2035 (USD Billion) | |
  28. TABLE 14 North America Sheet Metal Market Size, by Material Type, 2021–2035 (USD Billion) | |
  29. TABLE 15 North America Sheet Metal Market Size, by Process, 2021–2035 (USD Billion) | |
  30. TABLE 16 North America Sheet Metal Market Size, by End-User Industry, 2021–2035 (USD Billion) | |
  31. TABLE 17 Europe Sheet Metal Market Size, by Material Type, 2021–2035 (USD Billion) | |
  32. TABLE 18 Europe Sheet Metal Market Size, by Process, 2021–2035 (USD Billion) | |
  33. TABLE 19 Europe Sheet Metal Market Size, by End-User Industry, 2021–2035 (USD Billion) | |
  34. TABLE 20 Asia-Pacific Sheet Metal Market Size, by Material Type, 2021–2035 (USD Billion) | |
  35. TABLE 21 Asia-Pacific Sheet Metal Market Size, by Process, 2021–2035 (USD Billion) | |
  36. TABLE 22 Asia-Pacific Sheet Metal Market Size, by End-User Industry, 2021–2035 (USD Billion) | |
  37. TABLE 23 South America Sheet Metal Market Size, by Material Type, 2021–2035 (USD Billion) | |
  38. TABLE 24 South America Sheet Metal Market Size, by Process, 2021–2035 (USD Billion) | |
  39. TABLE 25 South America Sheet Metal Market Size, by End-User Industry, 2021–2035 (USD Billion) | |
  40. TABLE 26 Middle East & Africa Sheet Metal Market Size, by Material Type, 2021–2035 (USD Billion) | |
  41. TABLE 27 Middle East & Africa Sheet Metal Market Size, by Process, 2021–2035 (USD Billion) | |
  42. TABLE 28 Middle East & Africa Sheet Metal Market Size, by End-User Industry, 2021–2035 (USD Billion) | |
  43. TABLE 29 US Sheet Metal Market Size, by Material Type and Process, 2021–2035 (USD Billion) | |
  44. TABLE 30 China Sheet Metal Market Size, by Material Type and Process, 2021–2035 (USD Billion) | |
  45. TABLE 31 India Sheet Metal Market Size, by Material Type and Process, 2021–2035 (USD Billion) | |
  46. TABLE 32 Germany Sheet Metal Market Size, by Material Type and Process, 2021–2035 (USD Billion) | |
  47. TABLE 33 Japan Sheet Metal Market Size, by Material Type and Process, 2021–2035 (USD Billion) | |
  48. TABLE 34 Competitive Benchmarking Matrix – Global Sheet Metal Market, 2026 | |
  49. TABLE 35 Company Profiles – Key Players, Global Sheet Metal Market | |
  50. TABLE 36 Recent Developments & Strategic Announcements, 2023–2025 | |
  51. TABLE 37 Report Scope & Methodology Summary | |
  52. TABLE 38 Detailed Sources & Citations Index | | LIST OF FIGURES | |
  53. FIGURE 1 Global Sheet Metal Market – Market Dynamics Overview (Drivers, Restraints, Opportunities) | |
  54. FIGURE 2 Global Sheet Metal Market – Industry Value Chain Analysis | |
  55. FIGURE 3 Global Sheet Metal Market – Porter's Five Forces Analysis | |
  56. FIGURE 4 Global Sheet Metal Market Size Trend, 2021–2035 (USD Billion) | |
  57. FIGURE 5 Global Sheet Metal Market – Year-over-Year Growth Trend, 2022–2035 (%) | |
  58. FIGURE 6 Global Sheet Metal Market Share, by Material Type, 2025 vs 2035 (%) | |
  59. FIGURE 7 Global Sheet Metal Market Share, by Process, 2025 vs 2035 (%) | |
  60. FIGURE 8 Global Sheet Metal Market Share, by End-User Industry, 2025 vs 2035 (%) | |
  61. FIGURE 9 Global Sheet Metal Market Share, by Region, 2025 (%) | |
  62. FIGURE 10 Regional CAGR Comparison, 2026–2035 (%) | |
  63. FIGURE 11 North America Sheet Metal Market Share, by Country, 2025 (%) | |
  64. FIGURE 12 Europe Sheet Metal Market Share, by Country, 2025 (%) | |
  65. FIGURE 13 Asia-Pacific Sheet Metal Market Share, by Country, 2025 (%) | |
  66. FIGURE 14 South America Sheet Metal Market Share, by Country, 2025 (%) | |
  67. FIGURE 15 Middle East & Africa Sheet Metal Market Share, by Country, 2025 (%) | |
  68. FIGURE 16 Competitive Landscape – Estimated Revenue Share Positioning, 2026 | |
  69. FIGURE 17 Competitive Positioning Matrix – Scale vs Processing Capability | |
  70. FIGURE 18 Driver Impact Weighting on Forecast CAGR, 2026–2035 | |
  71. FIGURE 19 Restraint Impact Weighting on Forecast CAGR, 2026–2035 | |
  72. FIGURE 20 Low-Carbon Flat Product Capacity Additions by Region, 2024–2032

Segmentation Quick Reference

DimensionSub-SegmentsDominant SegmentFastest Growing Segment
By Material TypeSteel; Aluminum; Copper; Others (Brass, Titanium, Alloys)SteelAluminum
By ProcessCutting; Bending; Roll Forming; Punching; Welding & AssemblyCuttingRoll Forming
By End-User IndustryAutomotive; Construction; Industrial Machinery; Electrical & Electronics; Aerospace & Defense; OthersAutomotiveElectrical & Electronics
By GeographyNorth America; Europe; Asia-Pacific; South America; Middle East & AfricaAsia-PacificAsia-Pacific


Market Segmentation Overview

By Material Type

Sub-SegmentKey Trend
SteelShift from blast furnace to electric arc furnace routes; advanced high-strength grades gaining share in automotive body structures
AluminumClosed-loop recycling agreements expanding; battery enclosure and closure applications driving rolled-product demand
CopperElectrification of grids and thermal management pulling busbar and heat-exchanger sheet volumes upward
Others (Brass, Titanium, Alloys)Concentrated in aerospace, marine, and medical uses where corrosion or strength-to-weight requirements exclude commodity grades


Material selection is increasingly a lifecycle decision rather than a unit-cost one. Steel retains structural dominance, but aluminum's growth reflects regulatory pressure on vehicle mass and packaging circularity rather than any broad substitution economics.

By Process

Sub-SegmentKey Trend
CuttingHigh-power fiber lasers displacing CO2 and plasma; automated load/unload reducing operator dependency
BendingServo-electric press brakes with adaptive angle correction; offline programming shortening setup on small batches
Roll FormingContinuous production of building panels and solar mounting rails; standardized profile demand rising
PunchingCombination punch-laser machines improving yield on hole-dense parts
Welding & AssemblyRobotic joining cells and laser welding expanding in structural subassembly production


Process economics now hinge on setup time rather than cycle time, because average batch sizes continue to fall. Investment concentrates where automation removes programming and handling labour from short-run work.

By End-User Industry

Sub-SegmentKey Trend
AutomotiveEV platforms substituting battery enclosures and motor cores for combustion-era components
ConstructionRoofing, cladding, and decking demand tracking infrastructure budgets and interest rate cycles
Industrial MachineryGuarding, frames, and process enclosures growing with global capital equipment spending
Electrical & ElectronicsData center racks, containment, and appliance panels expanding fastest of any sector
Aerospace & DefenseAirframe skins and ground support structures demanding tight tolerance and traceable material
OthersMarine, agriculture, furniture, and medical equipment providing diversified baseline volume


Sector mix protects the market from single-cycle exposure. Automotive supplies scale, construction supplies volume stability, and electronics supplies the growth rate, which together keep aggregate demand less cyclical than any individual end-use suggests.




Download PDF ×

We do not share your information with anyone. However, we may send you emails based on your report interest from time to time. You may contact us at any time to opt-out.