Segmentation Quick Reference
| Dimension | Sub-Segments | Dominant Segment | Fastest Growing Segment |
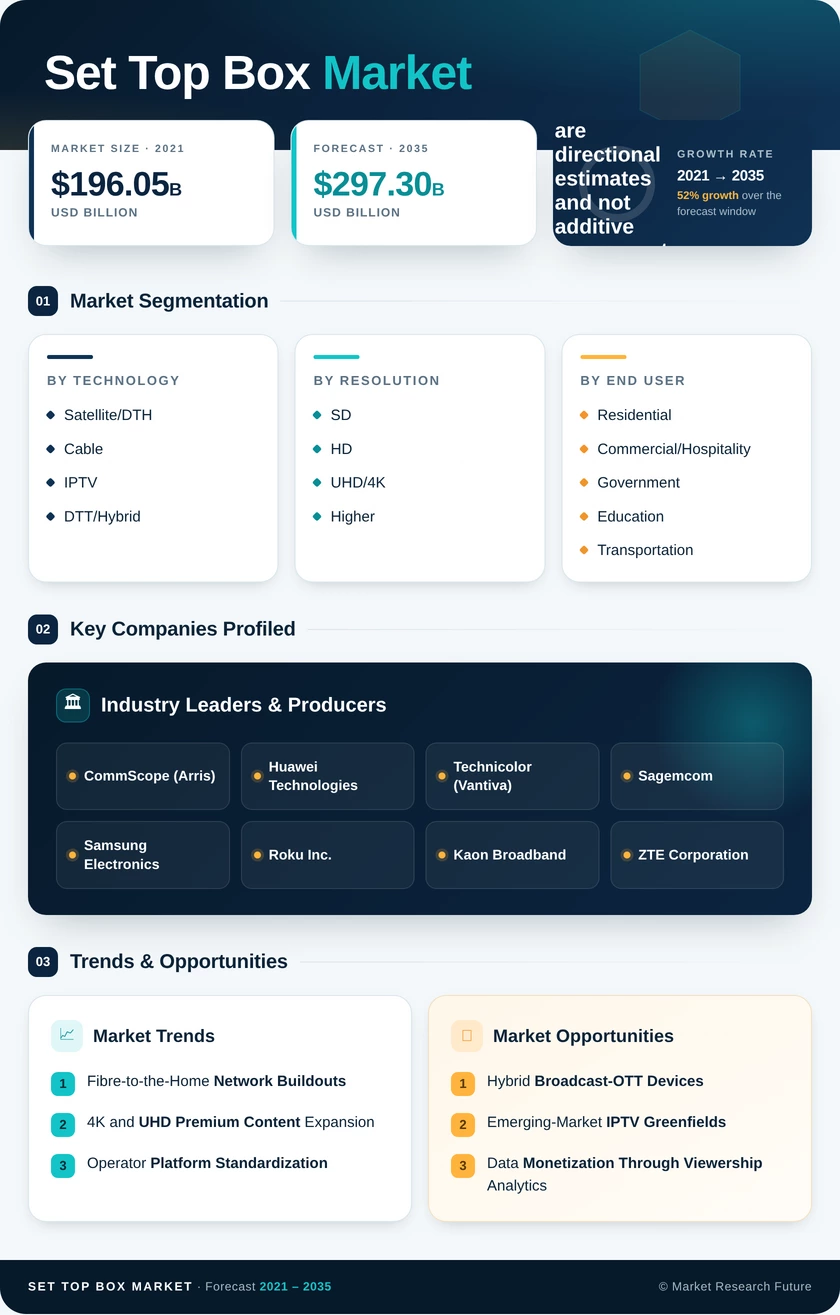
| Set-Top Box Market | Satellite/DTH, Cable, IPTV, DTT/Hybrid | Satellite/DTH | IPTV |
| Resolution | SD, HD, UHD/4K and Higher | HD | UHD/4K and Higher |
| End User | Residential, Commercial/Hospitality, Government and Education, Transportation | Residential | Transportation |
| Operating System | Android TV, Proprietary Linux, Other (RDK, Proprietary) | Android TV | Android TV |
| Geography | North America, Europe, Asia-Pacific, South America, Middle East & Africa | North America | Asia-Pacific |
Market Segmentation Overview
By Set-Top Box Market
| Sub-Segment | Key Trend |
| Satellite/DTH | Retains dominant share through rural and sports-broadcast coverage |
| Cable | MSO 4K fleet upgrades sustain revenue in North America |
| IPTV | Fibre-bundled telco deployments drive fastest technology-segment growth |
| DTT/Hybrid | Government analog switchoff mandates create replacement demand cycles |
The technology segmentation reflects the ongoing platform migration from broadcast-only architectures toward IP-connected and hybrid receiver designs, with IPTV capturing incremental share as fibre networks expand globally.
By Resolution
| Sub-Segment | Key Trend |
| Standard Definition | Declining share, sustained by budget segments in developing markets |
| High Definition | Mainstream default for operator-managed deployments worldwide |
| UHD/4K and Higher | Premium content libraries and falling chipset costs accelerate adoption |
Resolution segmentation tracks the upgrade trajectory from SD to HD and now to UHD, with 4K receivers increasingly positioned as the standard tier for new operator deployments in mature economies.
By End User
| Sub-Segment | Key Trend |
| Residential | Multi-room viewing and whole-home DVR anchor volume demand |
| Commercial/Hospitality | Hotel and venue IPTV modernization generates above-average margins |
| Government and Education | Digital classroom and public-venue broadcasting drive steady procurement |
| Transportation | Airline and rail in-flight entertainment upgrades represent fastest end-user growth |
End-user segmentation highlights the dominance of residential subscribers while underscoring emerging procurement opportunities in hospitality and transportation verticals.
By Operating System
| Sub-Segment | Key Trend |
| Android TV | Turnkey Google platform enables rapid deployment for mid-tier operators |
| Proprietary Linux | Legacy investments sustain share among large cable MSOs |
| Other (RDK, Proprietary) | Operator customization and cost-control drive niche adoption |
Operating-system segmentation captures the platform consolidation trend, with Android TV expanding share as operators prioritize ecosystem breadth and time-to-market efficiency.
By Geography
| Sub-Segment | Key Trend |
| North America | Premium 4K pricing and broadband bundling sustain dominant regional share |
| Europe | IPTV migration and Ecodesign regulation reshape device procurement |
| Asia-Pacific | Fibre buildouts and emerging-market IPTV greenfields drive fastest growth |
| South America | DTT digitization and pay-TV bundling support steady expansion |
| Middle East & Africa | Satellite DTH and hospitality modernization anchor regional demand |
Geographic segmentation reflects the interplay between broadband infrastructure maturity, regulatory frameworks, and content-licensing dynamics that shape receiver demand across regions.