

Semiconductor & Electronics Market Segmentation
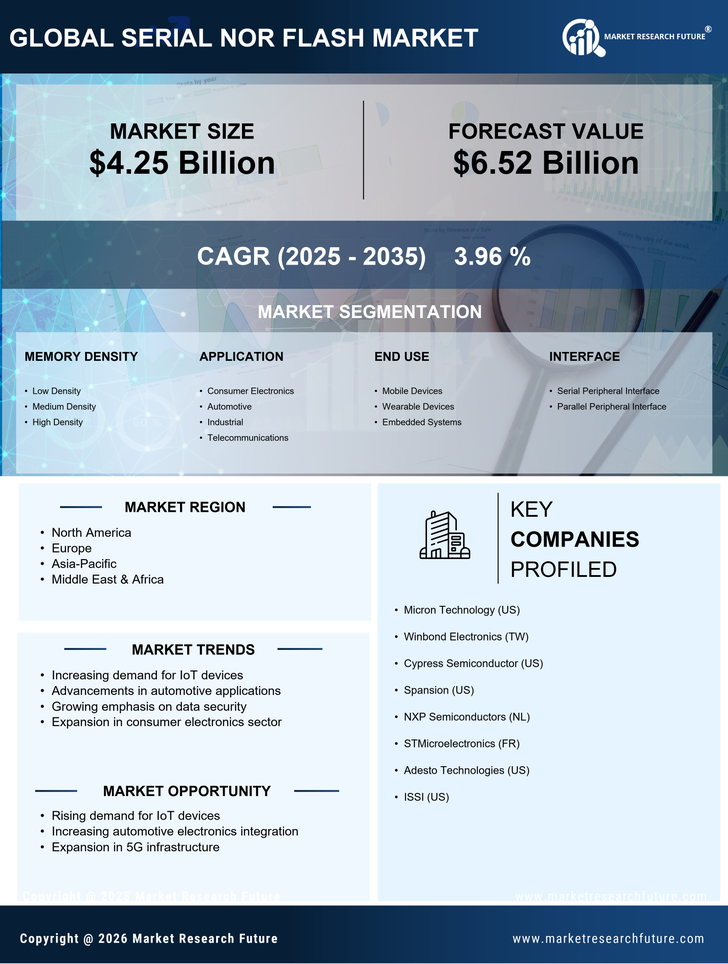
Semiconductor & Electronics By Memory Density (USD Billion, 2025-2035)
- Low Density
- Medium Density
- High Density
Semiconductor & Electronics By Application (USD Billion, 2025-2035)
- Consumer Electronics
- Automotive
- Industrial
- Telecommunications
Semiconductor & Electronics By End Use (USD Billion, 2025-2035)
- Mobile Devices
- Wearable Devices
- Embedded Systems
Semiconductor & Electronics By Interface (USD Billion, 2025-2035)
- Serial Peripheral Interface
- Parallel Peripheral Interface


