Self-Storage Market (2026 – 2035)

ID: MRFR/ICT/10148-HCR 200 Pages Aarti Dhapte Last Updated: October 27, 2026
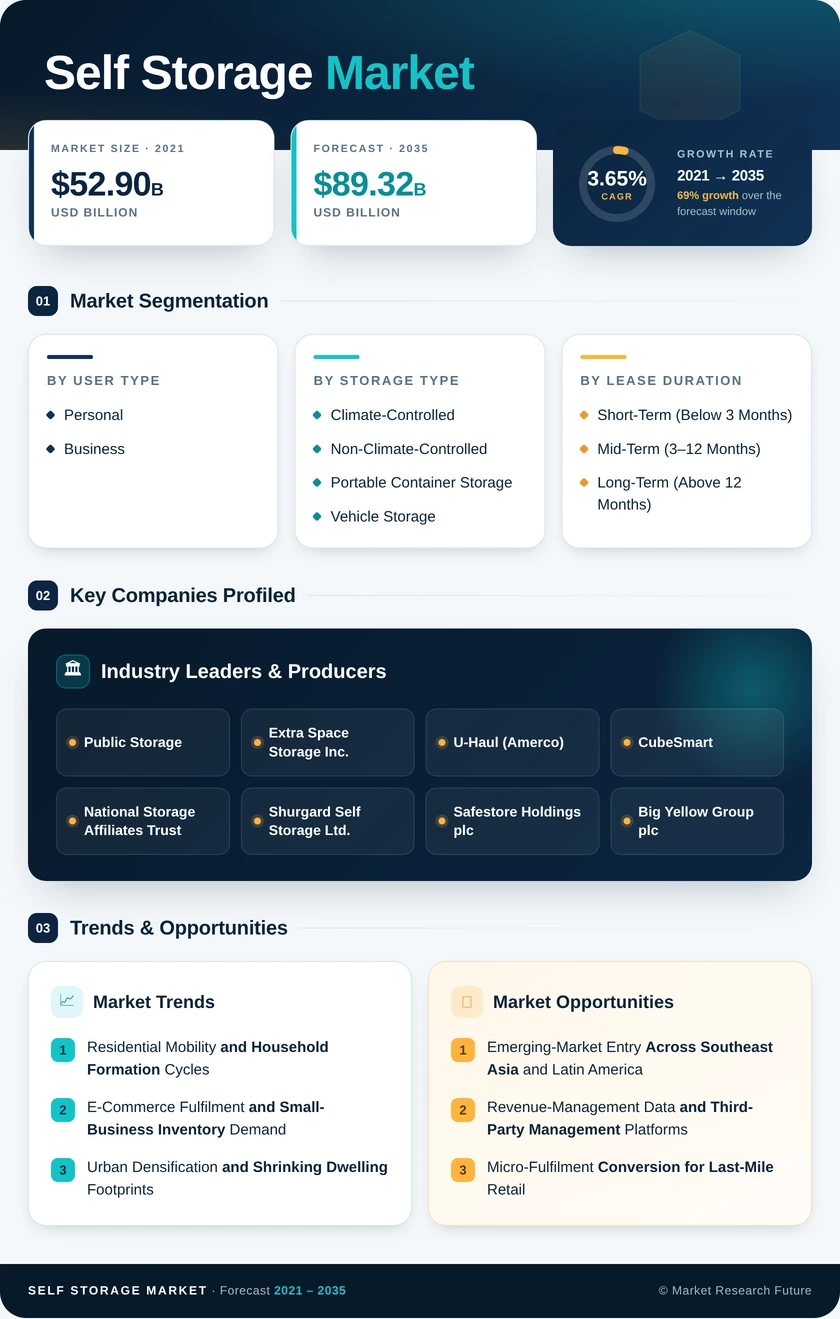
Self-Storage Market Size, Share and Research Report By User Type (Personal and Business), By Storage Type (Climate-Controlled, Non-Climate-Controlled, Portable Container Storage, and Vehicle Storage), By Lease Duration (Short-Term Below 3 Months, Mid-Term 3–12 Months, and Long-Term Above 12 Months), By Unit Size (Small Below 50 sq ft, Medium 50–100 sq ft, Large Above 100 sq ft, and Mega), And By Region (North America, Europe, Asia-Pacific, And Rest Of The World) – Industry Forecast Till 2035
Self-Storage Market
Market Size
Forecast Period2026-2035
CAGR (2026-2035)3.65%
2025 Market SizeUSD 62.40 Billion
2035 Market SizeUSD 89.32 Billion
Key Players
Public Storage
Extra Space Storage Inc.
U-Haul
CubeSmart
National Storage Affiliates Trust
Shurgard Self Storage Ltd.
Opportunities
  • Emerging-Market Entry Across Southeast Asia and Latin America
  • Revenue-Management Data and Third-Party Management Platforms
  • Micro-Fulfilment Conversion for Last-Mile Retail
  1. 1 Market Summary | |
    1. 1.1 Study Assumptions & Market Definition | |
    2. 1.2 Scope of the Study | |
    3. 1.3 Research Methodology | |
  2. 2 Key Report Takeaways | |
    1. 2.1 By User Type | |
    2. 2.2 By Storage Type | |
    3. 2.3 By Lease Duration | |
    4. 2.4 By Unit Size | |
    5. 2.5 By Region | |
  3. 3 Market Size and Forecast (2021–2035) | |
    1. 3.1 Historical Market Size (2021–2025) | |
    2. 3.2 Current & Forecast Market Size (2026–2035) | |
    3. 3.3 Market Size by Revenue (USD Billion) | |
    4. 3.4 Year-over-Year Growth Analysis | |
  4. 4 Driver Impact Analysis | |
    1. 4.1 Residential Mobility and Household Formation Cycles | |
    2. 4.2 E-Commerce Fulfilment and Small-Business Inventory Demand | |
    3. 4.3 Urban Densification and Shrinking Dwelling Footprints | |
    4. 4.4 Climate-Controlled Conversion and Insurer Requirements | |
    5. 4.5 Digital Leasing and Algorithmic Revenue Management | |
    6. 4.6 Institutional Capital and Platform Consolidation | |
    7. 4.7 Ageing Populations and Downsizing Transitions | |
  5. 5 Restraints Impact Analysis | |
    1. 5.1 Municipal Zoning Moratoria and Entitlement Delays | |
    2. 5.2 Supply Saturation and Street-Rate Compression | |
    3. 5.3 Elevated Development and Debt Costs | |
    4. 5.4 Operating Cost and Property-Tax Inflation | |
    5. 5.5 Low Category Awareness in Emerging Economies | |
  6. 6 Opportunities | |
    1. 6.1 Emerging-Market Entry Across Southeast Asia and Latin America | |
    2. 6.2 Revenue-Management Data and Third-Party Management Platforms | |
    3. 6.3 Micro-Fulfilment Conversion for Last-Mile Retail | |
    4. 6.4 Rooftop Solar and Energy Retrofit Economics | |
    5. 6.5 Ancillary Revenue and Marketplace Adjacencies | |
  7. 7 Regional Market Share and Country-Level Analysis | |
    1. 7.1 North America | | |
      1. 7.1.1 United States | | |
      2. 7.1.2 Rest of North America | |
    2. 7.2 Europe | | |
      1. 7.2.1 Switzerland | | |
      2. 7.2.2 Rest of Europe | |
    3. 7.3 Asia-Pacific | | |
      1. 7.3.1 Hong Kong | | |
      2. 7.3.2 Singapore | | |
      3. 7.3.3 South Korea | | |
      4. 7.3.4 Vietnam | | |
      5. 7.3.5 Rest of Asia-Pacific | |
    4. 7.4 South America | | |
      1. 7.4.1 Rest of South America | |
    5. 7.5 Middle East & Africa | | |
      1. 7.5.1 Rest of Middle East & Africa | |
  8. 8 Future Outlook (2026–2035) | |
    1. 8.1 Algorithmic Revenue Management Becomes Table Stakes | |
    2. 8.2 Platform Economics and the Managed-Portfolio Flywheel | |
    3. 8.3 Climate Resilience and Energy Retrofit Cycles | |
    4. 8.4 Capital Markets Normalisation and Cross-Border Consolidation | |
  9. 9 Segmentation Analysis | |
    1. 9.1 By User Type | | |
      1. 9.1.1 Personal | | |
      2. 9.1.2 Business | |
    2. 9.2 By Storage Type | | |
      1. 9.2.1 Climate-Controlled | | |
      2. 9.2.2 Non-Climate-Controlled | | |
      3. 9.2.3 Portable Container Storage | | |
      4. 9.2.4 Vehicle Storage | |
    3. 9.3 By Lease Duration | | |
      1. 9.3.1 Short-Term (Below 3 Months) | | |
      2. 9.3.2 Mid-Term (3–12 Months) | | |
      3. 9.3.3 Long-Term (Above 12 Months) | |
    4. 9.4 By Unit Size | | |
      1. 9.4.1 Small (Below 50 sq ft) | | |
      2. 9.4.2 Medium (50–100 sq ft) | | |
      3. 9.4.3 Large (Above 100 sq ft) | | |
      4. 9.4.4 Mega | |
  10. 10 Competitive Landscape | |
    1. 10.1 Market Concentration Analysis (2026) | |
    2. 10.2 Competitive Benchmarking Matrix | |
    3. 10.3 Company Profiles | |
  11. 11 Recent News and Developments | |
  12. 12 Report Scope and Methodology | |
  13. 13 Detailed Sources and Citations | |
  14. 14 Frequently Asked Questions | | LIST OF TABLES | |
  15. TABLE 1 Global Self-Storage Market Size & Forecast, by Revenue (USD Billion), 2021–2035 | |
  16. TABLE 2 Global Self-Storage Market — Year-over-Year Growth Analysis, 2021–2035 | |
  17. TABLE 3 Driver Impact Analysis — Global Self-Storage Market, 2026–2035 | |
  18. TABLE 4 Restraint Impact Analysis — Global Self-Storage Market, 2026–2035 | |
  19. TABLE 5 Global Self-Storage Market Size, by Region, 2021–2035 (USD Billion) | |
  20. TABLE 6 North America Self-Storage Market Size, by Country, 2021–2035 (USD Billion) | |
  21. TABLE 7 Europe Self-Storage Market Size, by Country, 2021–2035 (USD Billion) | |
  22. TABLE 8 Asia-Pacific Self-Storage Market Size, by Country, 2021–2035 (USD Billion) | |
  23. TABLE 9 South America Self-Storage Market Size, by Country, 2021–2035 (USD Billion) | |
  24. TABLE 10 Middle East & Africa Self-Storage Market Size, by Country, 2021–2035 (USD Billion) | |
  25. TABLE 11 Global Self-Storage Market Size, by User Type, 2021–2035 (USD Billion) | |
  26. TABLE 12 Global Self-Storage Market Size, by Storage Type, 2021–2035 (USD Billion) | |
  27. TABLE 13 Global Self-Storage Market Size, by Lease Duration, 2021–2035 (USD Billion) | |
  28. TABLE 14 Global Self-Storage Market Size, by Unit Size, 2021–2035 (USD Billion) | |
  29. TABLE 15 Competitive Benchmarking Matrix — Global Self-Storage Market, 2026 | |
  30. TABLE 16 Company Profiles — Key Players, Global Self-Storage Market | |
  31. TABLE 17 Recent Developments & Strategic Announcements, 2023–2025 | |
  32. TABLE 18 Report Scope & Methodology Summary | |
  33. TABLE 19 Detailed Sources and Citations Index | |
  34. TABLE 20 North America Self-Storage Market Size, by User Type, 2021–2035 (USD Billion) | |
  35. TABLE 21 North America Self-Storage Market Size, by Storage Type, 2021–2035 (USD Billion) | |
  36. TABLE 22 Europe Self-Storage Market Size, by Lease Duration, 2021–2035 (USD Billion) | |
  37. TABLE 23 Asia-Pacific Self-Storage Market Size, by Unit Size, 2021–2035 (USD Billion) | |
  38. TABLE 24 United States Self-Storage Market Size, by Storage Type, 2021–2035 (USD Billion) | | LIST OF FIGURES | |
  39. FIGURE 1 Global Self-Storage Market Dynamics — Drivers, Restraints and Opportunities | |
  40. FIGURE 2 Industry Value Chain Analysis — Self-Storage Market | |
  41. FIGURE 3 Porter's Five Forces Analysis — Self-Storage Market | |
  42. FIGURE 4 Global Market Size Trend and Forecast, 2021–2035 (USD Billion) | |
  43. FIGURE 5 Year-over-Year Growth Trajectory, 2022–2035 (%) | |
  44. FIGURE 6 Market Share by User Type, 2025 vs 2035 (%) | |
  45. FIGURE 7 Market Share by Storage Type, 2025 (%) | |
  46. FIGURE 8 Market Share by Lease Duration, 2025 (%) | |
  47. FIGURE 9 Market Share by Unit Size, 2025 (%) | |
  48. FIGURE 10 Regional Market Share Distribution, 2025 (%) | |
  49. FIGURE 11 Regional CAGR Comparison, 2026–2035 (%) | |
  50. FIGURE 12 North America Country-Level Revenue Split, 2025 (%) | |
  51. FIGURE 13 Asia-Pacific Country-Level Growth Comparison, 2026–2035 (%) | |
  52. FIGURE 14 Competitive Landscape — Estimated Revenue Share Ranges, 2026 | |
  53. FIGURE 15 Strategic Positioning Matrix — Leading Operators | |
  54. FIGURE 16 Development Pipeline and Supply Absorption Outlook, 2026–2035

Segmentation Quick Reference

DimensionSub-SegmentsDominant SegmentFastest Growing Segment
By User TypePersonal; BusinessPersonal (66.4% share, 2025)Business (6.25% CAGR, 2026–2035)
By Storage TypeClimate-Controlled; Non-Climate-Controlled; Portable Container Storage; Vehicle StorageClimate-Controlled (58.6% share, 2025)Portable Container Storage (6.02% CAGR, 2026–2035)
By Lease DurationShort-Term (Below 3 Months); Mid-Term (3–12 Months); Long-Term (Above 12 Months)Mid-Term (3–12 Months) (45.1% share, 2025)Short-Term (Below 3 Months) (5.72% CAGR, 2026–2035)
By Unit SizeSmall (Below 50 sq ft); Medium (50–100 sq ft); Large (Above 100 sq ft); MegaMedium (50–100 sq ft) (37.0% share, 2025)Small (Below 50 sq ft) (6.58% CAGR, 2026–2035)


Market Segmentation Overview

By User Type

Sub-SegmentKey Trend
PersonalHigh-volume, high-churn base tied to residential relocation and downsizing cycles
BusinessLonger tenancies and premium pricing for extended access and loading infrastructure


Personal tenants hold the dominant 66.4% share because household relocation remains the category's most reliable demand trigger, but their short average stay loads turnover costs onto every unit. Business tenants grow fastest at a 6.25% CAGR, since marketplace sellers and contractors treat rented bays as a substitute for multi-year industrial leases and accept 25%–35% access premiums. Operators now design mixed layouts where ground-floor commercial bays subsidise upper-floor household lockers, which is why revenue contribution from business occupiers outpaces their capacity footprint.

By Storage Type

Sub-SegmentKey Trend
Climate-ControlledInsurer requirements and catastrophe losses accelerate conversion of ambient inventory.
Non-Climate-ControlledRetained in temperate and rural catchments where retrofit capital is unrecoverable
Portable Container StorageDoor-to-door models monetise irregular infill parcels without conventional construction.
Vehicle StorageConcentrated where residential parking covenants restrict driveway storage


Climate-Controlled leads at 58.6% of capacity because conditioning transforms a commodity box into an insurable service, sustaining 50%–80% premiums over Non-Climate-Controlled space and drawing continued retrofit capital in humid and catastrophe-exposed states. Portable Container Storage expands fastest at 6.02% annually, since containers sidestep the entitlement delays that now stretch 14 to 22 months in restrictive jurisdictions. Vehicle Storage stays regionally bounded, tracking homeowner-association enforcement rather than broader demand.

By Lease Duration

Sub-SegmentKey Trend
Short-Term (Below 3 Months)Gig and project-based work drives month-to-month commitment aversion
Mid-Term (3–12 Months)Matches renovation cycles, academic terms and staged property sales
Long-Term (Above 12 Months)Business inventory and estate transitions deliver occupancy stability


Mid-Term (3–12 Months) agreements dominate at 45.1% of contracts because renovations and staged home sales naturally span that window. Short-Term (Below 3 Months) tenancies grow fastest at 5.72%, as each fresh move-in generates administration fees and protection-plan attachment that lift monthly revenue 20%–30% above equivalent long-stay space. Operators have withdrawn annual-contract discounts and applied 8%–12% escalators, deliberately trading the occupancy stability of Long-Term (Above 12 Months) tenants for dynamic repricing headroom.

By Unit Size

Sub-SegmentKey Trend
Small (Below 50 sq ft)Urban scarcity pricing at USD 1.50–USD 2.50 per square foot monthly
Medium (50–100 sq ft)Mainstream residential moves; squeezed from both ends of the format range
Large (Above 100 sq ft)Suburban drive-up convenience for contractors and downsizers
MegaLow-cost warehousing substitute for online sellers avoiding industrial leases


Medium (50–100 sq ft) holds the largest share at 37.0% as the default format for family relocations, yet it faces margin compression from both directions. Small (Below 50 sq ft) grows fastest at 6.58% because compact lockers sustain 95% occupancy in New York, San Francisco, and London while earning 40%–60% more revenue per square foot. Development strategy has bifurcated accordingly: dense infill sites now favour micro-lockers, while suburban parcels emphasise Large (Above 100 sq ft) drive-up bays and Mega formats serving e-commerce inventory.

just now

Download PDF ×

We do not share your information with anyone. However, we may send you emails based on your report interest from time to time. You may contact us at any time to opt-out.