ID: MRFR/ICT/9234-HCR | November 2021 | Region: Global | 141 Pages
TABLE OF CONTENTS
1. EXECUTIVE SUMMARY
1.1. Market Attractiveness Analysis
1.1.1. Global Secure Access Services Edge (SASE) Market, by Offering
1.1.2. Global Secure Access Services Edge (SASE) Market, by Organization Size
1.1.3. Global Secure Access Services Edge (SASE) Market, by Vertical
1.1.4. Global Secure Access Services Edge (SASE) Market, by Region
2. MARKET INTRODUCTION
2.1. Definition
2.2. Scope of the Study
2.3. Market Structure
3. RESEARCH METHODOLOGY
3.1. Research Process
3.2. Primary Research
3.3. Secondary Research
3.4. Market Size Estimation
3.5. List of Assumptions
4. MARKET DYNAMICS
4.1. Introduction
4.2. Drivers
4.2.1. Growing Need to Unlock Widespread Zero Trust Adoption
4.2.2. Increasing Mandates to Follow Regulatory and Data Protection Laws
4.2.3. Rising Need for Unified Security Architecture for Enterprise Network Security
4.2.4. Driver Impact Analysis
4.3. Restraints
4.3.1. Lack of Cloud Security Architecture and Security Awareness Among Businesses
4.3.2. Restraints Impact Analysis
4.4. Opportunities
4.4.1. Increasing Adoption of Cloud-Based Services Among SMEs
4.4.2. Mitigating Cybersecurity Risks with SASE
4.4.3. Increasing Benefits of Employing SASE Network Architecture
4.5. Challenges
4.5.1. Resistance Towards Adoption of New Technologies
4.6. Impact of COVID-19
4.6.1. Growing Trend of Cloud Computing Amidst COVID-19
4.6.2. Impact on SD-WAN and Next-Generation SASE Solutions
4.6.3. Networking and Security Architecture Post-COVID-19
5. MARKET FACTOR ANALYSIS
5.1. Value Chain Analysis/Supply Chain Analysis
5.2. Porterβs Five Forces Model
5.2.1. Threat of New Entrants
5.2.2. Bargaining Power of Suppliers
5.2.3. Threat of Substitutes
5.2.4. Bargaining Power of Buyers
5.2.5. Intensity of Rivalry
6. GLOBAL SECURE ACCESS SERVICES EDGE (SASE) MARKET, BY OFFERING
6.1. Introduction
6.2. Network as a Service
6.3. Security as a Service
7. GLOBAL SECURE ACCESS SERVICES EDGE (SASE) MARKET, BY ORGANIZATION SIZE
7.1. Introduction
7.2. SMEs
7.3. Large Enterprises
8. GLOBAL SECURE ACCESS SERVICES EDGE (SASE) MARKET, BY VERTICAL
8.1. Introduction
8.2. Government
8.3. BFSI
8.4. Retail & E-Commerce
8.5. IT and Telecommunication
8.6. Healthcare
8.7. Others
9. GLOBAL SECURE ACCESS SERVICES EDGE (SASE) MARKET, BY REGION
9.1. Overview
9.2. North America
9.2.1. Market Size & Estimates, by Country, 2019β2027
9.2.2. Market Size & Estimates, by Offering, 2019β2027
9.2.3. Market Size & Estimates, by Organization Size, 2019β2027
9.2.4. Market Size & Estimates, by Vertical, 2019β2027
9.2.5. US
9.2.5.1. Market Size & Estimates, by Offering, 2019β2027
9.2.5.2. Market Size & Estimates, by Organization Size, 2019β2027
9.2.5.3. Market Size & Estimates, by Vertical, 2019β2027
9.2.6. Canada
9.2.6.1. Market Size & Estimates, by Offering, 2019β2027
9.2.6.2. Market Size & Estimates, by Organization Size, 2019β2027
9.2.6.3. Market Size & Estimates, by Vertical, 2019β2027
9.2.7. Mexico
9.2.7.1. Market Size & Estimates, by Offering, 2019β2027
9.2.7.2. Market Size & Estimates, by Organization Size, 2019β2027
9.2.7.3. Market Size & Estimates, by Vertical, 2019β2027
9.3. Europe
9.3.1. Market Size & Estimates, by Country, 2019β2027
9.3.2. Market Size & Estimates, by Offering, 2019β2027
9.3.3. Market Size & Estimates, by Organization Size, 2019β2027
9.3.4. Market Size & Estimates, by Vertical, 2019β2027
9.3.5. Germany
9.3.5.1. Market Size & Estimates, by Offering, 2019β2027
9.3.5.2. Market Size & Estimates, by Organization Size, 2019β2027
9.3.5.3. Market Size & Estimates, by Vertical, 2019β2027
9.3.6. UK
9.3.6.1. Market Size & Estimates, by Offering, 2019β2027
9.3.6.2. Market Size & Estimates, by Organization Size, 2019β2027
9.3.6.3. Market Size & Estimates, by Vertical, 2019β2027
9.3.7. France
9.3.7.1. Market Size & Estimates, by Offering, 2019β2027
9.3.7.2. Market Size & Estimates, by Organization Size, 2019β2027
9.3.7.3. Market Size & Estimates, by Vertical, 2019β2027
9.3.8. Rest of Europe
9.3.8.1. Market Size & Estimates, by Offering, 2019β2027
9.3.8.2. Market Size & Estimates, by Organization Size, 2019β2027
9.3.8.3. Market Size & Estimates, by Vertical, 2019β2027
9.4. Asia-Pacific
9.4.1. Market Size & Estimates, by Country, 2019β2027
9.4.2. Market Size & Estimates, by Offering, 2019β2027
9.4.3. Market Size & Estimates, by Organization Size, 2019β2027
9.4.4. Market Size & Estimates, by Vertical, 2019β2027
9.4.5. China
9.4.5.1. Market Size & Estimates, by Offering, 2019β2027
9.4.5.2. Market Size & Estimates, by Organization Size, 2019β2027
9.4.5.3. Market Size & Estimates, by Vertical, 2019β2027
9.4.6. Japan
9.4.6.1. Market Size & Estimates, by Offering, 2019β2027
9.4.6.2. Market Size & Estimates, by Organization Size, 2019β2027
9.4.6.3. Market Size & Estimates, by Vertical, 2019β2027
9.4.7. India
9.4.7.1. Market Size & Estimates, by Offering, 2019β2027
9.4.7.2. Market Size & Estimates, by Organization Size, 2019β2027
9.4.7.3. Market Size & Estimates, by Vertical, 2019β2027
9.4.8. Rest of Asia-Pacific
9.4.8.1. Market Size & Estimates, by Offering, 2019β2027
9.4.8.2. Market Size & Estimates, by Organization Size, 2019β2027
9.4.8.3. Market Size & Estimates, by Vertical, 2019β2027
9.5. Middle East & Africa
9.5.1. Market Size & Estimates, by Offering, 2019β2027
9.5.2. Market Size & Estimates, by Organization Size, 2019β2027
9.5.3. Market Size & Estimates, by Vertical, 2019β2027
9.6. South America
9.6.1. Market Size & Estimates, by Offering, 2019β2027
9.6.2. Market Size & Estimates, by Organization Size, 2019β2027
9.6.3. Market Size & Estimates, by Vertical, 2019β2027
10. COMPETITIVE LANDSCAPE
10.1. Introduction
10.2. Key Players Market Share Analysis, 2020 (%)
10.3. Competitive Benchmarking
10.4. Competitor Dashboard
10.5. Major Growth Strategy in the market
10.6. Key Developments & Growth Strategies
10.6.1. New Product Developments
10.6.2. Mergers & Acquisitions
10.6.3. Contracts & Agreements
11. COMPANY PROFILES
11.1. Cisco Systems Inc. (US)
11.1.1. Company Overview
11.1.2. Financial Overview
11.1.3. Products/Services/Solutions Offered
11.1.4. Key Developments
11.1.5. SWOT Analysis
11.1.6. Key Strategies
11.2. VMware Inc. (US)
11.2.1. Company Overview
11.2.2. Financial Overview
11.2.3. Products/Services/Solutions Offered
11.2.4. Key Developments
11.2.5. SWOT Analysis
11.2.6. Key Strategies
11.3. Palo Alto Networks Inc. (US)
11.3.1. Company Overview
11.3.2. Financial Overview
11.3.3. Products/Services/Solutions Offered
11.3.4. Key Developments
11.3.5. SWOT Analysis
11.3.6. Key Strategies
11.4. Fortinet Inc. (US)
11.4.1. Company Overview
11.4.2. Financial Overview
11.4.3. Products/Services/Solutions Offered
11.4.4. Key Developments
11.4.5. SWOT Analysis
11.4.6. Key Strategies
11.5. Akamai Technologies Inc. (US)
11.5.1. Company Overview
11.5.2. Financial Overview
11.5.3. Products/Services/Solutions Offered
11.5.4. Key Developments
11.5.5. SWOT Analysis
11.5.6. Key Strategies
11.6. Zscaler Inc. (US)
11.6.1. Company Overview
11.6.2. Financial Overview
11.6.3. Products/Services/Solutions Offered
11.6.4. Key Developments
11.6.5. SWOT Analysis
11.6.6. Key Strategies
11.7. Cloudflare Inc. (US)
11.7.1. Company Overview
11.7.2. Financial Overview
11.7.3. Products/Services/Solutions Offered
11.7.4. Key Developments
11.7.5. SWOT Analysis
11.7.6. Key Strategies
11.8. Versa Networks Inc. (US)
11.8.1. Company Overview
11.8.2. Financial Overview
11.8.3. Products/Services/Solutions Offered
11.8.4. Key Developments
11.8.5. SWOT Analysis
11.8.6. Key Strategies
11.9. Cato Networks Ltd. (Israel)
11.9.1. Company Overview
11.9.2. Financial Overview
11.9.3. Products/Services/Solutions Offered
11.9.4. Key Developments
11.9.5. SWOT Analysis
11.9.6. Key Strategies
11.10. Broadcom Corporation (US)
11.10.1. Company Overview
11.10.2. Financial Overview
11.10.3. Products/Services/Solutions Offered
11.10.4. Key Developments
11.10.5. SWOT Analysis
11.10.6. Key Strategies
11.11. Checkpoint Software Technologies Ltd. (Israel)
11.11.1. Company Overview
11.11.2. Financial Overview
11.11.3. Products/Services/Solutions Offered
11.11.4. Key Developments
11.11.5. SWOT Analysis
11.11.6. Key Strategies
11.12. McAfee Corp. (US)
11.12.1. Company Overview
11.12.2. Financial Overview
11.12.3. Products/Services/Solutions Offered
11.12.4. Key Developments
11.12.5. SWOT Analysis
11.12.6. Key Strategies
11.13. Aryaka Networks Inc. (US)
11.13.1. Company Overview
11.13.2. Financial Overview
11.13.3. Products/Services/Solutions Offered
11.13.4. Key Developments
11.13.5. SWOT Analysis
11.13.6. Key Strategies
11.14. Citrix Systems Inc. (US)
11.14.1. Company Overview
11.14.2. Financial Overview
11.14.3. Products/Services/Solutions Offered
11.14.4. Key Developments
11.14.5. SWOT Analysis
11.14.6. Key Strategies
11.15. Forcepoint (US)
11.15.1. Company Overview
11.15.2. Financial Overview
11.15.3. Products/Services/Solutions Offered
11.15.4. Key Developments
11.15.5. SWOT Analysis
11.15.6. Key Strategies
LIST OF TABLES
TABLE 1 LIST OF ASSUMPTIONS
TABLE 2 GLOBAL SECURE ACCESS SERVICES EDGE (SASE) MARKET, BY OFFERING, 2019β2027 (USD MILLION)
TABLE 3 GLOBAL SECURE ACCESS SERVICES EDGE (SASE) MARKET, BY VERTICAL, 2019β2027 (USD MILLION)
TABLE 4 GLOBAL SECURE ACCESS SERVICES EDGE (SASE) MARKET, BY REGION, 2019β2027 (USD MILLION)
TABLE 5 NORTH AMERICA: SECURE ACCESS SERVICES EDGE (SASE) MARKET, BY COUNTRY, 2019β2027 (USD MILLION)
TABLE 6 NORTH AMERICA: SECURE ACCESS SERVICES EDGE (SASE) MARKET, BY ORGANIZATION SIZE, 2019β2027 (USD MILLION)
TABLE 7 NORTH AMERICA: SECURE ACCESS SERVICES EDGE (SASE) MARKET, BY OFFERING, 2019β2027 (USD MILLION)
TABLE 8 NORTH AMERICA: SECURE ACCESS SERVICES EDGE (SASE) MARKET, BY VERTICAL, 2019β2027 (USD MILLION)
TABLE 9 US: SECURE ACCESS SERVICES EDGE (SASE) MARKET, BY OFFERING, 2019β2027 (USD MILLION)
TABLE 10 US: SECURE ACCESS SERVICES EDGE (SASE) MARKET, BY ORGANIZATION SIZE, 2019β2027 (USD MILLION)
TABLE 11 US: SECURE ACCESS SERVICES EDGE (SASE) MARKET, BY VERTICAL, 2019β2027 (USD MILLION)
TABLE 12 CANADA: SECURE ACCESS SERVICES EDGE (SASE) MARKET, BY OFFERING, 2019β2027 (USD MILLION)
TABLE 13 CANADA: SECURE ACCESS SERVICES EDGE (SASE) MARKET, BY ORGANIZATION SIZE, 2019β2027 (USD MILLION)
TABLE 14 CANADA: SECURE ACCESS SERVICES EDGE (SASE) MARKET, BY VERTICAL, 2019β2027 (USD MILLION)
TABLE 15 MEXICO: SECURE ACCESS SERVICES EDGE (SASE) MARKET, BY OFFERING, 2019β2027 (USD MILLION)
TABLE 16 MEXICO: SECURE ACCESS SERVICES EDGE (SASE) MARKET, BY ORGANIZATION SIZE, 2019β2027 (USD MILLION)
TABLE 17 MEXICO: SECURE ACCESS SERVICES EDGE (SASE) MARKET, BY VERTICAL, 2019β2027 (USD MILLION)
TABLE 18 EUROPE: SECURE ACCESS SERVICES EDGE (SASE) MARKET, BY COUNTRY, 2019β2027 (USD MILLION)
TABLE 19 EUROPE: SECURE ACCESS SERVICES EDGE (SASE) MARKET, BY OFFERING, 2019β2027 (USD MILLION)
TABLE 20 EUROPE: SECURE ACCESS SERVICES EDGE (SASE) MARKET, BY ORGANIZATION SIZE, 2019β2027 (USD MILLION)
TABLE 21 EUROPE: SECURE ACCESS SERVICES EDGE (SASE) MARKET, BY VERTICAL, 2019β2027 (USD MILLION)
TABLE 22 UK: SECURE ACCESS SERVICES EDGE (SASE) MARKET, BY OFFERING, 2019β2027 (USD MILLION)
TABLE 23 UK: SECURE ACCESS SERVICES EDGE (SASE) MARKET, BY ORGANIZATION SIZE, 2019β2027 (USD MILLION)
TABLE 24 UK: SECURE ACCESS SERVICES EDGE (SASE) MARKET, BY VERTICAL, 2019β2027 (USD MILLION)
TABLE 25 GERMANY: SECURE ACCESS SERVICES EDGE (SASE) MARKET, BY OFFERING, 2019β2027 (USD MILLION)
TABLE 26 GERMANY: SECURE ACCESS SERVICES EDGE (SASE) MARKET, BY ORGANIZATION SIZE, 2019β2027 (USD MILLION)
TABLE 27 GERMANY: SECURE ACCESS SERVICES EDGE (SASE) MARKET, BY VERTICAL, 2019β2027 (USD MILLION)
TABLE 28 FRANCE: SECURE ACCESS SERVICES EDGE (SASE) MARKET, BY OFFERING, 2019β2027 (USD MILLION)
TABLE 29 FRANCE: SECURE ACCESS SERVICES EDGE (SASE) MARKET, BY ORGANIZATION SIZE, 2019β2027 (USD MILLION)
TABLE 30 FRANCE: SECURE ACCESS SERVICES EDGE (SASE) MARKET, BY VERTICAL, 2019β2027 (USD MILLION)
TABLE 31 REST OF EUROPE: SECURE ACCESS SERVICES EDGE (SASE) MARKET, BY OFFERING, 2019β2027 (USD MILLION)
TABLE 32 REST OF EUROPE: SECURE ACCESS SERVICES EDGE (SASE) MARKET, BY ORGANIZATION SIZE, 2019β2027 (USD MILLION)
TABLE 33 REST OF EUROPE: SECURE ACCESS SERVICES EDGE (SASE) MARKET, BY VERTICAL, 2019β2027 (USD MILLION)
TABLE 34 ASIA-PACIFIC: SECURE ACCESS SERVICES EDGE (SASE) MARKET, BY COUNTRY, 2019β2027 (USD MILLION)
TABLE 35 ASIA-PACIFIC: SECURE ACCESS SERVICES EDGE (SASE) MARKET, BY OFFERING, 2019β2027 (USD MILLION)
TABLE 36 ASIA-PACIFIC: SECURE ACCESS SERVICES EDGE (SASE) MARKET, BY ORGANIZATION SIZE, 2019β2027 (USD MILLION)
TABLE 37 ASIA-PACIFIC: SECURE ACCESS SERVICES EDGE (SASE) MARKET, BY VERTICAL, 2019β2027 (USD MILLION)
TABLE 38 CHINA: SECURE ACCESS SERVICES EDGE (SASE) MARKET, BY OFFERING, 2019β2027 (USD MILLION)
TABLE 39 CHINA: SECURE ACCESS SERVICES EDGE (SASE) MARKET, BY ORGANIZATION SIZE, 2019β2027 (USD MILLION)
TABLE 40 CHINA: SECURE ACCESS SERVICES EDGE (SASE) MARKET, BY VERTICAL, 2019β2027 (USD MILLION)
TABLE 41 INDIA: SECURE ACCESS SERVICES EDGE (SASE) MARKET, BY OFFERING, 2019β2027 (USD MILLION)
TABLE 42 INDIA: SECURE ACCESS SERVICES EDGE (SASE) MARKET, BY ORGANIZATION SIZE, 2019β2027 (USD MILLION)
TABLE 43 INDIA: SECURE ACCESS SERVICES EDGE (SASE) MARKET, BY VERTICAL, 2019β2027 (USD MILLION)
TABLE 44 JAPAN: SECURE ACCESS SERVICES EDGE (SASE) MARKET, BY OFFERING, 2019β2027 (USD MILLION)
TABLE 45 JAPAN: SECURE ACCESS SERVICES EDGE (SASE) MARKET, BY ORGANIZATION SIZE, 2019β2027 (USD MILLION)
TABLE 46 JAPAN: SECURE ACCESS SERVICES EDGE (SASE) MARKET, BY VERTICAL, 2019β2027 (USD MILLION)
TABLE 47 REST OF ASIA-PACIFIC: SECURE ACCESS SERVICES EDGE (SASE) MARKET, BY OFFERING, 2019β2027 (USD MILLION)
TABLE 48 US: SECURE ACCESS SERVICES EDGE (SASE) MARKET, BY ORGANIZATION SIZE, 2019β2027 (USD MILLION)
TABLE 49 REST OF ASIA-PACIFIC: SECURE ACCESS SERVICES EDGE (SASE) MARKET, BY VERTICAL, 2019β2027 (USD MILLION)
TABLE 50 MIDDLE EAST & AFRICA: SECURE ACCESS SERVICES EDGE (SASE) MARKET, BY OFFERING, 2019β2027 (USD MILLION)
TABLE 51 MIDDLE EAST & AFRICA: SECURE ACCESS SERVICES EDGE (SASE) MARKET, BY ORGANIZATION SIZE, 2019β2027 (USD MILLION)
TABLE 52 MIDDLE EAST & AFRICA: SECURE ACCESS SERVICES EDGE (SASE) MARKET, BY VERTICAL, 2019β2027 (USD MILLION)
TABLE 53 SOUTH AMERICA: SECURE ACCESS SERVICES EDGE (SASE) MARKET, BY OFFERING, 2019β2027 (USD MILLION)
TABLE 54 SOUTH AMERICA: SECURE ACCESS SERVICES EDGE (SASE) MARKET, BY ORGANIZATION SIZE, 2019β2027 (USD MILLION)
TABLE 55 SOUTH AMERICA: SECURE ACCESS SERVICES EDGE (SASE) MARKET, BY VERTICAL, 2019β2027 (USD MILLION)
β
β
LIST OF FIGURES
FIGURE 1 MARKET SYNOPSIS
FIGURE 2 RESEARCH PROCESS OF MRFR
FIGURE 3 TOP-DOWN & BOTTOM-UP APPROACH
FIGURE 4 GLOBAL SECURE ACCESS SERVICES EDGE (SASE) MARKET, BY OFFERING, 2019β2027 (USD MILLION)
FIGURE 5 GLOBAL SECURE ACCESS SERVICES EDGE (SASE) MARKET, BY ORGANIZATION SIZE, 2019β2027 (USD MILLION)
FIGURE 6 GLOBAL SECURE ACCESS SERVICES EDGE (SASE) MARKET, BY VERTICAL, 2019β2027 (USD MILLION)
FIGURE 7 GLOBAL SECURE ACCESS SERVICES EDGE (SASE) MARKET, BY REGION, 2019-2027 (USD MILLION)
FIGURE 8 NORTH AMERICA: SECURE ACCESS SERVICES EDGE (SASE) MARKET, BY COUNTRY, 2019β2027 (USD MILLION)
FIGURE 9 NORTH AMERICA: SECURE ACCESS SERVICES EDGE (SASE) MARKET, BY ORGANIZATION SIZE, 2019β2027 (USD MILLION)
FIGURE 10 NORTH AMERICA: SECURE ACCESS SERVICES EDGE (SASE) MARKET, BY OFFERING, 2019β2027 (USD MILLION)
FIGURE 11 NORTH AMERICA: SECURE ACCESS SERVICES EDGE (SASE) MARKET, BY VERTICAL, 2019β2027 (USD MILLION)
FIGURE 12 EUROPE: SECURE ACCESS SERVICES EDGE (SASE) MARKET, BY COUNTRY, 2019β2027 (USD MILLION)
FIGURE 13 EUROPE: SECURE ACCESS SERVICES EDGE (SASE) MARKET, BY OFFERING, 2019β2027 (USD MILLION)
FIGURE 14 EUROPE SECURE ACCESS SERVICES EDGE (SASE) MARKET, BY ORGANIZATION SIZE, 2019β2027 (USD MILLION)
FIGURE 15 EUROPE: SECURE ACCESS SERVICES EDGE (SASE) MARKET, BY VERTICAL, 2019β2027 (USD MILLION)
FIGURE 16 ASIA-PACIFIC: SECURE ACCESS SERVICES EDGE (SASE) MARKET, BY COUNTRY, 2019β2027 (USD MILLION)
FIGURE 17 ASIA-PACIFIC: SECURE ACCESS SERVICES EDGE (SASE) MARKET, BY OFFERING, 2019β2027 (USD MILLION)
FIGURE 18 ASIA-PACIFIC SECURE ACCESS SERVICES EDGE (SASE) MARKET, BY ORGANIZATION SIZE, 2019β2027 (USD MILLION)
FIGURE 19 ASIA-PACIFIC: SECURE ACCESS SERVICES EDGE (SASE) MARKET, BY VERTICAL, 2019β2027 (USD MILLION)
FIGURE 20 MIDDLE EAST & AFRICA: SECURE ACCESS SERVICES EDGE (SASE) MARKET, BY OFFERING, 2019β2027 (USD MILLION)
FIGURE 21 MIDDLE EAST & AFRICA: SECURE ACCESS SERVICES EDGE (SASE) MARKET, BY ORGANIZATION SIZE, 2019β2027 (USD MILLION)
FIGURE 22 MIDDLE EAST & AFRICA: SECURE ACCESS SERVICES EDGE (SASE) MARKET, BY VERTICAL, 2019β2027 (USD MILLION)
FIGURE 23 SOUTH AMERICA: SECURE ACCESS SERVICES EDGE (SASE) MARKET, BY OFFERING, 2019β2027 (USD MILLION)
FIGURE 24 SOUTH AMERICA SECURE ACCESS SERVICES EDGE (SASE) MARKET, BY ORGANIZATION SIZE, 2019β2027 (USD MILLION)
FIGURE 25 SOUTH AMERICA: SECURE ACCESS SERVICES EDGE (SASE) MARKET, BY VERTICAL, 2019β2027 (USD MILLION)
$5.36 Billion
28.3%
North America
2021-2027
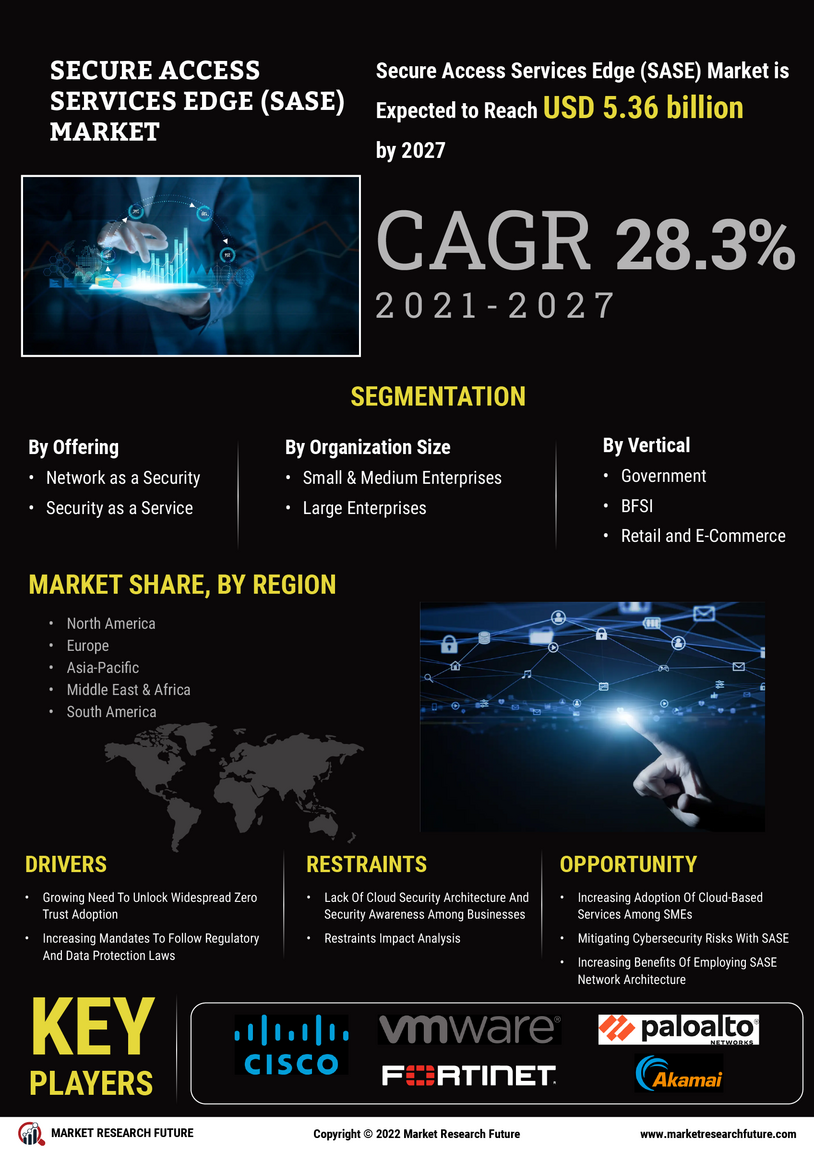
The secure access services edge (SASE) market size is expected to register a significant CAGR of ~28.3% during the forecast period and is projected to reach a market value of USD 5.36 billion by 2027.
More data, people, devices, apps, and services are being used outside of traditional company premises as firms strive to accelerate expansion through the usage of the cloud, implying that the enterprise perimeter is no longer a location. Despite this shift outside the perimeter, network architectures are still structured so that everything must transit through and back out of a network perimeter. Users must still connect to the corporate network, utilizing expensive and inefficient technology, regardless of where they are, only to return to the outside world more often than not. As network architectures are still locked in this state, enterprises must rethink their security and risk management strategies. When individuals, devices, and data are created and stored nearly everywhere, environmental coverage, including visibility and control, can be quickly lost. In terms of user performance, service availability, and productivity, this poses substantial issues. A SASE framework is used to address these issues.
COVID-19 Analysis
Executives are boosting the importance of company continuity, digital transformation, and remote work in 2020, rearranging IT priorities once more. And there's one thing that all three of these programs have in common: the corporate network. The success of each is based on the network, with any failures having a high visibility impact and unpleasant experience for the organization. Without optimal bandwidth and network performance, video conferencing devolves into digital mush. To access the information that they need to conduct their jobs, remote employees need cloud applications and secure VPN connections. Furthermore, multi-cloud settings, internet access, and increasingly linked endpoints necessitate more stringent data security procedures. Executives are reconsidering their IT modernization plans with greater appreciation and seriousness now that the network (and its flaws) are in the spotlight.
Many employees increasingly rely on traditional hardware devices because they are no longer connected to a corporate network while working remotely. All of these changes have forced businesses to evaluate their existing set of standalone point products, such as firewalls, secure web gateways, data loss prevention (DLP), and cloud access security brokers (CASB). To serve the needs of digital business transformation, edge computing, and workforce mobility, SASE combines networking and network security into a single, cloud-delivered product. It reduces network and security complexity without being limited to a specific region, country, or metro area. The rise in the use of this technology can be attributed to the ever-increasing popularity of today's remote workforce and the ability to reconfigure network infrastructures without regard to geography.
Market Dynamics
The major factors driving the growth of the secure access services edge (SASE) market are the increasing demand for advanced analytics tools to ensure market competitiveness and the growing adoption of big data and other related technologies. However, the rising concerns over data privacy and security are expected to hinder the market growth. Nevertheless, the increasing demand for real-time analytics solutions is creating lucrative growth opportunities for the market players.
Drivers
On the other hand, technological advancements have swiftly led to increased commercialization and investments in the Internet, ushering in a new era of available bandwidth that has exponentially improved access to audio and video by the early twenty-first century. Without the much-needed bandwidth, streaming - and truly all content makers and consumers - would not have progressed as quickly as it did. In a similar vein, we at MRFR believe that the concept of Zero Trust Network Security, which was first proposed more than a decade ago, needs its own push to gain traction. That help has arrived in the form of Secure Access Service Edge (SASE), the ideal framework for Zero Trust. Since its inception in 2010, the network security community has proclaimed Zero Trust to be the best access paradigm to use. Even Nevertheless, corporations have just lately begun to use Zero Trust in their network security frameworks. The rise of remote work, digital transformation, and cloud use are all contributing to this progress. SASE enables organizations to easily manage and alter their networking and security from a single unified cloud platform, much way the rest of the service economy has gone to the cloud. As organizations implement SASE, the security and network space will recognize the benefit of this adoption in the reduced frequency of data breaches, enabling wider Zero Trust adoption.
Restraints
Organizations all over the world are moving parts of their IT infrastructure to public clouds. Implementing proper security architecture to survive cyberattacks is one of the most difficult tasks during this transformation. Unfortunately, many businesses are still confounded by this process. When businesses assume that cloud migration is just a matter of moving their existing IT stack and security measures to the cloud, their data is vulnerable to a variety of dangers. Another contributing reason is a lack of knowledge of the shared security responsibility approach.
Opportunities
A data breach may be extremely costly for a company, and the price tag continues to rise. Enterprises must install solutions capable of managing their risks as breaches become more common. Implementing and enforcing a zero-trust security policy via SASE is a critical step in lowering the cost of a data breach. SASE lays the groundwork for a zero-trust and data-breach-mitigation strategy. SASE is a cloud-based device that combines SD-network WAN's optimization features with a full network security stack. Enterprises can use SASE to deploy and enforce consistent zero-trust policies throughout their entire WAN. Because SASE points of presence (PoPs) may be placed anywhere, businesses can protect their cloud assets and remote workforce on par with on-premises resources without losing network performance.
Value Chain Analysis
The global secure access services edge (SASE) market has witnessed significant growth in the past decade due to technological changes and is expected to grow at a steady rate in the upcoming years. The value chain analysis of the secure access services edge (SASE) market comprises four major levels: hardware/software providers, SASE solution/ service providers, system integrators, and end users.
Market Segmentation
The global secure access services edge (SASE) market has been segmented based on offering, organization size, end user, vertical, and region.
Based on the offering, the global market has been segmented into network as a service and security as a service.
Based on organization size, the global market has been segmented into small and medium-sized enterprises and large enterprises.
By vertical, the secure access services edge (SASE) market has been segmented into government, BFSI, retail & e-commerce, IT & telecommunications, healthcare, and others.
The regions included in the study are North America, Europe, Asia-Pacific, the Middle East & Africa, and South America.
Global Secure Access Services Edge (SASE) Market, 2018–2027 (USD Billion)
Source: MRFR Analysis
Regional Analysis
The regional analysis for the secure access services edge (SASE) market has been done for North America, Asia-Pacific, Europe, the Middle East & Africa, and South America. The market in North America accounted for the largest market share in 2020, and it is expected to register strong growth during the forecast period. Several important market companies operate in North America, providing modern solutions to all of the region's industry verticals. Strategic investments, partnerships, R&D programs, and geographical expansion are all contributing to the widespread implementation of SASE systems. Due to reasons such as the development in cloud security measures and authentication frauds, North America is regarded as the most mature market in terms of implementing SASE solutions.
However, the APAC region is witnessing a tremendous growth rate due to various factors, including the expansion of local businesses and government programs aimed towards cybersecurity. The regional market is predicted to grow due to enterprises in China, India, and Japan spending aggressively to ensure the security of their IT infrastructure. The regional market is also being driven by the rising digital workforce and the continuous acceptance of the BYOD trend by businesses in Asia-Pacific. The regional market is likely to grow due to the security framework policies being followed, particularly in Southeast Asia, in response to the growing threats of cyberattacks on vital IT systems.
Competitive Landscape
The global market for secure access services edge (SASE) has witnessed significant growth over the forecast period due to the growing number of SASE providers. There are several domestic, regional, and global players operating in the secure access services edge (SASE) market who continuously strive to gain a significant share of the overall market. The key market participants are investing in R&D to drive organic growth and increase their market shares. In addition, these players are engaging in new product developments to expand and strengthen their existing portfolios and acquire new consumers.
Key Players
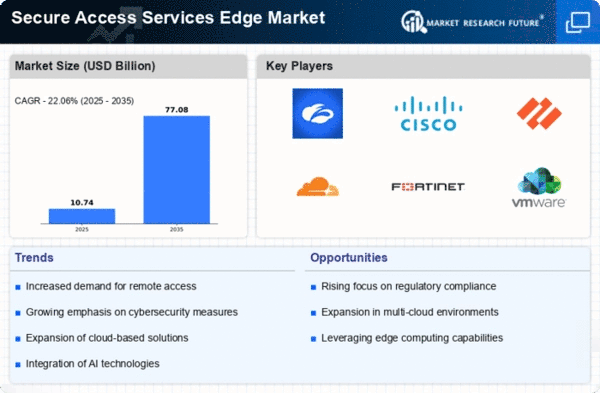
The global secure access services edge (SASE) market is characterized by the presence of several regional and local providers. Some of the key players in the market are Cisco Systems Inc. (US), VMware Inc. (US), Fortinet Inc. (US), Palo Alto Networks Inc. (US), Akamai Technologies Inc. (US), Zscaler Inc. (US), Cloudflare Inc. (US), Cato Networks Ltd. (Israel), Versa Networks Inc. (US), Forcepoint (US), Broadcom Corporation (US), Checkpoint Software Technologies Ltd. (Israel), McAfee Corp. (US), Aryaka Networks Inc. (US), and Citrix Systems Inc. (US).
Recent Developments
Report Overview
This study estimates revenue growth at global, regional, and country levels and offers an overview of the latest developments in each of the sub-sectors from 2018 to 2027. For this analysis, MRFR segmented the global secure access services edge (SASE) market has been segmented based on offerings, organization size, vertical, and region.
Report Attribute/Metric | Details |
---|---|
Market Size | 2027 - USD: 5.36 Billion |
CAGR | CAGR: ~28.3% |
Base Year | 2020 |
Forecast Period | 2021-2027 |
Historical Data | 2019 |
Forecast Units | 2027 - USD: 5.36 Billion |
Report Coverage | Revenue Forecast, Competitive Landscape, Growth Factors, and Trends |
Segments Covered | β’ By Offering (Network as a Service and Security as a Service) β’ By Organization Size (SMEs and Large Enterprises) β’ By Vertical (Government, BFSI, IT & Telecommunication, Retail & E-Commerce, Healthcare, and Others) |
Geographies Covered | |
Key Vendors | β’ Cisco Systems Inc. β’ VMware Inc. β’ Palo Alto Networks Inc. β’ Fortinet Inc. |
Key Market Opportunities | |
Key Market Drivers | rivers β’ Growing Need for Unlocking Widespread Zero Trust Adoption β’ Increasing Mandates to Follow Regulatory and Data Protection Laws β’ Rising Need for a Unified Security Architecture for Enterprise Network Security β’ Restraints β’ Lack of Cloud Security Architecture and Strategy Awareness Among Businesses β’ Opportunities β’ Increasing Adoption of Cloud-Based Services Among SMEs β’ Mitigating Cybersecurity Risks with SASE β’ Increasing Benefits of Employing a SASE Network Architecture β’ Challenges β’ Resistance Towards Adopting New Technologies β’ Impact of COVID-19 β’ Growing Trend of Cloud Computing Amidst Covid-19 β’ Impact on SD-WAN and Next-Generation SA |
Frequently Asked Questions (FAQ) :
The global secure access service edge market is predicted to grow at a 28.3% CAGR between 2021- 2027.
North America will lead the global secure access service edge market.
Technological advances and digital transformation are the key factors driving the global secure access service edge market growth.
The lack of cloud security architecture may limit the global secure access service edge market growth.
Key contenders profiled in the global secure access service edge market include Cisco Systems Inc, VMware Inc, Fortinet Inc, Palo Alto Networks Inc, Akamai Technologies Inc, Zscaler Inc, Cloudflare Inc, Cato Networks Ltd., Versa Networks Inc, Forcepoint, Broadcom Corporation, Checkpoint Software Technologies Ltd, McAfee Corp, Aryaka Networks Inc, and Citrix Systems Inc.