Sand Screen Market Segmentation
Sand Screen Market By Application (USD Million, 2025-2035)
- Oil and Gas
- Mining
- Sand Screen Market
- Water Treatment
- Others
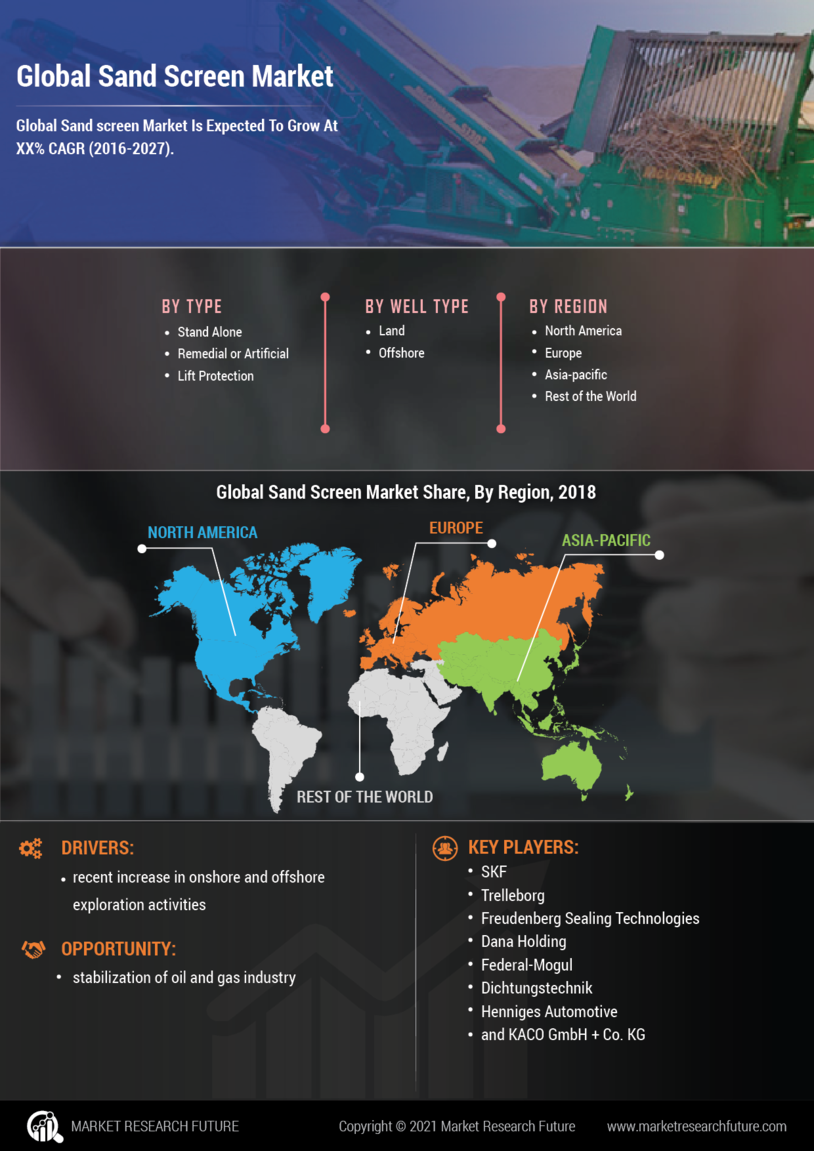
Sand Screen Market By Well Type (USD Million, 2025-2035)
- Land
- Offshore
Sand Screen Market By Mesh Size (USD Million, 2025-2035)
- Fine
- Medium
- Coarse
Sand Screen Market By Material (USD Million, 2025-2035)
- Steel
- Polyurethane
- Plastic
- Others
Sand Screen Market By Installation (USD Million, 2025-2035)
- New Installation
- Retrofit