• Cat-intel
  • MedIntelliX
  • Resources
  • About Us
  • Hero Background
    English
    Chinese
    French
    Japanese
    Korean
    German
    Spanish

    Rubber Vulcanization Market Analysis

    ID: MRFR/CnM/6422-CR
    275 Pages
    Chitranshi Jaiswal
    May 2019

    Global Rubber Vulcanization Market Research Report Information By Type {[Vulcanizing Agent (Sulfur, Tellurium, Selenium, Metallic Oxides), By Accelerators (Dithiocarbamate, Dithiophosphate, Sulfenamides, Xanthates), Activators, Others]}, Technique (Sulfur Vulcanization, Other Curing Techniques), By End-Use Industry (Automotive & Transportation, Industrial, Consumer Goods, Healthcare, others...

    Share:
    Download PDF ×

    We do not share your information with anyone. However, we may send you emails based on your report interest from time to time. You may contact us at any time to opt-out.

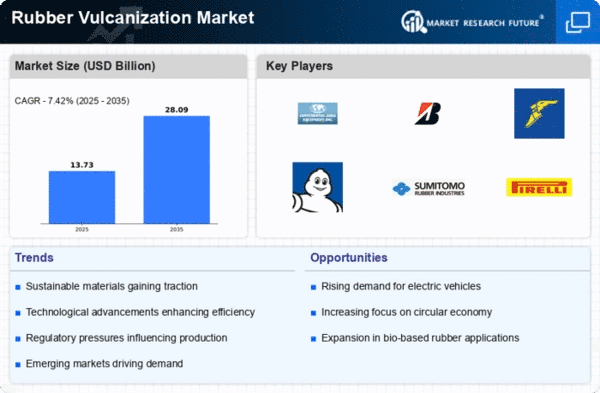
    Rubber Vulcanization Market Infographic
    $ 4,950.0
    $ 5,950.0
    $ 7,250.0

    Market Analysis

    In-depth Analysis of Rubber Vulcanization Market Industry Landscape

    Aircraft tires are predominantly made from natural rubber due to its superior heat resistance. The strength and resilience of natural rubber are enhanced by combining it with sulfur, carbon black, and other chemicals. The mixture is then processed into sheets and shaped into aircraft tire treads using an extruder. The aerospace industry's growth significantly contributes to the demand for these natural rubber-based tires, particularly with the rising need for lightweight and fuel-efficient military aircraft for security purposes. Projections from the US Geological Survey indicate a doubling of the global aircraft fleet in the next two decades. Additionally, the healthcare sector extensively employs rubber for various applications, including injection parts, gloves, tubing, and medical devices. Silicone, natural, and polyurethane rubbers are commonly used in healthcare due to their biocompatibility, durability, sterilizability, and mechanical properties. The increasing prevalence of heart disease and related health concerns is anticipated to drive the demand for medical applications like cardiac pacemaker leads and mammary prostheses, further influencing the global rubber vulcanization market. The oil and gas industry plays a significant role in driving the demand for rubber vulcanization. Rubber products like seals, gaskets, O-rings, hoses, and connectors are extensively used in the industry for applications involving drilling equipment, pipelines, pumps, and valves. These rubber components are crucial for preventing leaks, ensuring operational integrity, and safeguarding against harsh operating conditions such as high pressure and temperature. As the global demand for energy continues to rise, the oil and gas sector requires reliable sealing solutions to maintain the efficiency and safety of its operations. The growth of this industry contributes substantially to the overall demand for rubber vulcanization, creating opportunities for market players in the production of high-performance seals tailored for oil and gas applications. The automotive industry is a major consumer of vulcanized rubber products, utilizing them in various applications essential for vehicle performance. Seals, gaskets, O-rings, hoses, and other rubber components are crucial for maintaining the integrity of automotive systems such as engines, transmissions, braking systems, and fuel systems. As the automotive sector evolves with the introduction of electric vehicles, hybrid technologies, and stringent emission regulations, the demand for high-performance rubber products becomes more pronounced. The industry's focus on fuel efficiency, reduced emissions, and innovative technologies underscores the importance of reliable rubber components, thereby driving the demand for rubber vulcanization. Additionally, the expanding global population and rising disposable incomes contribute to the growth of the automotive market, further fueling the demand for rubber products and, consequently, rubber vulcanization.

    Market Summary

    As per Market Research Future Analysis, the Global Rubber Vulcanization Market is projected to reach USD 3,793 billion by 2030, growing at a CAGR of 2.86%. The market is primarily driven by the increasing consumption of rubber products in the healthcare sector and the automotive and aerospace industries. However, the market faces challenges from stringent regulations and fluctuating raw material prices. The COVID-19 pandemic has had mixed effects, boosting demand in healthcare while negatively impacting other sectors. The automotive and transportation segment is expected to lead the market, supported by innovations in tire manufacturing and the growth of the oil and gas sector.

    Key Market Trends & Highlights

    Key trends influencing the Rubber Vulcanization Market include sector growth and regulatory challenges.

    • Automotive & transportation segment anticipated to dominate the market during the forecast period.
    • Healthcare sector's demand for rubber products is expected to drive market growth during COVID-19.
    • APAC region projected to lead the market due to high automotive demand in countries like India and China.
    • Fluctuating raw material prices are expected to hinder market growth.

    Market Size & Forecast

    Market Size in 2030 USD 3,793 billion
    CAGR 2.86%
    Major Growth Drivers Automotive and healthcare sectors
    Key Challenges Stringent regulations and raw material price fluctuations

    Major Players

    LANXESS (Germany), BASF SE (Germany), Arkema SA (France), Eastman Chemical Company (US), Kumho Petrochemical (South Korea), Sumitomo Chemical Co., Ltd. (Japan), Duslo, a.s. (Slovakia), Shandong Stair Chemical & Technology Co., Ltd (China), Willing New Materials Technology Co., Ltd (China), King Industries, Inc (US)

    Market Trends

    The ongoing advancements in rubber processing technologies and the increasing demand for high-performance rubber products are likely to drive the growth of the global rubber vulcanization market in the coming years.

    U.S. Department of Commerce

    Rubber Vulcanization Market Market Drivers

    Rising Demand for Automotive Tires

    The Global Rubber Vulcanization Market Industry experiences a notable surge in demand for automotive tires, driven by the increasing production of vehicles worldwide. As of 2024, the market is valued at approximately 2661.4 USD Billion, reflecting the automotive sector's pivotal role in rubber consumption. The vulcanization process enhances tire durability and performance, making it essential for manufacturers. With the automotive industry projected to grow, the demand for high-quality, vulcanized rubber tires is expected to rise, thereby propelling the overall market. This trend indicates a robust future for the Global Rubber Vulcanization Market, as tire manufacturers seek innovative solutions to meet consumer expectations.

    Growth of the Construction Industry

    The Global Rubber Vulcanization Market Industry is poised for growth, largely due to the expansion of the construction sector. The increasing demand for durable and resilient materials in construction applications drives the need for vulcanized rubber products, such as seals, gaskets, and flooring. As urbanization accelerates globally, the construction industry is expected to flourish, thereby enhancing the demand for rubber materials. This growth is reflected in the projected market value of 4367.3 USD Billion by 2035, indicating a sustained interest in high-performance rubber solutions. Consequently, the vulcanization process becomes crucial in meeting the rigorous demands of the construction sector.

    Emerging Markets and Economic Growth

    Emerging markets are playing a pivotal role in shaping the Global Rubber Vulcanization Market Industry. Countries in Asia-Pacific and Latin America are experiencing rapid economic growth, leading to increased industrialization and urbanization. This growth drives the demand for rubber products across various sectors, including automotive, construction, and consumer goods. As these economies expand, the market is expected to grow at a compound annual growth rate (CAGR) of 4.61% from 2025 to 2035. This trend indicates a robust potential for the vulcanization industry as manufacturers seek to establish a presence in these burgeoning markets, capitalizing on the rising demand for high-quality rubber products.

    Market Trends and Growth Projections

    Technological Advancements in Rubber Processing

    Technological advancements in rubber processing techniques are significantly influencing the Global Rubber Vulcanization Market Industry. Innovations such as improved mixing technologies and advanced curing methods enhance the efficiency and quality of vulcanized rubber products. These advancements not only reduce production costs but also improve the performance characteristics of rubber, making it more appealing to various industries. As manufacturers adopt these technologies, they can produce higher-quality products that meet stringent regulatory standards. This trend suggests a promising growth trajectory for the market, as companies leverage technology to gain a competitive edge and cater to evolving consumer demands.

    Environmental Regulations and Sustainability Initiatives

    The Global Rubber Vulcanization Market Industry is increasingly influenced by stringent environmental regulations and sustainability initiatives. Governments worldwide are implementing policies aimed at reducing carbon footprints and promoting eco-friendly materials. As a result, manufacturers are compelled to adopt sustainable practices in rubber production, including the use of recycled materials and eco-friendly vulcanization processes. This shift not only aligns with regulatory requirements but also caters to the growing consumer preference for sustainable products. Consequently, the market is likely to witness a transformation as companies innovate to meet these environmental standards, thereby enhancing their market position.

    Market Segment Insights

    Regional Insights

    Key Companies in the Rubber Vulcanization Market market include

    Industry Developments

    In March 2018,

    The Kumho Petrochemical Company back in the day had announced the latest collaborations with the Chinese firms' Sh and ong Chemical Company in order to increase their market production by financing the same to the most. This ensured a smooth marketing of the entire department, making sure of the production and retailing of the consumer good in a satisfactory manner.

    The research partners of Laxness also had merged with small firms in the Asia Pacific countries to ensure the proper supply of the raw materials and professional assistance.

    Key Players Listed in the Report

      • BASF SE (Germany)
      • Arkema SA (France)
      • Kumho Petrochemical (South Korea)
      • Sumitomo Chemical Co., Ltd. (Japan)
      • Duslo, a.s. (Slovakia)
      • Shandong Stair Chemical & Technology Co., Ltd (China)
      • Willing New Materials Technology Co., Ltd (China)
      • King Industries, Inc (US)

    Future Outlook

    Rubber Vulcanization Market Future Outlook

    The Global Rubber Vulcanization Market is projected to grow at a 4.61% CAGR from 2024 to 2035, driven by technological advancements, increasing automotive production, and rising demand for durable rubber products.

    New opportunities lie in:

    • Invest in advanced vulcanization technologies to enhance product performance and sustainability.
    • Expand into emerging markets with tailored rubber solutions for local industries.
    • Develop eco-friendly vulcanization agents to meet increasing regulatory demands and consumer preferences.

    By 2035, the market is expected to exhibit robust growth, reflecting evolving industry dynamics and consumer trends.

    Market Segmentation

    In March 2018,

    • King Industries, Inc (US)
    • Willing New Materials Technology Co., Ltd (China)
    • Shandong Stair Chemical & Technology Co., Ltd (China)
    • Duslo, a.s. (Slovakia)
    • Sumitomo Chemical Co., Ltd. (Japan)
    • Kumho Petrochemical (South Korea)
    • Eastman Chemical Company (US)
    • Arkema SA (France)
    • BASF SE (Germany)
    • LANXESS (Germany)

    Recent Development

    • King Industries, Inc (US)
    • Willing New Materials Technology Co., Ltd (China)
    • Shandong Stair Chemical & Technology Co., Ltd (China)
    • Duslo, a.s. (Slovakia)
    • Sumitomo Chemical Co., Ltd. (Japan)
    • Kumho Petrochemical (South Korea)
    • Eastman Chemical Company (US)
    • Arkema SA (France)
    • BASF SE (Germany)
    • LANXESS (Germany)

    Segmentation Table

    • Others
    • Healthcare
    • Consumer goods
    • Automotive & transportation
    • Industrial
    • Activators
    • Accelerators
    • Vulcanizing agent
    • Other curing techniques
    • Sulfur vulcanization

    Competitive Landscape

    • King Industries, Inc (US)
    • Willing New Materials Technology Co., Ltd (China)
    • Shandong Stair Chemical & Technology Co., Ltd (China)
    • Duslo, a.s. (Slovakia)
    • Sumitomo Chemical Co., Ltd. (Japan)
    • Kumho Petrochemical (South Korea)
    • Eastman Chemical Company (US)
    • Arkema SA (France)
    • BASF SE (Germany)
    • LANXESS (Germany)

    Key Players Listed in the Report

    • King Industries, Inc (US)
    • Willing New Materials Technology Co., Ltd (China)
    • Shandong Stair Chemical & Technology Co., Ltd (China)
    • Duslo, a.s. (Slovakia)
    • Sumitomo Chemical Co., Ltd. (Japan)
    • Kumho Petrochemical (South Korea)
    • Eastman Chemical Company (US)
    • Arkema SA (France)
    • BASF SE (Germany)
    • LANXESS (Germany)

    Global Rubber Vulcanization Market, By Type

    • Activators
    • Accelerators
    • Vulcanizing agent
    • Other curing techniques
    • Sulfur vulcanization

    Global Rubber Vulcanization Market, By Technique

    • Other curing techniques
    • Sulfur vulcanization

    Global Rubber Vulcanization Market, By Application

    • Others
    • Healthcare
    • Consumer goods
    • Automotive & transportation
    • Industrial
    • Activators
    • Accelerators
    • Vulcanizing agent
    • Other curing techniques
    • Sulfur vulcanization

    Report Scope

    Report Attribute/Metric Details
      Market Size 2030: USD 3,793 billion
      CAGR   2.86% (2022-2030)
      Base Year   2021
      Forecast Period   2022 to 2030
      Historical Data   2019 & 2020
      Forecast Units   Value (USD Million)
      Report Coverage   Revenue Forecast, Competitive Landscape, Growth Factors, and Trends
      Segments Covered   By Type, Accelerators, Technique, End-Use Industry and Region
      Geographies Covered    North America, Europe, Asia-Pacific, and Rest of the World (RoW)
      Key Vendors   LANXESS (Germany),BASF SE (Germany),Arkema SA (France),Eastman Chemical Company (US),Kumho Petrochemical (South Korea), Sumitomo Chemical Co., Ltd. (Japan),Duslo, a.s. (Slovakia),Shandong Stair Chemical & Technology Co., Ltd (China),Willing New Materials Technology Co., Ltd (China),King Industries, Inc (US)
      Key Market Opportunities   Innovation of New Tires to Provide Significant Opportunity for Market Expansion
      Key Market Drivers   Growing Demand of Rubber from the Manufacturing Sector to Boost the Market Growth

    Market Highlights

    Author

    Chitranshi Jaiswal
    Research Analyst Level I

    She holds an experience of about 6+ years in market research and business consulting, working under the spectrum of information communication technology, telecommunications and semiconductor domains. aarti conceptualizes and implements a scalable business strategy and provides strategic leadership to the clients. her expertise lies in market estimation, competitive intelligence, pipeline analysis, customer assessment, etc.

    Leave a Comment

    Latest Comments

    John Doe
    john@example.com

    This is a great article! Really helped me understand the topic better.

    Posted on July 23, 2025, 10:15 AM
    Jane Smith
    jane@domain.com

    Thanks for sharing this. I’ve bookmarked it for later reference.

    Posted on July 22, 2025, 7:45 PM

    FAQs

    1. Executive Summary
    2. Market Introduction
      1. Definition 24
      2. Scope of the Study 24
      3. Market Structure 24
    3. Market Insights
    4. Research Methodology
      1. Research Process 28
      2. Primary Research 29
      3. Secondary Research 30
      4. Market Size Estimation 30
      5. Forecast Model 31
      6. List Of Assumptions 32
    5. Market Dynamics
      1. Introduction 33
      2. Drivers 34
        1. Growth Of The Automotive & Transportation Industry 34
        2. Increasing Demand For Rubber-Based Products In The Healthcare Sector 35
        3. Growing Use Of Rubber In Industrial And Consumer Goods Applications 36
      3. Restraints 37
        1. Stringent Regulations And Adverse Effects Associated With Rubber Production 37
      4. Opportunities 38
        1. Growing Adoption In The Oil & Gas Industry 38
      5. Trend 39
        1. Adoption Of Devulcanization Technology 39
    6. Market Factor Analysis
      1. Supply Chain Analysis 40
        1. Raw Materials 40
        2. Vulcanization Process 41
        3. End-Use Industry 41
      1. Porter’s Five Forces Analysis 42
        1. Threat Of New Entrants 42
        2. Threat Of Rivalry 42
        3. Threat Of Substitutes 43
        4. Bargaining Power Of Suppliers 43
        5. Bargaining Power Of Buyers 43
      2. Pricing Analysis (2020–2020) 43
    7. Global Rubber Vulcanization Market, By Type
      1. Introduction 45
      2. Vulcanizing Agent 47
        1. Sulphur 48
        2. Tellurium 50
        3. Selenium 51
        4. Metallic Oxides 52
        5. Others 53
      3. Accelerators 54
        1. Dithiocarbamate 55
        2. Dithiophosphate 56
        3. Sulfenamides 57
        4. Xanthates 58
        5. Others 59
      4. Activators 60
      5. Others 62
    8. Global Rubber Vulcanization Market, By Technique
      1. Introduction 63
      2. Sulfur Vulcanization 64
      3. Other Curing Technique 66
    9. Global Rubber Vulcanization Market, By End-Use Industry
      1. Introduction 68
      2. Automotive & Transportation 70
      3. Industrial 71
      4. Consumer Goods 72
      5. Healthcare 73
      6. Others 74
    10. Global Rubber Vulcanization Market, By Region
      1. Introduction 76
      2. North America 82
        1. US 87
        2. Canada 92
      3. Europe 96
        1. Germany 103
        2. France 107
        3. UK 112
        4. Italy 116
        5. Russia 121
        6. Spain 125
        7. The Netherlands 130
        8. Belgium 134
        9. Poland 139
        10. Rest Of Europe 143
      4. Asia-Pacific 148
        1. China 154
        2. Japan 158
        3. India 163
        4. South Korea 167
        5. Australia And New Zealand 172
        6. Thailand 176
        7. Malaysia 181
        8. Indonesia 185
        9. Rest Of Asia-Pacific 190
      5. Latin America 194
        1. Mexico 200
        2. Brazil 204
        3. Argentina 209
        4. Rest Of Latin America 214
      6. Middle East And Africa 218
        1. Turkey 224
        2. UAE 229
        3. Saudi Arabia 233
        4. Israel 238
        5. North Africa 242
        6. Rest Of Middle East And Africa 247
    11. Competitive Landscape
      1. Introduction 253
      2. Market Strategy Analysis 253
    12. Company Profiles
      1. LANXESS 255
        1. Company Overview 255
        2. Financial Overview 255
        3. Products Offered 256
        4. Key Developments 256
        5. SWOT Analysis 256
        6. Key Strategies 256
      2. Eastman Chemical Company 257
        1. Company Overview 257
        2. Financial Overview 257
        3. Products Offered 258
        4. Key Developments 258
        5. SWOT Analysis 258
        6. Key Strategies 258
      3. Arkema SA_x005F_x000B_ 259
        1. Company Overview 259
        2. Financial Overview 259
        3. Products Offered 260
        4. Key Developments 260
        5. SWOT Analysis 260
        6. Key Strategies 260
      4. BASF SE 261
        1. Company Overview 261
        2. Financial Overview 261
        3. Products Offered 262
        4. Key Developments 262
        5. SWOT Analysis 262
        6. Key Strategies 262
      5. Kumho Petrochemical 263
        1. Company Overview 263
        2. Financial Overview 263
        3. Products Offered 264
        4. Key Developments 264
        5. SWOT Analysis 264
        6. Key Strategies 264
      6. Sumitomo Chemical Co., Ltd. 265
        1. Company Overview 265
        2. Financial Overview 265
        3. Products Offered 266
        4. Key Developments 266
        5. SWOT Analysis 266
        6. Key Strategies 266
      7. Duslo, A.S. 267
        1. Company Overview 267
        2. Financial Overview 267
        3. Products Offered 267
        4. Key Developments 267
        5. SWOT Analysis 268
        6. Key Strategies 268
      8. Shandong Stair Chemical & Technology Co., Ltd. 269
        1. Company Overview 269
        2. Financial Overview 269
        3. Products Offered 269
        4. Key Developments 269
        5. SWOT Analysis 269
        6. Key Strategies 270
      9. Willing New Materials Technology Co., Ltd 271
        1. Company Overview 271
        2. Financial Overview 271
        3. Products Offered 271
        4. Key Developments 271
        5. SWOT Analysis 272
        6. Key Strategies 272
      10. King Industries, Inc 273
        1. Company Overview 273
        2. Financial Overview 273
        3. Products Offered 273
        4. Key Developments 273
        5. SWOT Analysis 273
        6. Key Strategies 273
    13. Conclusion
      1. Key Findings 274
    14. List of Tables and Figures
      1. 14 List Of Tables
      2. TABLE 1 MARKET SYNOPSIS 23
      3. TABLE 2 LIST OF ASSUMPTIONS 32
      4. TABLE 3 GLOBAL RUBBER VULCANIZATION MARKET PRICING (USD/TON) (2020–2020) 44
      5. TABLE 4 GLOBAL RUBBER VULCANIZATION MARKET, BY TYPE, 2020‒2027 (USD MILLION) 45
      6. TABLE 5 GLOBAL RUBBER VULCANIZATION MARKET, BY TYPE, 2020‒2027 (KILO TONS) 46
      7. TABLE 6 GLOBAL RUBBER VULCANIZATION MARKET, BY VULCANIZING AGENT, 2020‒2027 (USD MILLION) 47
      8. TABLE 7 GLOBAL RUBBER VULCANIZATION MARKET, BY VULCANIZING AGENT, 2020‒2027 (KILO TONS) 47
      9. TABLE 8 VULCANIZING AGENT: GLOBAL RUBBER VULCANIZATION MARKET, BY REGION, 2020‒2027 (USD MILLION) 48
      10. TABLE 9 VULCANIZING AGENT: GLOBAL RUBBER VULCANIZATION MARKET, BY REGION, 2020‒2027 (KILO TONS) 48
      11. TABLE 10 SULPHUR: GLOBAL RUBBER VULCANIZATION MARKET, BY REGION, 2020‒2027 (USD MILLION) 49
      12. TABLE 11 SULPHUR: GLOBAL RUBBER VULCANIZATION MARKET, BY REGION, 2020‒2027 (KILO TONS) 49
      13. TABLE 12 TELLURIUM: GLOBAL RUBBER VULCANIZATION MARKET, BY REGION, 2020‒2027 (USD MILLION) 50
      14. TABLE 13 TELLURIUM: GLOBAL RUBBER VULCANIZATION MARKET, BY REGION, 2020‒2027 (KILO TONS) 50
      15. TABLE 14 SELENIUM: GLOBAL RUBBER VULCANIZATION MARKET, BY REGION, 2020‒2027 (USD MILLION) 51
      16. TABLE 15 SELENIUM: GLOBAL RUBBER VULCANIZATION MARKET, BY REGION, 2020‒2027 (KILO TONS) 51
      17. TABLE 16 METALLIC OXIDES: GLOBAL RUBBER VULCANIZATION MARKET, BY REGION, 2020‒2027 (USD MILLION) 52
      18. TABLE 17 METALLIC OXIDES: GLOBAL RUBBER VULCANIZATION MARKET, BY REGION, 2020‒2027 (KILO TONS) 52
      19. TABLE 18 OTHERS: GLOBAL RUBBER VULCANIZATION MARKET, BY REGION, 2020‒2027 (USD MILLION) 53
      20. TABLE 19 OTHERS: GLOBAL RUBBER VULCANIZATION MARKET, BY REGION, 2020‒2027 (KILO TONS) 53
      21. TABLE 20 GLOBAL RUBBER VULCANIZATION MARKET, BY ACCELERATORS, 2020‒2027 (USD MILLION) 54
      22. TABLE 21 GLOBAL RUBBER VULCANIZATION MARKET, BY ACCELERATORS, 2020‒2027 (KILO TONS) 54
      23. TABLE 22 ACCELERATORS: GLOBAL RUBBER VULCANIZATION MARKET, BY REGION, 2020‒2027 (USD MILLION) 55
      24. TABLE 23 ACCELERATORS: GLOBAL RUBBER VULCANIZATION MARKET, BY REGION, 2020‒2027 (KILO TONS) 55
      25. TABLE 24 DITHIOCARBAMATE: GLOBAL RUBBER VULCANIZATION MARKET, BY REGION, 2020‒2027 (USD MILLION) 56
      26. TABLE 25 DITHIOCARBAMATE: GLOBAL RUBBER VULCANIZATION MARKET, BY REGION, 2020‒2027 (KILO TONS) 56
      27. TABLE 26 DITHIOPHOSPHATE: GLOBAL RUBBER VULCANIZATION MARKET, BY REGION, 2020‒2027 (USD MILLION) 57
      28. TABLE 27 DITHIOPHOSPHATE: GLOBAL RUBBER VULCANIZATION MARKET, BY REGION, 2020‒2027 (KILO TONS) 57
      29. TABLE 28 SULFENAMIDES: GLOBAL RUBBER VULCANIZATION MARKET, BY REGION, 2020‒2027 (USD MILLION) 58
      30. TABLE 29 SULFENAMIDES: GLOBAL RUBBER VULCANIZATION MARKET, BY REGION, 2020‒2027 (KILO TONS) 58
      31. TABLE 30 XANTHATES: GLOBAL RUBBER VULCANIZATION MARKET, BY REGION, 2020‒2027 (USD MILLION) 59
      32. TABLE 31 XANTHATES: GLOBAL RUBBER VULCANIZATION MARKET, BY REGION, 2020‒2027 (KILO TONS) 59
      33. TABLE 32 OTHERS: GLOBAL RUBBER VULCANIZATION MARKET, BY REGION, 2020‒2027 (USD MILLION) 60
      34. TABLE 33 OTHERS: GLOBAL RUBBER VULCANIZATION MARKET, BY REGION, 2020‒2027 (KILO TONS) 60
      35. TABLE 34 ACTIVATORS: GLOBAL RUBBER VULCANIZATION MARKET, BY REGION, 2020‒2027 (USD MILLION) 61
      36. TABLE 35 ACTIVATORS: GLOBAL RUBBER VULCANIZATION MARKET, BY REGION, 2020‒2027 (KILO TONS) 61
      37. TABLE 36 OTHERS: GLOBAL RUBBER VULCANIZATION MARKET, BY REGION, 2020‒2027 (USD MILLION) 62
      38. TABLE 37 OTHERS: GLOBAL RUBBER VULCANIZATION MARKET, BY REGION, 2020‒2027 (KILO TONS) 62
      39. TABLE 38 GLOBAL RUBBER VULCANIZATION MARKET, BY TECHNIQUE, 2020‒2027 (USD MILLION) 63
      40. TABLE 39 GLOBAL RUBBER VULCANIZATION MARKET, BY TECHNIQUE, 2020‒2027 (KILO TONS) 64
      41. TABLE 40 SULFUR VULCANIZATION: GLOBAL RUBBER VULCANIZATION MARKET, BY REGION, 2020‒2027 (USD MILLION) 65
      42. TABLE 41 SULFUR VULCANIZATION: GLOBAL RUBBER VULCANIZATION MARKET, BY REGION, 2020‒2027 (KILO TONS) 65
      43. TABLE 42 OTHER CURING TECHNIQUE: GLOBAL RUBBER VULCANIZATION MARKET, BY REGION, 2020‒2027 (USD MILLION) 66
      44. TABLE 43 OTHER CURING TECHNIQUE: GLOBAL RUBBER VULCANIZATION MARKET, BY REGION, 2020‒2027 (KILO TONS) 67
      45. TABLE 44 GLOBAL RUBBER VULCANIZATION MARKET, BY END-USE INDUSTRY, 2020‒2027 (USD MILLION) 68
      46. TABLE 45 GLOBAL RUBBER VULCANIZATION MARKET, BY END-USE INDUSTRY, 2020‒2027 (KILO TONS) 69
      47. TABLE 46 AUTOMOTIVE & TRANSPORTATION: GLOBAL RUBBER VULCANIZATION MARKET, BY REGION, 2020‒2027 (USD MILLION) 70
      48. TABLE 47 AUTOMOTIVE & TRANSPORTATION: GLOBAL RUBBER VULCANIZATION MARKET, BY REGION, 2020‒2027 (KILO TONS) 70
      49. TABLE 48 INDUSTRIAL: GLOBAL RUBBER VULCANIZATION MARKET, BY REGION, 2020‒2027 (USD MILLION) 71
      50. TABLE 49 INDUSTRIAL: GLOBAL RUBBER VULCANIZATION MARKET, BY REGION, 2020‒2027 (KILO TONS) 71
      51. TABLE 50 CONSUMER GOODS: GLOBAL RUBBER VULCANIZATION MARKET, BY REGION, 2020‒2027 (USD MILLION) 72
      52. TABLE 51 CONSUMER GOODS: GLOBAL RUBBER VULCANIZATION MARKET, BY REGION, 2020‒2027 (KILO TONS) 72
      53. TABLE 52 HEALTHCARE: GLOBAL RUBBER VULCANIZATION MARKET, BY REGION, 2020‒2027 (USD MILLION) 73
      54. TABLE 53 HEALTHCARE: GLOBAL RUBBER VULCANIZATION MARKET, BY REGION, 2020‒2027 (KILO TONS) 73
      55. TABLE 54 OTHERS: GLOBAL RUBBER VULCANIZATION MARKET, BY REGION, 2020‒2027 (USD MILLION) 74
      56. TABLE 55 OTHERS: GLOBAL RUBBER VULCANIZATION MARKET, BY REGION, 2020‒2027 (KILO TONS) 75
      57. TABLE 56 GLOBAL RUBBER VULCANIZATION MARKET, BY REGION, 2020‒2027 (USD MILLION) 76
      58. TABLE 57 GLOBAL RUBBER VULCANIZATION MARKET, BY REGION, 2020‒2027 (KILO TONS) 77
      59. TABLE 58 GLOBAL RUBBER VULCANIZATION MARKET, BY TYPE, 2020‒2027 (USD MILLION) 78
      60. TABLE 59 GLOBAL RUBBER VULCANIZATION MARKET, BY TYPE, 2020‒2027 (KILO TONS) 78
      61. TABLE 60 GLOBAL RUBBER VULCANIZATION MARKET, BY VULCANIZING AGENT, 2020‒2027 (USD MILLION) 79
      62. TABLE 61 GLOBAL RUBBER VULCANIZATION MARKET, BY VULCANIZING AGENT, 2020‒2027 (KILO TONS) 79
      63. TABLE 62 GLOBAL RUBBER VULCANIZATION MARKET, BY ACCELERATORS, 2020‒2027 (USD MILLION) 80
      64. TABLE 63 GLOBAL RUBBER VULCANIZATION MARKET, BY ACCELERATORS, 2020‒2027 (KILO TONS) 80
      65. TABLE 64 GLOBAL RUBBER VULCANIZATION MARKET, BY TECHNIQUE, 2020‒2027 (USD MILLION) 80
      66. TABLE 65 GLOBAL RUBBER VULCANIZATION MARKET, BY TECHNIQUE, 2020‒2027 (KILO TONS) 81
      67. TABLE 66 GLOBAL RUBBER VULCANIZATION MARKET, BY END-USE INDUSTRY, 2020‒2027 (USD MILLION) 81
      68. TABLE 67 GLOBAL RUBBER VULCANIZATION MARKET, BY END-USE INDUSTRY, 2020‒2027 (KILO TONS) 82
      69. TABLE 68 NORTH AMERICA: RUBBER VULCANIZATION MARKET, BY COUNTRY, 2020‒2027 (USD MILLION) 82
      70. TABLE 69 NORTH AMERICA: RUBBER VULCANIZATION MARKET, BY COUNTRY, 2020‒2027 (KILO TONS) 83
      71. TABLE 70 NORTH AMERICA: RUBBER VULCANIZATION MARKET, BY TYPE, 2020‒2027 (USD MILLION) 83
      72. TABLE 71 NORTH AMERICA: RUBBER VULCANIZATION MARKET, BY TYPE, 2020‒2027 (KILO TONS) 83
      73. TABLE 72 NORTH AMERICA: RUBBER VULCANIZATION MARKET, BY VULCANIZING AGENT, 2020‒2027 (USD MILLION) 84
      74. TABLE 73 NORTH AMERICA: RUBBER VULCANIZATION MARKET, BY VULCANIZING AGENT, 2020‒2027 (KILO TONS) 84
      75. TABLE 74 NORTH AMERICA: RUBBER VULCANIZATION MARKET, BY ACCELERATORS, 2020‒2027 (USD MILLION) 85
      76. TABLE 75 NORTH AMERICA: RUBBER VULCANIZATION MARKET, BY ACCELERATORS, 2020‒2027 (KILO TONS) 85
      77. TABLE 76 NORTH AMERICA: RUBBER VULCANIZATION MARKET, BY TECHNIQUE, 2020‒2027 (USD MILLION) 85
      78. TABLE 77 NORTH AMERICA: RUBBER VULCANIZATION MARKET, BY TECHNIQUE, 2020‒2027 (KILO TONS) 86
      79. TABLE 78 NORTH AMERICA: RUBBER VULCANIZATION MARKET, BY END-USE INDUSTRY, 2020‒2027 (USD MILLION) 86
      80. TABLE 79 NORTH AMERICA: RUBBER VULCANIZATION MARKET, BY END-USE INDUSTRY, 2020‒2027 (KILO TONS) 87
      81. TABLE 80 US: RUBBER VULCANIZATION MARKET, BY TYPE, 2020‒2027 (USD MILLION) 87
      82. TABLE 81 US: RUBBER VULCANIZATION MARKET, BY TYPE, 2020‒2027 (KILO TONS) 88
      83. TABLE 82 US: RUBBER VULCANIZATION MARKET, BY VULCANIZING AGENT, 2020‒2027 (USD MILLION) 88
      84. TABLE 83 US: RUBBER VULCANIZATION MARKET, BY VULCANIZING AGENT, 2020‒2027 (KILO TONS) 89
      85. TABLE 84 US: RUBBER VULCANIZATION MARKET, BY ACCELERATORS, 2020‒2027 (USD MILLION) 89
      86. TABLE 85 US: RUBBER VULCANIZATION MARKET, BY ACCELERATORS, 2020‒2027 (KILO TONS) 90
      87. TABLE 86 US: RUBBER VULCANIZATION MARKET, BY TECHNIQUE, 2020‒2027 (USD MILLION) 90
      88. TABLE 87 US: RUBBER VULCANIZATION MARKET, BY TECHNIQUE, 2020‒2027 (KILO TONS) 90
      89. TABLE 88 US: RUBBER VULCANIZATION MARKET, BY END-USE INDUSTRY, 2020‒2027 (USD MILLION) 91
      90. TABLE 89 US: RUBBER VULCANIZATION MARKET, BY END-USE INDUSTRY, 2020‒2027 (KILO TONS) 91
      91. TABLE 90 CANADA: RUBBER VULCANIZATION MARKET, BY TYPE, 2020‒2027 (USD MILLION) 92
      92. TABLE 91 CANADA: RUBBER VULCANIZATION MARKET, BY TYPE, 2020‒2027 (KILO TONS) 92
      93. TABLE 92 US: RUBBER VULCANIZATION MARKET, BY VULCANIZING AGENT, 2020‒2027 (USD MILLION) 93
      94. TABLE 93 US: RUBBER VULCANIZATION MARKET, BY VULCANIZING AGENT, 2020‒2027 (KILO TONS) 93
      95. TABLE 94 US: RUBBER VULCANIZATION MARKET, BY ACCELERATORS, 2020‒2027 (USD MILLION) 94
      96. TABLE 95 US: RUBBER VULCANIZATION MARKET, BY ACCELERATORS, 2020‒2027 (KILO TONS) 94
      97. TABLE 96 CANADA: RUBBER VULCANIZATION MARKET, BY TECHNIQUE, 2020‒2027 (USD MILLION) 94
      98. TABLE 97 CANADA: RUBBER VULCANIZATION MARKET, BY TECHNIQUE, 2020‒2027 (KILO TONS) 95
      99. TABLE 98 CANADA: RUBBER VULCANIZATION MARKET, BY END-USE INDUSTRY, 2020‒2027 (USD MILLION) 95
      100. TABLE 99 CANADA: RUBBER VULCANIZATION MARKET, BY END-USE INDUSTRY, 2020‒2027 (KILO TONS) 96
      101. TABLE 100 EUROPE: RUBBER VULCANIZATION MARKET, BY COUNTRY, 2020‒2027 (USD MILLION) 97
      102. TABLE 101 EUROPE: RUBBER VULCANIZATION MARKET, BY COUNTRY, 2020‒2027 (KILO TONS) 98
      103. TABLE 102 EUROPE: RUBBER VULCANIZATION MARKET, BY TYPE, 2020‒2027 (USD MILLION) 98
      104. TABLE 103 EUROPE: RUBBER VULCANIZATION MARKET, BY TYPE, 2020‒2027 (KILO TONS) 99
      105. TABLE 104 EUROPE: RUBBER VULCANIZATION MARKET, BY VULCANIZING AGENT, 2020‒2027 (USD MILLION) 99
      106. TABLE 105 EUROPE: RUBBER VULCANIZATION MARKET, BY VULCANIZING AGENT, 2020‒2027 (KILO TONS) 100
      107. TABLE 106 EUROPE: RUBBER VULCANIZATION MARKET, BY ACCELERATORS, 2020‒2027 (USD MILLION) 100
      108. TABLE 107 EUROPE: RUBBER VULCANIZATION MARKET, BY ACCELERATORS, 2020‒2027 (KILO TONS) 101
      109. TABLE 108 EUROPE: RUBBER VULCANIZATION MARKET, BY TECHNIQUE, 2020‒2027 (USD MILLION) 101
      110. TABLE 109 EUROPE: RUBBER VULCANIZATION MARKET, BY TECHNIQUE, 2020‒2027 (KILO TONS) 101
      111. TABLE 110 EUROPE: RUBBER VULCANIZATION MARKET, BY END-USE INDUSTRY, 2020‒2027 (USD MILLION) 102
      112. TABLE 111 EUROPE: RUBBER VULCANIZATION MARKET, BY END-USE INDUSTRY, 2020‒2027 (KILO TONS) 102
      113. TABLE 112 GERMANY: RUBBER VULCANIZATION MARKET, BY TYPE, 2020‒2027 (USD MILLION) 103
      114. TABLE 113 GERMANY: RUBBER VULCANIZATION MARKET, BY TYPE, 2020‒2027 (KILO TONS) 103
      115. TABLE 114 GERMANY: RUBBER VULCANIZATION MARKET, BY VULCANIZING AGENT, 2020‒2027 (USD MILLION) 104
      116. TABLE 115 GERMANY: RUBBER VULCANIZATION MARKET, BY VULCANIZING AGENT, 2020‒2027 (KILO TONS) 104
      117. TABLE 116 GERMANY: RUBBER VULCANIZATION MARKET, BY ACCELERATORS, 2020‒2027 (USD MILLION) 105
      118. TABLE 117 GERMANY: RUBBER VULCANIZATION MARKET, BY ACCELERATORS, 2020‒2027 (KILO TONS) 105
      119. TABLE 118 GERMANY: RUBBER VULCANIZATION MARKET, BY TECHNIQUE, 2020‒2027 (USD MILLION) 106
      120. TABLE 119 GERMANY: RUBBER VULCANIZATION MARKET, BY TECHNIQUE, 2020‒2027 (KILO TONS) 106
      121. TABLE 120 GERMANY: RUBBER VULCANIZATION MARKET, BY END-USE INDUSTRY, 2020‒2027 (USD MILLION) 106
      122. TABLE 121 GERMANY: RUBBER VULCANIZATION MARKET, BY END-USE INDUSTRY, 2020‒2027 (KILO TONS) 107
      123. TABLE 122 FRANCE: RUBBER VULCANIZATION MARKET, BY TYPE, 2020‒2027 (USD MILLION) 107
      124. TABLE 123 FRANCE: RUBBER VULCANIZATION MARKET, BY TYPE, 2020‒2027 (KILO TONS) 108
      125. TABLE 124 FRANCE: RUBBER VULCANIZATION MARKET, BY VULCANIZING AGENT, 2020‒2027 (USD MILLION) 108
      126. TABLE 125 FRANCE: RUBBER VULCANIZATION MARKET, BY VULCANIZING AGENT, 2020‒2027 (KILO TONS) 109
      127. TABLE 126 FRANCE: RUBBER VULCANIZATION MARKET, BY ACCELERATORS, 2020‒2027 (USD MILLION) 109
      128. TABLE 127 FRANCE: RUBBER VULCANIZATION MARKET, BY ACCELERATORS, 2020‒2027 (KILO TONS) 110
      129. TABLE 128 FRANCE: RUBBER VULCANIZATION MARKET, BY TECHNIQUE, 2020‒2027 (USD MILLION) 110
      130. TABLE 129 FRANCE: RUBBER VULCANIZATION MARKET, BY TECHNIQUE, 2020‒2027 (KILO TONS) 110
      131. TABLE 130 FRANCE: RUBBER VULCANIZATION MARKET, BY END-USE INDUSTRY, 2020‒2027 (USD MILLION) 111
      132. TABLE 131 FRANCE: RUBBER VULCANIZATION MARKET, BY END-USE INDUSTRY, 2020‒2027 (KILO TONS) 111
      133. TABLE 132 UK: RUBBER VULCANIZATION MARKET, BY TYPE, 2020‒2027 (USD MILLION) 112
      134. TABLE 133 UK: RUBBER VULCANIZATION MARKET, BY TYPE, 2020‒2027 (KILO TONS) 112
      135. TABLE 134 UK: RUBBER VULCANIZATION MARKET, BY VULCANIZING AGENT, 2020‒2027 (USD MILLION) 113
      136. TABLE 135 UK: RUBBER VULCANIZATION MARKET, BY VULCANIZING AGENT, 2020‒2027 (KILO TONS) 113
      137. TABLE 136 UK: RUBBER VULCANIZATION MARKET, BY ACCELERATORS, 2020‒2027 (USD MILLION) 114
      138. TABLE 137 UK: RUBBER VULCANIZATION MARKET, BY ACCELERATORS, 2020‒2027 (KILO TONS) 114
      139. TABLE 138 UK: RUBBER VULCANIZATION MARKET, BY TECHNIQUE, 2020‒2027 (USD MILLION) 115
      140. TABLE 139 UK: RUBBER VULCANIZATION MARKET, BY TECHNIQUE, 2020‒2027 (KILO TONS) 115
      141. TABLE 140 UK: RUBBER VULCANIZATION MARKET, BY END-USE INDUSTRY, 2020‒2027 (USD MILLION) 115
      142. TABLE 141 UK: RUBBER VULCANIZATION MARKET, BY END-USE INDUSTRY, 2020‒2027 (KILO TONS) 116
      143. TABLE 142 ITALY: RUBBER VULCANIZATION MARKET, BY TYPE, 2020‒2027 (USD MILLION) 116
      144. TABLE 143 ITALY: RUBBER VULCANIZATION MARKET, BY TYPE, 2020‒2027 (KILO TONS) 117
      145. TABLE 144 ITALY: RUBBER VULCANIZATION MARKET, BY VULCANIZING AGENT, 2020‒2027 (USD MILLION) 117
      146. TABLE 145 ITALY: RUBBER VULCANIZATION MARKET, BY VULCANIZING AGENT, 2020‒2027 (KILO TONS) 118
      147. TABLE 146 ITALY: RUBBER VULCANIZATION MARKET, BY ACCELERATORS, 2020‒2027 (USD MILLION) 118
      148. TABLE 147 ITALY: RUBBER VULCANIZATION MARKET, BY ACCELERATORS, 2020‒2027 (KILO TONS) 119
      149. TABLE 148 ITALY: RUBBER VULCANIZATION MARKET, BY TECHNIQUE, 2020‒2027 (USD MILLION) 119
      150. TABLE 149 ITALY: RUBBER VULCANIZATION MARKET, BY TECHNIQUE, 2020‒2027 (KILO TONS) 119
      151. TABLE 150 ITALY: RUBBER VULCANIZATION MARKET, BY END-USE INDUSTRY, 2020‒2027 (USD MILLION) 120
      152. TABLE 151 ITALY: RUBBER VULCANIZATION MARKET, BY END-USE INDUSTRY, 2020‒2027 (KILO TONS) 120
      153. TABLE 152 RUSSIA: RUBBER VULCANIZATION MARKET, BY TYPE, 2020‒2027 (USD MILLION) 121
      154. TABLE 153 RUSSIA: RUBBER VULCANIZATION MARKET, BY TYPE, 2020‒2027 (KILO TONS) 121
      155. TABLE 154 RUSSIA: RUBBER VULCANIZATION MARKET, BY VULCANIZING AGENT, 2020‒2027 (USD MILLION) 122
      156. TABLE 155 RUSSIA: RUBBER VULCANIZATION MARKET, BY VULCANIZING AGENT, 2020‒2027 (KILO TONS) 122
      157. TABLE 156 RUSSIA: RUBBER VULCANIZATION MARKET, BY ACCELERATORS, 2020‒2027 (USD MILLION) 123
      158. TABLE 157 RUSSIA: RUBBER VULCANIZATION MARKET, BY ACCELERATORS, 2020‒2027 (KILO TONS) 123
      159. TABLE 158 RUSSIA: RUBBER VULCANIZATION MARKET, BY TECHNIQUE, 2020‒2027 (USD MILLION) 124
      160. TABLE 159 RUSSIA: RUBBER VULCANIZATION MARKET, BY TECHNIQUE, 2020‒2027 (KILO TONS) 124
      161. TABLE 160 RUSSIA: RUBBER VULCANIZATION MARKET, BY END-USE INDUSTRY, 2020‒2027 (USD MILLION) 124
      162. TABLE 161 RUSSIA: RUBBER VULCANIZATION MARKET, BY END-USE INDUSTRY, 2020‒2027 (KILO TONS) 125
      163. TABLE 162 SPAIN: RUBBER VULCANIZATION MARKET, BY TYPE, 2020‒2027 (USD MILLION) 125
      164. TABLE 163 SPAIN: RUBBER VULCANIZATION MARKET, BY TYPE, 2020‒2027 (KILO TONS) 126
      165. TABLE 164 SPAIN: RUBBER VULCANIZATION MARKET, BY VULCANIZING AGENT, 2020‒2027 (USD MILLION) 126
      166. TABLE 165 SPAIN: RUBBER VULCANIZATION MARKET, BY VULCANIZING AGENT, 2020‒2027 (KILO TONS) 127
      167. TABLE 166 SPAIN: RUBBER VULCANIZATION MARKET, BY ACCELERATORS, 2020‒2027 (USD MILLION) 127
      168. TABLE 167 SPAIN: RUBBER VULCANIZATION MARKET, BY ACCELERATORS, 2020‒2027 (KILO TONS) 128
      169. TABLE 168 SPAIN: RUBBER VULCANIZATION MARKET, BY TECHNIQUE, 2020‒2027 (USD MILLION) 128
      170. TABLE 169 SPAIN: RUBBER VULCANIZATION MARKET, BY TECHNIQUE, 2020‒2027 (KILO TONS) 128
      171. TABLE 170 SPAIN: RUBBER VULCANIZATION MARKET, BY END-USE INDUSTRY, 2020‒2027 (USD MILLION) 129
      172. TABLE 171 SPAIN: RUBBER VULCANIZATION MARKET, BY END-USE INDUSTRY, 2020‒2027 (KILO TONS) 129
      173. TABLE 172 THE NETHERLANDS: RUBBER VULCANIZATION MARKET, BY TYPE, 2020‒2027 (USD MILLION) 130
      174. TABLE 173 THE NETHERLANDS: RUBBER VULCANIZATION MARKET, BY TYPE, 2020‒2027 (KILO TONS) 130
      175. TABLE 174 THE NETHERLANDS: RUBBER VULCANIZATION MARKET, BY VULCANIZING AGENT, 2020‒2027 (USD MILLION) 131
      176. TABLE 175 THE NETHERLANDS: RUBBER VULCANIZATION MARKET, BY VULCANIZING AGENT, 2020‒2027 (KILO TONS) 131
      177. TABLE 176 THE NETHERLANDS: RUBBER VULCANIZATION MARKET, BY ACCELERATORS, 2020‒2027 (USD MILLION) 132
      178. TABLE 177 THE NETHERLANDS: RUBBER VULCANIZATION MARKET, BY ACCELERATORS, 2020‒2027 (KILO TONS) 132
      179. TABLE 178 THE NETHERLANDS: RUBBER VULCANIZATION MARKET, BY TECHNIQUE, 2020‒2027 (USD MILLION) 133
      180. TABLE 179 THE NETHERLANDS: RUBBER VULCANIZATION MARKET, BY TECHNIQUE, 2020‒2027 (KILO TONS) 133
      181. TABLE 180 THE NETHERLANDS: RUBBER VULCANIZATION MARKET, BY END-USE INDUSTRY, 2020‒2027 (USD MILLION) 133
      182. TABLE 181 THE NETHERLANDS: RUBBER VULCANIZATION MARKET, BY END-USE INDUSTRY, 2020‒2027 (KILO TONS) 134
      183. TABLE 182 BELGIUM: RUBBER VULCANIZATION MARKET, BY TYPE, 2020‒2027 (USD MILLION) 134
      184. TABLE 183 BELGIUM: RUBBER VULCANIZATION MARKET, BY TYPE, 2020‒2027 (KILO TONS) 135
      185. TABLE 184 BELGIUM: RUBBER VULCANIZATION MARKET, BY VULCANIZING AGENT, 2020‒2027 (USD MILLION) 135
      186. TABLE 185 BELGIUM: RUBBER VULCANIZATION MARKET, BY VULCANIZING AGENT, 2020‒2027 (KILO TONS) 136
      187. TABLE 186 BELGIUM: RUBBER VULCANIZATION MARKET, BY ACCELERATORS, 2020‒2027 (USD MILLION) 136
      188. TABLE 187 BELGIUM: RUBBER VULCANIZATION MARKET, BY ACCELERATORS, 2020‒2027 (KILO TONS) 137
      189. TABLE 188 BELGIUM: RUBBER VULCANIZATION MARKET, BY TECHNIQUE, 2020‒2027 (USD MILLION) 137
      190. TABLE 189 BELGIUM: RUBBER VULCANIZATION MARKET, BY TECHNIQUE, 2020‒2027 (KILO TONS) 137
      191. TABLE 190 BELGIUM: RUBBER VULCANIZATION MARKET, BY END-USE INDUSTRY, 2020‒2027 (USD MILLION) 138
      192. TABLE 191 BELGIUM: RUBBER VULCANIZATION MARKET, BY END-USE INDUSTRY, 2020‒2027 (KILO TONS) 138
      193. TABLE 192 POLAND: RUBBER VULCANIZATION MARKET, BY TYPE, 2020‒2027 (USD MILLION) 139
      194. TABLE 193 POLAND: RUBBER VULCANIZATION MARKET, BY TYPE, 2020‒2027 (KILO TONS) 139
      195. TABLE 194 POLAND: RUBBER VULCANIZATION MARKET, BY VULCANIZING AGENT, 2020‒2027 (USD MILLION) 140
      196. TABLE 195 POLAND: RUBBER VULCANIZATION MARKET, BY VULCANIZING AGENT, 2020‒2027 (KILO TONS) 140
      197. TABLE 196 POLAND: RUBBER VULCANIZATION MARKET, BY ACCELERATORS, 2020‒2027 (USD MILLION) 141
      198. TABLE 197 POLAND: RUBBER VULCANIZATION MARKET, BY ACCELERATORS, 2020‒2027 (KILO TONS) 141
      199. TABLE 198 POLAND: RUBBER VULCANIZATION MARKET, BY TECHNIQUE, 2020‒2027 (USD MILLION) 142
      200. TABLE 199 POLAND: RUBBER VULCANIZATION MARKET, BY TECHNIQUE, 2020‒2027 (KILO TONS) 142
      201. TABLE 200 POLAND: RUBBER VULCANIZATION MARKET, BY END-USE INDUSTRY, 2020‒2027 (USD MILLION) 142
      202. TABLE 201 POLAND: RUBBER VULCANIZATION MARKET, BY END-USE INDUSTRY, 2020‒2027 (KILO TONS) 143
      203. TABLE 202 REST OF EUROPE: RUBBER VULCANIZATION MARKET, BY TYPE, 2020‒2027 (USD MILLION) 143
      204. TABLE 203 REST OF EUROPE: RUBBER VULCANIZATION MARKET, BY TYPE, 2020‒2027 (KILO TONS) 144
      205. TABLE 204 REST OF EUROPE: RUBBER VULCANIZATION MARKET, BY VULCANIZING AGENT, 2020‒2027 (USD MILLION) 144
      206. TABLE 205 REST OF EUROPE: RUBBER VULCANIZATION MARKET, BY VULCANIZING AGENT, 2020‒2027 (KILO TONS) 145
      207. TABLE 206 REST OF EUROPE: RUBBER VULCANIZATION MARKET, BY ACCELERATORS, 2020‒2027 (USD MILLION) 145
      208. TABLE 207 REST OF EUROPE: RUBBER VULCANIZATION MARKET, BY ACCELERATORS, 2020‒2027 (KILO TONS) 146
      209. TABLE 208 REST OF EUROPE: RUBBER VULCANIZATION MARKET, BY TECHNIQUE, 2020‒2027 (USD MILLION) 146
      210. TABLE 209 REST OF EUROPE: RUBBER VULCANIZATION MARKET, BY TECHNIQUE, 2020‒2027 (KILO TONS) 146
      211. TABLE 210 REST OF EUROPE: RUBBER VULCANIZATION MARKET, BY END-USE INDUSTRY, 2020‒2027 (USD MILLION) 147
      212. TABLE 211 REST OF EUROPE: RUBBER VULCANIZATION MARKET, BY END-USE INDUSTRY, 2020‒2027 (KILO TONS) 147
      213. TABLE 212 ASIA-PACIFIC: RUBBER VULCANIZATION MARKET, BY COUNTRY, 2020‒2027 (USD MILLION) 148
      214. TABLE 213 ASIA-PACIFIC: RUBBER VULCANIZATION MARKET, BY COUNTRY, 2020‒2027 (KILO TONS) 149
      215. TABLE 214 ASIA-PACIFIC: RUBBER VULCANIZATION MARKET, BY TYPE, 2020‒2027 (USD MILLION) 149 ASIA-PACIFIC: RUBBER VULCANIZATION MARKET, BY TYPE, 2020‒2027 (KILO TONS) 150
      216. TABLE 215 ASIA-PACIFIC: RUBBER VULCANIZATION MARKET, BY VULCANIZING AGENT, 2020‒2027 (USD MILLION) 150
      217. TABLE 216 ASIA-PACIFIC: RUBBER VULCANIZATION MARKET, BY VULCANIZING AGENT, 2020‒2027 (KILO TONS) 151
      218. TABLE 217 ASIA-PACIFIC: RUBBER VULCANIZATION MARKET, BY ACCELERATORS, 2020‒2027 (USD MILLION) 151
      219. TABLE 218 ASIA-PACIFIC: RUBBER VULCANIZATION MARKET, BY ACCELERATORS, 2020‒2027 (KILO TONS) 152
      220. TABLE 219 ASIA-PACIFIC: RUBBER VULCANIZATION MARKET, BY TECHNIQUE, 2020‒2027 (USD MILLION) 152
      221. TABLE 220 ASIA-PACIFIC: RUBBER VULCANIZATION MARKET, BY TECHNIQUE, 2020‒2027 (KILO TONS) 152
      222. TABLE 221 ASIA-PACIFIC: RUBBER VULCANIZATION MARKET, BY END-USE INDUSTRY, 2020‒2027 (USD MILLION) 153
      223. TABLE 222 ASIA-PACIFIC: RUBBER VULCANIZATION MARKET, BY END-USE INDUSTRY, 2020‒2027 (KILO TONS) 153
      224. TABLE 223 CHINA: RUBBER VULCANIZATION MARKET, BY TYPE, 2020‒2027 (USD MILLION) 154
      225. TABLE 224 CHINA: RUBBER VULCANIZATION MARKET, BY TYPE, 2020‒2027 (KILO TONS) 154
      226. TABLE 225 CHINA: RUBBER VULCANIZATION MARKET, BY VULCANIZING AGENT, 2020‒2027 (USD MILLION) 155
      227. TABLE 226 CHINA: RUBBER VULCANIZATION MARKET, BY VULCANIZING AGENT, 2020‒2027 (KILO TONS) 155
      228. TABLE 227 CHINA: RUBBER VULCANIZATION MARKET, BY ACCELERATORS, 2020‒2027 (USD MILLION) 156
      229. TABLE 228 CHINA: RUBBER VULCANIZATION MARKET, BY ACCELERATORS, 2020‒2027 (KILO TONS) 156
      230. TABLE 229 CHINA: RUBBER VULCANIZATION MARKET, BY TECHNIQUE, 2020‒2027 (USD MILLION) 156
      231. TABLE 230 CHINA: RUBBER VULCANIZATION MARKET, BY TECHNIQUE, 2020‒2027 (KILO TONS) 157
      232. TABLE 231 CHINA: RUBBER VULCANIZATION MARKET, BY END-USE INDUSTRY, 2020‒2027 (USD MILLION) 157
      233. TABLE 232 CHINA: RUBBER VULCANIZATION MARKET, BY END-USE INDUSTRY, 2020‒2027 (KILO TONS) 158
      234. TABLE 233 JAPAN: RUBBER VULCANIZATION MARKET, BY TYPE, 2020‒2027 (USD MILLION) 158
      235. TABLE 234 JAPAN: RUBBER VULCANIZATION MARKET, BY TYPE, 2020‒2027 (KILO TONS) 159
      236. TABLE 235 JAPAN: RUBBER VULCANIZATION MARKET, BY VULCANIZING AGENT, 2020‒2027 (USD MILLION) 159
      237. TABLE 236 JAPAN: RUBBER VULCANIZATION MARKET, BY VULCANIZING AGENT, 2020‒2027 (KILO TONS) 160
      238. TABLE 237 JAPAN: RUBBER VULCANIZATION MARKET, BY ACCELERATORS, 2020‒2027 (USD MILLION) 160
      239. TABLE 238 JAPAN: RUBBER VULCANIZATION MARKET, BY ACCELERATORS, 2020‒2027 (KILO TONS) 161
      240. TABLE 239 JAPAN: RUBBER VULCANIZATION MARKET, BY TECHNIQUE, 2020‒2027 (USD MILLION) 161
      241. TABLE 240 JAPAN: RUBBER VULCANIZATION MARKET, BY TECHNIQUE, 2020‒2027 (KILO TONS) 161
      242. TABLE 241 JAPAN: RUBBER VULCANIZATION MARKET, BY END-USE INDUSTRY, 2020‒2027 (USD MILLION) 162
      243. TABLE 242 JAPAN: RUBBER VULCANIZATION MARKET, BY END-USE INDUSTRY, 2020‒2027 (KILO TONS) 162
      244. TABLE 243 INDIA: RUBBER VULCANIZATION MARKET, BY TYPE, 2020‒2027 (USD MILLION) 163
      245. TABLE 244 INDIA: RUBBER VULCANIZATION MARKET, BY TYPE, 2020‒2027 (KILO TONS) 163
      246. TABLE 245 INDIA: RUBBER VULCANIZATION MARKET, BY VULCANIZING AGENT, 2020‒2027 (USD MILLION) 164
      247. TABLE 246 INDIA: RUBBER VULCANIZATION MARKET, BY VULCANIZING AGENT, 2020‒2027 (KILO TONS) 164
      248. TABLE 247 INDIA: RUBBER VULCANIZATION MARKET, BY ACCELERATORS, 2020‒2027 (USD MILLION) 165
      249. TABLE 248 INDIA: RUBBER VULCANIZATION MARKET, BY ACCELERATORS, 2020‒2027 (KILO TONS) 165
      250. TABLE 249 INDIA: RUBBER VULCANIZATION MARKET, BY TECHNIQUE, 2020‒2027 (USD MILLION) 166
      251. TABLE 250 INDIA: RUBBER VULCANIZATION MARKET, BY TECHNIQUE, 2020‒2027 (KILO TONS) 166
      252. TABLE 251 INDIA: RUBBER VULCANIZATION MARKET, BY END-USE INDUSTRY, 2020‒2027 (USD MILLION) 166
      253. TABLE 252 INDIA: RUBBER VULCANIZATION MARKET, BY END-USE INDUSTRY, 2020‒2027 (KILO TONS) 167
      254. TABLE 253 SOUTH KOREA: RUBBER VULCANIZATION MARKET, BY TYPE, 2020‒2027 (USD MILLION) 167<

    Rubber Vulcanization Market Segmentation

    Market Segmentation Overview

    • Detailed segmentation data will be available in the full report
    • Comprehensive analysis by multiple parameters
    • Regional and country-level breakdowns
    • Market size forecasts by segment
    Infographic

    Free Sample Request

    Kindly complete the form below to receive a free sample of this Report

    Get Free Sample

    Customer Strories

    “I am very pleased with how market segments have been defined in a relevant way for my purposes (such as "Portable Freezers & refrigerators" and "last-mile"). In general the report is well structured. Thanks very much for your efforts.”

    Victoria Milne

    Founder
    Case Study
    Chemicals and Materials