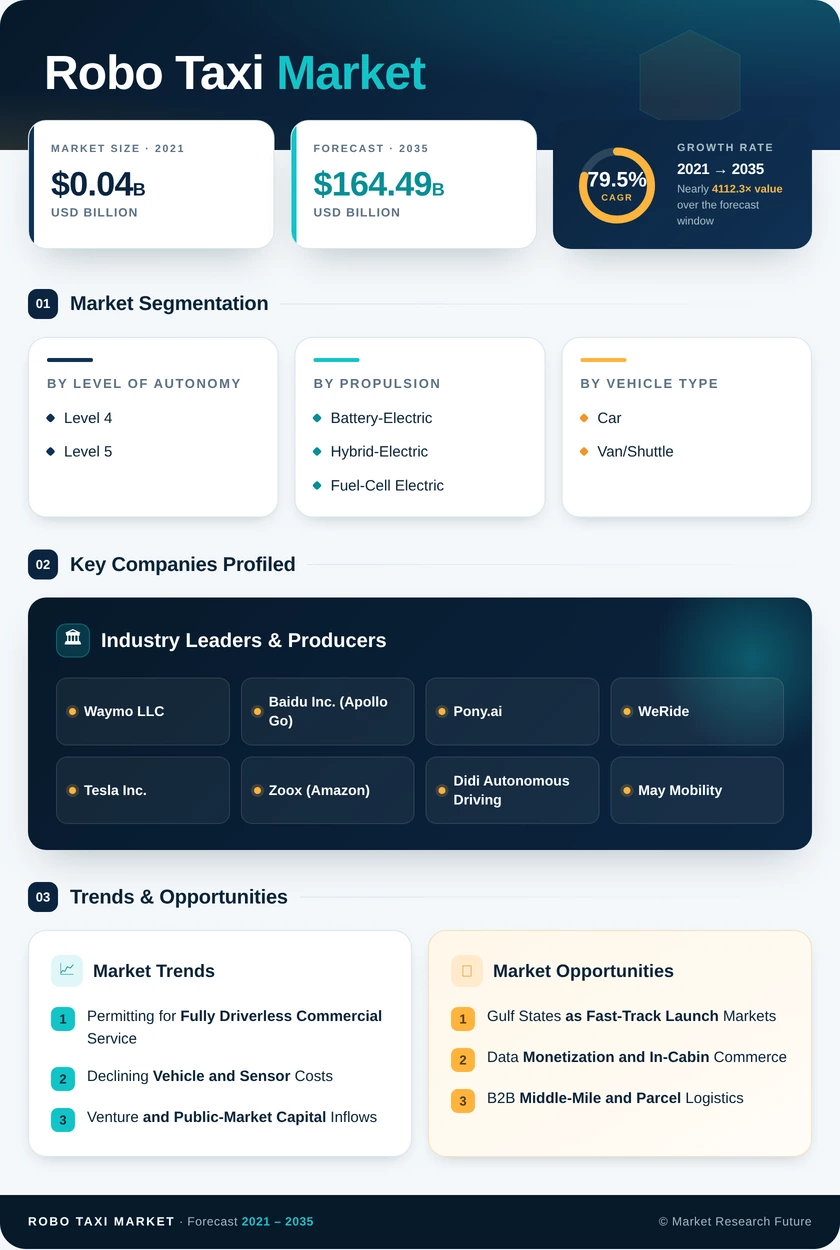
Robo Taxi Market (2026 - 2035)

ID: MRFR/SEM/6461-HCR 200 Pages Ankit Gupta Last Updated: October 21, 2026
Robo Taxi Market Size, Share and Research Report: By Service Type (Ride-Hailing, Car Sharing, Delivery Services), By Technology (Artificial Intelligence, Machine Learning, Sensor Technology), By Vehicle Type (Passenger Cars, Vans, Buses), By End Use (Private Use, Commercial Use) and By Regional (North America, Europe, South America, Asia Pacific, Middle East and Africa) - Industry Forecast Till 2035
Robo Taxi Market
Market Size
Forecast Period2026-2035
CAGR (2026-2035)79.5%
2025 Market SizeUSD 0.46 Billion
2035 Market SizeUSD 164.49 Billion
Key Players
Waymo LLC
Baidu Inc.
Pony.ai
WeRide
Tesla Inc.
Zoox
Opportunities
  • Gulf States as Fast-Track Launch Markets
  • Data Monetization and In-Cabin Commerce
  • B2B Middle-Mile and Parcel Logistics
  1. 1 Market Summary | |
  2. 2 Key Report Takeaways | |
    1. 2.1 By Level of Autonomy | |
    2. 2.2 By Propulsion | |
    3. 2.3 By Vehicle Type | |
    4. 2.4 By Application | |
    5. 2.5 By Service Type | |
    6. 2.6 By Business Model | |
    7. 2.7 By Fleet Ownership | |
    8. 2.8 By Operating Environment | |
    9. 2.9 By Region | |
  3. 3 Market Size and Forecast (2021–2035) | |
  4. 4 Driver Impact Analysis | |
    1. 4.1 Permitting for Fully Driverless Commercial Service | |
    2. 4.2 Declining Vehicle and Sensor Costs | |
    3. 4.3 Venture and Public-Market Capital Inflows | |
    4. 4.4 Elimination of Driver Labor Cost | |
    5. 4.5 Fleet Electrification and Battery Price Declines | |
    6. 4.6 Accumulating Real-World Safety Evidence | |
    7. 4.7 Ride-Hailing Platform Integration | |
  5. 5 Restraints Impact Analysis | |
    1. 5.1 Safety Incidents and Public Trust Shocks | |
    2. 5.2 Fragmented and Slow Federal Regulation | |
    3. 5.3 High Per-Vehicle Capex and Remote-Operations Cost | |
    4. 5.4 Data Security and Cross-Border Technology Restrictions | |
    5. 5.5 Operational Design Domain Limits in Adverse Weather | |
  6. 6 Opportunities | |
    1. 6.1 Gulf States as Fast-Track Launch Markets | |
    2. 6.2 Data Monetization and In-Cabin Commerce | |
    3. 6.3 B2B Middle-Mile and Parcel Logistics | |
    4. 6.4 Public Transit Integration | |
    5. 6.5 European Market Entry | |
  7. 7 Regional Market Share and Country-Level Analysis | |
    1. 7.1 North America | | |
      1. 7.1.1 US | | |
      2. 7.1.2 Canada | | |
      3. 7.1.3 Mexico | |
    2. 7.2 Europe | | |
      1. 7.2.1 Germany | | |
      2. 7.2.2 UK | | |
      3. 7.2.3 France | | |
      4. 7.2.4 Italy | | |
      5. 7.2.5 Spain | | |
      6. 7.2.6 Nordic Countries | | |
      7. 7.2.7 Russia | | |
      8. 7.2.8 Rest of Europe | |
    3. 7.3 Asia-Pacific | | |
      1. 7.3.1 China | | |
      2. 7.3.2 India | | |
      3. 7.3.3 Japan | | |
      4. 7.3.4 South Korea | | |
      5. 7.3.5 ASEAN | | |
      6. 7.3.6 Rest of Asia-Pacific | |
    4. 7.4 South America | | |
      1. 7.4.1 Brazil | | |
      2. 7.4.2 Argentina | | |
      3. 7.4.3 Rest of South America | |
    5. 7.5 Middle East & Africa | | |
      1. 7.5.1 Saudi Arabia | | |
      2. 7.5.2 UAE | | |
      3. 7.5.3 South Africa | | |
      4. 7.5.4 Egypt | | |
      5. 7.5.5 Rest of MEA | |
  8. 8 Future Outlook (2026–2035) | |
    1. 8.1 End-to-End AI and Remote Operations | |
    2. 8.2 Platform Economics | |
    3. 8.3 Electrification Supercycle | |
    4. 8.4 Sustainability and Urban Policy | |
  9. 9 Segmentation Analysis | |
    1. 9.1 By Level of Autonomy | | |
      1. 9.1.1 Level 4 | | |
      2. 9.1.2 Level 5 | |
    2. 9.2 By Propulsion | | |
      1. 9.2.1 Battery-Electric | | |
      2. 9.2.2 Hybrid-Electric | | |
      3. 9.2.3 Fuel-Cell Electric | |
    3. 9.3 By Vehicle Type | | |
      1. 9.3.1 Car | | |
      2. 9.3.2 Van/Shuttle | |
    4. 9.4 By Application | | |
      1. 9.4.1 Passenger Transportation | | |
      2. 9.4.2 Goods/Parcel Transportation | |
    5. 9.5 By Service Type | | |
      1. 9.5.1 Rental-Based (Free-Floating) | | |
      2. 9.5.2 Station-Based | |
    6. 9.6 By Business Model | | |
      1. 9.6.1 B2C | | |
      2. 9.6.2 B2B | |
    7. 9.7 By Fleet Ownership | | |
      1. 9.7.1 Technology Provider-Owned | | |
      2. 9.7.2 OEM-Owned | | |
      3. 9.7.3 Third-Party Fleet Operator | |
    8. 9.8 By Operating Environment | | |
      1. 9.8.1 Urban | | |
      2. 9.8.2 Suburban | | |
      3. 9.8.3 Highway/Inter-City | |
  10. 10 Competitive Landscape | |
    1. 10.1 Market Concentration Analysis | |
    2. 10.2 Competitive Benchmarking Matrix | |
  11. 11 Recent News & Developments | |
  12. 12 Report Scope and Methodology | |
  13. 13 Detailed Sources and Citations | |
  14. 14 Frequently Asked Questions (FAQs) | | LIST OF TABLES | |
  15. TABLE 1 Global Robo-Taxi Market Summary Snapshot, 2025–2035 | |
  16. TABLE 2 Global Robo-Taxi Market Size & Forecast, by Revenue (USD Billion), 2021–2035 | |
  17. TABLE 3 Driver Impact Analysis, 2026–2035 | |
  18. TABLE 4 Restraints Impact Analysis, 2026–2035 | |
  19. TABLE 5 Global Robo-Taxi Market, Regional Summary, 2025 | |
  20. TABLE 6 North America Robo-Taxi Market, by Country, 2025 | |
  21. TABLE 7 Europe Robo-Taxi Market, by Country, 2025 | |
  22. TABLE 8 Asia-Pacific Robo-Taxi Market, by Country, 2025 | |
  23. TABLE 9 South America Robo-Taxi Market, by Country, 2025 | |
  24. TABLE 10 Middle East & Africa Robo-Taxi Market, by Country, 2025 | |
  25. TABLE 11 Global Robo-Taxi Market, by Level of Autonomy | |
  26. TABLE 12 Global Robo-Taxi Market, by Propulsion | |
  27. TABLE 13 Global Robo-Taxi Market, by Vehicle Type | |
  28. TABLE 14 Global Robo-Taxi Market, by Application | |
  29. TABLE 15 Global Robo-Taxi Market, by Service Type | |
  30. TABLE 16 Global Robo-Taxi Market, by Business Model | |
  31. TABLE 17 Global Robo-Taxi Market, by Fleet Ownership | |
  32. TABLE 18 Global Robo-Taxi Market, by Operating Environment | |
  33. TABLE 19 Competitive Benchmarking Matrix, 2025 | |
  34. TABLE 20 Report Scope and Methodology | |
  35. TABLE 21 Detailed Sources and Citations | | LIST OF FIGURES | |
  36. FIGURE 1 Robo-Taxi Market Dynamics — Drivers, Restraints and Opportunities | |
  37. FIGURE 2 Robo-Taxi Value Chain Analysis | |
  38. FIGURE 3 Porter's Five Forces Analysis | |
  39. FIGURE 4 Global Robo-Taxi Market Size Trend (USD Billion), 2021–2035 | |
  40. FIGURE 5 Market Share by Level of Autonomy, 2025 | |
  41. FIGURE 6 Market Share by Propulsion, 2025 | |
  42. FIGURE 7 Market Share by Vehicle Type, 2025 | |
  43. FIGURE 8 Market Share by Application, 2025 | |
  44. FIGURE 9 Market Share by Service Type, 2025 | |
  45. FIGURE 10 Market Share by Business Model, 2025 | |
  46. FIGURE 11 Market Share by Fleet Ownership, 2025 | |
  47. FIGURE 12 Market Share by Operating Environment, 2025 | |
  48. FIGURE 13 Regional Market Share, 2025 | |
  49. FIGURE 14 Competitive Landscape — Estimated Revenue Share Ranges, 2025

Segmentation Quick Reference

Dimension Sub-Segments Dominant Segment Fastest Growing Segment
By Level of Autonomy Level 4; Level 5 Level 4 (58.4% share) Level 5 (81.6% CAGR)
By Propulsion Battery-Electric; Hybrid-Electric; Fuel-Cell Electric Battery-Electric (roughly three-quarters of deployments) Battery-Electric (81.2% CAGR)
By Vehicle Type Car; Van/Shuttle Car (72.9% share) Van/Shuttle (80.4% CAGR)
By Application Passenger Transportation; Goods/Parcel Transportation Passenger Transportation (77.6% share) Goods/Parcel Transportation (85.3% CAGR)
By Service Type Rental-Based (Free-Floating); Station-Based Rental-Based (Free-Floating) (59.3% share) Station-Based (82.4% CAGR)
By Business Model B2C; B2B B2C (50.9% share) B2B (83.2% CAGR)
By Fleet Ownership Technology Provider-Owned; OEM-Owned; Third-Party Fleet Operator Technology Provider-Owned (47.8% share) Third-Party Fleet Operator (84.9% CAGR)
By Operating Environment Urban; Suburban; Highway/Inter-City Urban (71.4% share) Suburban (83.7% CAGR)
By Region North America; Europe; Asia-Pacific; South America; Middle East & Africa Asia-Pacific (52.4% share) Asia-Pacific (81.9% CAGR)

Market Segmentation Overview

By Level of Autonomy

Sub-Segment Key Trend
Level 4 Geofenced commercial permits expanding city by city
Level 5 Steering-wheel-free vehicles gaining exemptions

Level 4 leads because every commercial permit issued so far, in Phoenix, Wuhan or Beijing, covers a mapped and bounded operating zone. Level 5 grows fastest as purpose-built vehicles without manual controls, such as Zoox's, clear exemption processes and operators extend service to freeways and airports.

By Propulsion

Sub-Segment Key Trend
Battery-Electric Purpose-built EV platforms with lower per-mile energy cost
Hybrid-Electric Retained in legacy retrofit fleets
Fuel-Cell Electric Limited to hydrogen-hub pilots

Battery-Electric both leads and grows fastest, because high daily mileage magnifies its energy-cost advantage and zero-emission zones exclude other powertrains. Hybrid-Electric survives in older retrofit fleets but will phase out as those vehicles retire, while Fuel-Cell Electric stays marginal without refueling networks.

By Vehicle Type

Sub-Segment Key Trend
Car Sedan and SUV platforms dominate passenger service
Van/Shuttle Fixed-route campus, airport and parcel deployments

Car leads because riders expect a ride-hail cabin and automakers already supply certified platforms for sensor integration. Van/Shuttle grows faster since low-speed fixed routes are simpler to certify, and convertible interiors let one chassis serve passengers and parcels.

By Application

Sub-Segment Key Trend
Passenger Transportation Urban consumers replacing ownership with on-demand rides
Goods/Parcel Transportation Retail delivery contracts on predictable routes

Passenger Transportation dominates revenue because consumer ride demand in dense cities is large and immediate. Goods/Parcel Transportation grows fastest because cargo-only vehicles face lighter safety scrutiny and retail buyers commit to recurring routes.

By Service Type

Sub-Segment Key Trend
Rental-Based (Free-Floating) App-hailed rides integrated with major platforms
Station-Based Hub-to-hub service with minimal empty miles

Rental-Based (Free-Floating) service leads because it replicates the ride-hail experience and benefits from platform distribution deals. Station-Based service grows faster at airports, campuses and suburbs, where fixed pickup points remove repositioning costs.

By Business Model

Sub-Segment Key Trend
B2C Consumer bookings through operator and platform apps
B2B Multi-year corporate, retail and transit contracts

B2C holds a narrow lead because commercial launches so far have targeted individual riders. B2B grows faster as retailers and transit agencies sign guaranteed-capacity contracts that improve utilization and revenue visibility.

By Fleet Ownership

Sub-Segment Key Trend
Technology Provider-Owned Vertically integrated pioneers operate own fleets
OEM-Owned Automakers building recurring service revenue
Third-Party Fleet Operator Asset-light licensing of driving software

Technology Provider-Owned fleets lead because Waymo, Baidu and Pony.ai built and run their own vehicles. Third-Party Fleet Operator ownership grows fastest as developers license software to partners who finance, charge and maintain vehicles, freeing capital, while OEM-Owned fleets follow Tesla's direct-network approach.

By Operating Environment

Sub-Segment Key Trend
Urban High trip density in mapped city cores
Suburban Low-complexity roads with weak transit coverage
Highway/Inter-City Freeway and airport corridor routes

Urban leads because trip density drives the utilization that fleet economics depend on. Suburban grows fastest as simpler road layouts and underserved transit create demand that pairs well with station-based service, while Highway/Inter-City expands after freeway approvals.


Download PDF ×

We do not share your information with anyone. However, we may send you emails based on your report interest from time to time. You may contact us at any time to opt-out.