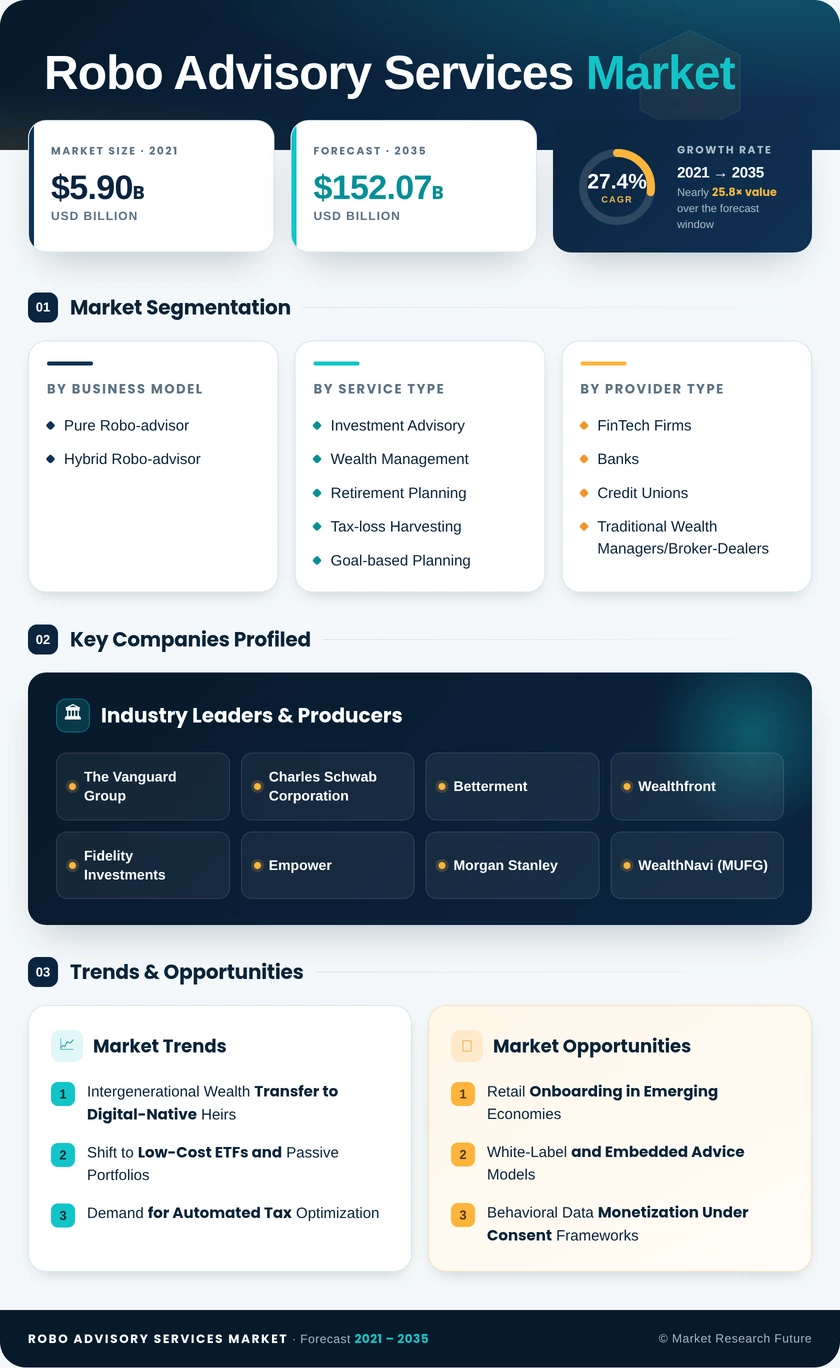
Robo Advisory Services Market (2026 - 2035)

ID: MRFR/BS/23070-HCR 200 Pages Nirmit Biswas Last Updated: October 21, 2026

Robo Advisory Services Market Size, Share and Research Report By Business Model (Pure Robo-advisor, and Hybrid Robo-advisor), By Service Type (Investment Advisory, Wealth Management, Retirement Planning, Tax-loss Harvesting, and Goal-based Planning), By Provider Type (FinTech Firms, Banks and Credit Unions, and Traditional Wealth Managers/Broker-Dealers), By End-user (Retail Investors, High-Net-Worth Individuals (HNWI), and SMEs and Corporate Treasuries) – Industry Forecast Till 2035

Robo Advisory Services Market
Market Size
Forecast Period2026-2035
CAGR (2026-2035)27.4%
2025 Market SizeUSD 13.30 Billion
2035 Market SizeUSD 152.07 Billion
Key Players
The Vanguard Group
Charles Schwab Corporation
Betterment
Wealthfront
Fidelity Investments
Empower
Opportunities
  • Retail Onboarding in Emerging Economies
  • White-Label and Embedded Advice Models
  • Behavioral Data Monetization Under Consent Frameworks
  1. 1 Market Summary | |
  2. 2 Key Report Takeaways | |
    1. 2.1 By Business Model | |
    2. 2.2 By Service Type | |
    3. 2.3 By Provider Type | |
    4. 2.4 By End-user | |
    5. 2.5 By Region | |
  3. 3 Market Size and Forecast (2021–2035) | |
  4. 4 Driver Impact Analysis | |
    1. 4.1 Intergenerational Wealth Transfer to Digital-Native Heirs | |
    2. 4.2 Shift to Low-Cost ETFs and Passive Portfolios | |
    3. 4.3 Demand for Automated Tax Optimization | |
    4. 4.4 Retirement Rollover Capture and Workplace Integration | |
    5. 4.5 Generative AI-Led Personalization | |
    6. 4.6 Retail Investment Reforms in Asia-Pacific | |
    7. 4.7 Incumbent Digital Transformation Through M&A | |
  5. 5 Restraints Impact Analysis | |
    1. 5.1 Fee Compression and Thin Unit Economics | |
    2. 5.2 Investor Trust Gaps During Volatility | |
    3. 5.3 Algorithmic Accountability and Conduct Regulation | |
    4. 5.4 Data Privacy and Cybersecurity Exposure | |
    5. 5.5 High Customer Acquisition Costs and Forced Consolidation | |
  6. 6 Opportunities | |
    1. 6.1 Retail Onboarding in Emerging Economies | |
    2. 6.2 White-Label and Embedded Advice Models | |
    3. 6.3 Behavioral Data Monetization Under Consent Frameworks | |
    4. 6.4 Treasury Automation for Small and Mid-Sized Firms | |
    5. 6.5 Shariah-Compliant Portfolios in the Gulf and Southeast Asia | |
  7. 7 Regional Market Share and Country-Level Analysis | |
    1. 7.1 North America | | |
      1. 7.1.1 United States | | |
      2. 7.1.2 Canada | | |
      3. 7.1.3 Mexico | |
    2. 7.2 Europe | | |
      1. 7.2.1 Germany | | |
      2. 7.2.2 United Kingdom | | |
      3. 7.2.3 France | | |
      4. 7.2.4 Italy | | |
      5. 7.2.5 Spain | | |
      6. 7.2.6 Russia | | |
      7. 7.2.7 Rest of Europe | |
    3. 7.3 Asia-Pacific | | |
      1. 7.3.1 China | | |
      2. 7.3.2 India | | |
      3. 7.3.3 Japan | | |
      4. 7.3.4 South Korea | | |
      5. 7.3.5 Singapore | | |
      6. 7.3.6 Malaysia | | |
      7. 7.3.7 Australia | | |
      8. 7.3.8 Rest of Asia-Pacific | |
    4. 7.4 South America | | |
      1. 7.4.1 Brazil | | |
      2. 7.4.2 Argentina | | |
      3. 7.4.3 Chile | | |
      4. 7.4.4 Rest of South America | |
    5. 7.5 Middle East and Africa | | |
      1. 7.5.1 Middle East | | |
      2. 7.5.2 Saudi Arabia | | |
      3. 7.5.3 Turkey | | |
      4. 7.5.4 Israel | | |
      5. 7.5.5 Rest of Middle East | | |
      6. 7.5.6 Africa | | |
      7. 7.5.7 South Africa | | |
      8. 7.5.8 Nigeria | | |
      9. 7.5.9 Rest of Africa | |
  8. 8 Future Outlook (2026–2035) | |
    1. 8.1 AI-Native Advice Replaces Static Questionnaires | |
    2. 8.2 Platform Consolidation and Embedded Wealth | |
    3. 8.3 Wealth Transfer Reshapes the Client Base | |
    4. 8.4 Regulatory Convergence and Hyper-Personalization | |
  9. 9 Segmentation Analysis | |
    1. 9.1 By Business Model | | |
      1. 9.1.1 Pure Robo-advisor | | |
      2. 9.1.2 Hybrid Robo-advisor | |
    2. 9.2 By Service Type | | |
      1. 9.2.1 Investment Advisory | | |
      2. 9.2.2 Wealth Management | | |
      3. 9.2.3 Retirement Planning | | |
      4. 9.2.4 Tax-loss Harvesting | | |
      5. 9.2.5 Goal-based Planning | |
    3. 9.3 By Provider Type | | |
      1. 9.3.1 FinTech Firms | | |
      2. 9.3.2 Banks and Credit Unions | | |
      3. 9.3.3 Traditional Wealth Managers/Broker-Dealers | |
    4. 9.4 By End-user | | |
      1. 9.4.1 Retail Investors | | |
      2. 9.4.2 High-Net-Worth Individuals (HNWI) | | |
      3. 9.4.3 SMEs and Corporate Treasuries | |
  10. 10 Competitive Landscape | |
  11. 11 Recent News & Developments | |
  12. 12 Report Scope and Methodology | |
  13. 13 Detailed Sources and Citations | |
  14. 14 Frequently Asked Questions (FAQs) | | LIST OF TABLES | |
  15. TABLE 1 Global Market Summary Snapshot, 2025–2035 | |
  16. TABLE 2 Global Market Size & Forecast, by Revenue (USD Billion), 2021–2035 | |
  17. TABLE 3 Driver Impact Analysis, 2026–2035 | |
  18. TABLE 4 Restraints Impact Analysis, 2026–2035 | |
  19. TABLE 5 Regional Summary, by Region, 2025 | |
  20. TABLE 6 North America Market, by Country, 2025 | |
  21. TABLE 7 Europe Market, by Country, 2025 | |
  22. TABLE 8 Asia-Pacific Market, by Country, 2025 | |
  23. TABLE 9 South America Market, by Country, 2025 | |
  24. TABLE 10 Middle East and Africa Market, by Country, 2025 | |
  25. TABLE 11 Global Market, by Business Model, 2025 | |
  26. TABLE 12 Global Market, by Service Type, 2025 | |
  27. TABLE 13 Global Market, by Provider Type, 2025 | |
  28. TABLE 14 Global Market, by End-user, 2025 | |
  29. TABLE 15 Competitive Benchmarking Matrix, 2025 | |
  30. TABLE 16 Report Scope and Methodology | |
  31. TABLE 17 Detailed Sources and Citations | | LIST OF FIGURES | |
  32. FIGURE 1 Market Dynamics Overview (Drivers, Restraints, Opportunities) | |
  33. FIGURE 2 Industry Value Chain Analysis | |
  34. FIGURE 3 Porter's Five Forces Analysis | |
  35. FIGURE 4 Global Market Size Trend, 2021–2035 (USD Billion) | |
  36. FIGURE 5 Market Share by Business Model, 2025 | |
  37. FIGURE 6 Market Share by Service Type, 2025 | |
  38. FIGURE 7 Market Share by Provider Type, 2025 | |
  39. FIGURE 8 Market Share by End-user, 2025 | |
  40. FIGURE 9 Regional Market Share, 2025 | |
  41. FIGURE 10 Regional Growth Comparison, 2026–2035 | |
  42. FIGURE 11 Competitive Landscape Positioning Map, 2025

Segmentation Quick Reference

DimensionSub-SegmentsDominant SegmentFastest Growing Segment
By Business ModelPure Robo-advisor; Hybrid Robo-advisorHybrid Robo-advisor (56.0% share)Pure Robo-advisor (31.9% CAGR)
By Service TypeInvestment Advisory; Wealth Management; Retirement Planning; Tax-loss Harvesting; Goal-based PlanningWealth Management (35.6% share)Tax-loss Harvesting (30.9% CAGR)
By Provider TypeFinTech Firms; Banks and Credit Unions; Traditional Wealth Managers/Broker-DealersFinTech Firms (48.2% share)Banks and Credit Unions (32.1% CAGR)
By End-userRetail Investors; High-Net-Worth Individuals (HNWI); SMEs and Corporate TreasuriesHigh-Net-Worth Individuals (HNWI) (50.9% share)Retail Investors (30.8% CAGR)
By RegionNorth America; Europe; Asia-Pacific; South America; Middle East and AfricaNorth America (44.5% share)Asia-Pacific (31.8% CAGR (2026–2035))

Market Segmentation Overview

By Business Model

Sub-SegmentKey Trend
Pure Robo-advisorAI chat interfaces and zero minimums attract younger investors
Hybrid Robo-advisorTiered access to human planners for complex needs

Hybrid Robo-advisor services lead with a 56.0% share because clients want a human backstop when markets fall and when estate or tax questions arise. Pure Robo-advisor offerings grow faster at a 31.9% CAGR, as conversational AI handles routine questions that once required a planner. The gap between the two will narrow as automated explanations improve.

By Service Type

Sub-SegmentKey Trend
Investment AdvisoryEntry-level model portfolios at low fees
Wealth ManagementFull-balance-sheet oversight for affluent clients
Retirement PlanningAutomated rollover and decumulation tools
Tax-loss HarvestingDaily harvesting combined with personalized indexing
Goal-based PlanningMilestone tracking for first-time savers

Wealth Management holds the largest share at 35.6% because comprehensive oversight supports recurring, asset-based fees. Tax-loss Harvesting grows fastest at a 30.9% CAGR as direct indexing becomes affordable for mid-sized accounts. Retirement Planning and Goal-based Planning benefit from rollover capture and young-saver demand respectively.

By Provider Type

Sub-SegmentKey Trend
FinTech FirmsProduct speed and B2B licensing of advice engines
Banks and Credit UnionsAcquisitions and white-label partnerships
Traditional Wealth Managers/Broker-DealersAutomation to serve smaller accounts and heirs

FinTech Firms lead with a 48.2% share, built on early consumer brands and faster product cycles. Banks and Credit Unions expand fastest at a 32.1% CAGR, using deals such as MUFG's WealthNavi purchase to convert deposit relationships into advisory assets. Traditional Wealth Managers/Broker-Dealers use automation defensively to keep next-generation clients.

By End-user

Sub-SegmentKey Trend
Retail InvestorsFractional shares and micro-investing
High-Net-Worth Individuals (HNWI)Hybrid planning with tax optimization
SMEs and Corporate TreasuriesAutomated deployment of idle operating cash

High-Net-Worth Individuals (HNWI) contribute the largest share at 50.9%, since larger balances generate more asset-based revenue and justify hybrid service tiers. Retail Investors grow fastest at a 30.8% CAGR as low minimums and fractional ETFs make small accounts profitable. SMEs and Corporate Treasuries remain a smaller but distinct opportunity tied to accounting-software integrations.


Download PDF ×

We do not share your information with anyone. However, we may send you emails based on your report interest from time to time. You may contact us at any time to opt-out.