Rice Bran Oil Market (2026 - 2035)

ID: MRFR/FnB/5986-HCR 128 Pages Snehal Singh Last Updated: October 22, 2026
Rice Bran Oil Market Size, Share, Industry Trend & Analysis Research Report Information By Nature (Organic, Conventional), By Type (Refined, Non-Refined), By End Use (Food Processing, Foodservice/HORECA, Retail), By Region (North America, Europe, Asia-Pacific, South America, Middle East and Africa) – Forecast Till 2035
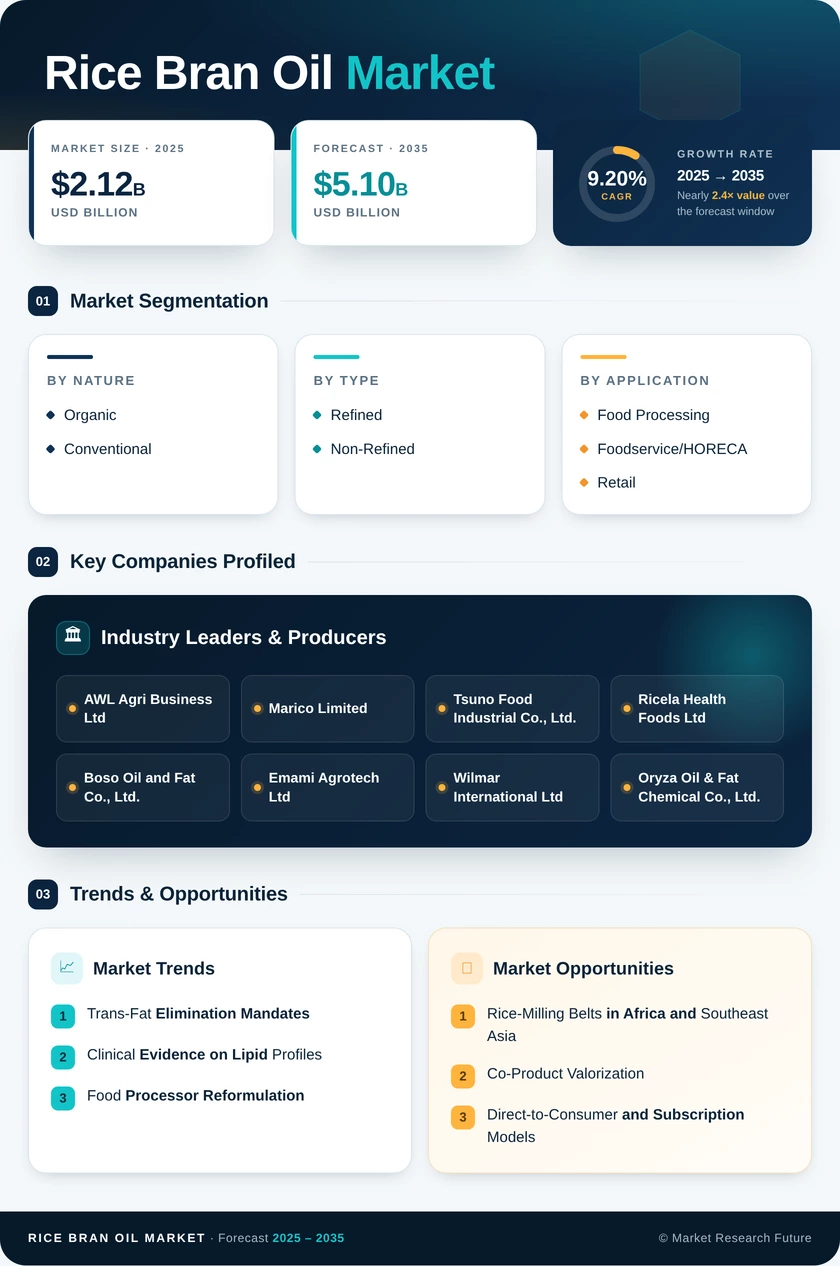
Rice Bran Oil Market
Market Size
Forecast Period2026-2035
CAGR (2026-2035)9.20%
2025 Market SizeUSD 2.12 Billion
2035 Market SizeUSD 5.10 Billion
Key Players
AWL Agri Business Ltd
Marico Limited
Tsuno Food Industrial Co., Ltd.
Ricela Health Foods Ltd
Boso Oil and Fat Co., Ltd.
Emami Agrotech Ltd
Opportunities
  • Rice-Milling Belts in Africa and Southeast Asia
  • Co-Product Valorization
  • Direct-to-Consumer and Subscription Models
  1. 1 Market Summary | |
  2. 2 Key Report Takeaways | |
    1. 2.1 By Nature | |
    2. 2.2 By Type | |
    3. 2.3 By End Use | |
    4. 2.4 By Region | |
  3. 3 Market Size and Forecast (2021–2035) | |
    1. 3.1 Historical Market Size (2021–2025) | |
    2. 3.2 Forecast Market Size (2026–2035) | |
    3. 3.3 Year-over-Year Growth Analysis | |
  4. 4 Driver Impact Analysis | |
    1. 4.1 Trans-Fat Elimination Mandates | |
    2. 4.2 Clinical Evidence on Lipid Profiles | |
    3. 4.3 Food Processor Reformulation | |
    4. 4.4 Bran Supply Mobilization in India | |
    5. 4.5 Import-Substitution Policy | |
    6. 4.6 High-Heat Foodservice Frying Demand | |
  5. 5 Restraints Impact Analysis | |
    1. 5.1 Bran Perishability and Fragmented Collection | |
    2. 5.2 Price Competition from Palm and Soybean Oils | |
    3. 5.3 Refining Losses from High Free Fatty Acids | |
    4. 5.4 Blending and Authenticity Concerns | |
    5. 5.5 Limited Consumer Awareness in Western Markets | |
  6. 6 Opportunities | |
    1. 6.1 Rice-Milling Belts in Africa and Southeast Asia | |
    2. 6.2 Co-Product Valorization | |
    3. 6.3 Direct-to-Consumer and Subscription Models | |
    4. 6.4 FDA-Driven Reformulation in North America | |
    5. 6.5 Organic Supply Build-Out in Europe | |
  7. 7 Regional Market Share and Country-Level Analysis | |
    1. 7.1 North America | | |
      1. 7.1.1 United States | | |
      2. 7.1.2 Canada | | |
      3. 7.1.3 Mexico | | |
      4. 7.1.4 Rest of North America | |
    2. 7.2 Europe | | |
      1. 7.2.1 Germany | | |
      2. 7.2.2 United Kingdom | | |
      3. 7.2.3 France | | |
      4. 7.2.4 Spain | | |
      5. 7.2.5 Netherlands | | |
      6. 7.2.6 Italy | | |
      7. 7.2.7 Sweden | | |
      8. 7.2.8 Poland | | |
      9. 7.2.9 Belgium | | |
      10. 7.2.10 Rest of Europe | |
    3. 7.3 Asia-Pacific | | |
      1. 7.3.1 China | | |
      2. 7.3.2 India | | |
      3. 7.3.3 Japan | | |
      4. 7.3.4 Australia | | |
      5. 7.3.5 Rest of Asia-Pacific | |
    4. 7.4 South America | | |
      1. 7.4.1 Brazil | | |
      2. 7.4.2 Argentina | | |
      3. 7.4.3 Rest of South America | |
    5. 7.5 Middle East and Africa | | |
      1. 7.5.1 United Arab Emirates | | |
      2. 7.5.2 South Africa | | |
      3. 7.5.3 Saudi Arabia | | |
      4. 7.5.4 Rest of Middle East and Africa | |
  8. 8 Future Outlook (2026–2035) | |
    1. 8.1 Mill-Integrated Stabilization and Process Automation | |
    2. 8.2 Premiumization and Bioactive Retention | |
    3. 8.3 Circular Rice Economy and Sustainability Reporting | |
    4. 8.4 Trade Policy and Self-Sufficiency | |
  9. 9 Segmentation Analysis | |
    1. 9.1 By Nature | | |
      1. 9.1.1 Organic | | |
      2. 9.1.2 Conventional | |
    2. 9.2 By Type | | |
      1. 9.2.1 Refined | | |
      2. 9.2.2 Non-Refined | |
    3. 9.3 By End Use | | |
      1. 9.3.1 Food Processing | | |
      2. 9.3.2 Foodservice/HORECA | | |
      3. 9.3.3 Retail | |
  10. 10 Competitive Landscape | |
    1. 10.1 Market Concentration Analysis | |
    2. 10.2 Competitive Benchmarking Matrix | |
    3. 10.3 Company Profiles | | |
      1. 10.3.1 AWL Agri Business Ltd | | |
      2. 10.3.2 Marico Limited | | |
      3. 10.3.3 Tsuno Food Industrial Co., Ltd. | | |
      4. 10.3.4 Ricela Health Foods Ltd | | |
      5. 10.3.5 Boso Oil and Fat Co., Ltd. | | |
      6. 10.3.6 Emami Agrotech Ltd | | |
      7. 10.3.7 Wilmar International Ltd | | |
      8. 10.3.8 Oryza Oil & Fat Chemical Co., Ltd. | | |
      9. 10.3.9 Sethia Oils Ltd | | |
      10. 10.3.10 Kasisuri Co., Ltd. | |
  11. 11 Recent News & Developments | |
  12. 12 Report Scope and Methodology | |
  13. 13 Detailed Sources and Citations | |
  14. 14 Frequently Asked Questions (FAQs) | | LIST OF TABLES | |
  15. TABLE 1 Global Market Snapshot, 2025–2035 | |
  16. TABLE 2 Global Market Size & Forecast, by Revenue (USD Billion), 2021–2035 | |
  17. TABLE 3 Driver Impact Analysis, 2026–2035 | |
  18. TABLE 4 Restraints Impact Analysis, 2026–2035 | |
  19. TABLE 5 Regional Summary, 2025 (USD Billion) | |
  20. TABLE 6 North America Market, by Country, 2025 | |
  21. TABLE 7 Europe Market, by Country, 2025 | |
  22. TABLE 8 Asia-Pacific Market, by Country, 2025 | |
  23. TABLE 9 South America Market, by Country, 2025 | |
  24. TABLE 10 Middle East and Africa Market, by Country, 2025 | |
  25. TABLE 11 Global Market, by Nature, 2025–2035 | |
  26. TABLE 12 Global Market, by Type, 2025–2035 | |
  27. TABLE 13 Global Market, by End Use, 2025–2035 | |
  28. TABLE 14 Competitive Benchmarking Matrix, 2025 | |
  29. TABLE 15 Report Scope and Methodology | |
  30. TABLE 16 Detailed Sources and Citations | | LIST OF FIGURES | |
  31. FIGURE 1 Market Dynamics Overview – Drivers, Restraints, Opportunities | |
  32. FIGURE 2 Industry Value Chain – Paddy to Packaged Oil | |
  33. FIGURE 3 Porter's Five Forces Analysis | |
  34. FIGURE 4 Global Market Size Trend, 2021–2035 (USD Billion) | |
  35. FIGURE 5 Market Share by Nature, 2025 | |
  36. FIGURE 6 Market Share by Type, 2025 | |
  37. FIGURE 7 Market Share by End Use, 2025 | |
  38. FIGURE 8 Regional Market Share, 2025 | |
  39. FIGURE 9 Asia-Pacific Country Share, 2025 | |
  40. FIGURE 10 Competitive Landscape – Estimated Revenue Share Ranges, 2025

Segmentation Quick Reference

DimensionSub-SegmentsDominant SegmentFastest Growing Segment
By NatureOrganic, ConventionalConventional (77.4% share)Organic (10.2% CAGR)
By TypeRefined, Non-RefinedRefined (79.6% share)Non-Refined (9.7% CAGR)
By End UseFood Processing, Foodservice/HORECA, RetailFood Processing (60.9% share)Retail (10.3% CAGR)
By RegionNorth America, Europe, Asia-Pacific, South America, Middle East and AfricaAsia-Pacific (68.4% share)Asia-Pacific (68.4% share)

Market Segmentation Overview

By Nature

Sub-SegmentKey Trend
OrganicCertified rice acreage expansion in Japan, the US, and Europe lowers premiums
ConventionalPrice per litre and fry life drive foodservice and industrial purchasing

Conventional oil leads because high-volume buyers in snacks and HORECA procure strictly on cost and frying performance. Organic grows fastest as subsidy-backed organic rice cultivation in Japan and expanding US organic acreage ease raw-material premiums. Natural-food chains and direct-to-consumer brands reward traceable, certified provenance, sustaining double-digit organic momentum.

By Type

Sub-SegmentKey Trend
RefinedNeutral flavor and 12–18 month shelf life suit processors
Non-RefinedHigher oryzanol and tocotrienol retention attracts wellness buyers

Refined oil dominates because full refining delivers the pale color, neutral taste, and long shelf life that crackers, dressings, and fried snacks demand. Non-Refined oil grows faster on the strength of its bioactive content, though its 6–9 month shelf life and nutty flavor keep it in specialty retail. Expeller-pressed grades are emerging as a middle tier between the two.

By End Use

Sub-SegmentKey Trend
Food ProcessingTrans-fat rules and the FDA "healthy" rule drive reformulation
Foodservice/HORECAHigh smoke point extends fry life in quick-service kitchens
RetailOnline subscriptions and home cooking lift premium purchases

Food Processing leads because the oil's 232°C smoke point and natural phospholipids support deep frying and stable emulsions without synthetic additives. Retail grows fastest as households trade up to premium oils and subscription programmes lock in repeat orders. Foodservice/HORECA remains a large, steady outlet in Asia-Pacific, where operators value fry life over sticker price.


Download PDF ×

We do not share your information with anyone. However, we may send you emails based on your report interest from time to time. You may contact us at any time to opt-out.