SEGMENTATION QUICK REFERENCE
| Dimension | Sub-Segments | Dominant Segment (2025) | Fastest Growing Segment (2026–2035) |
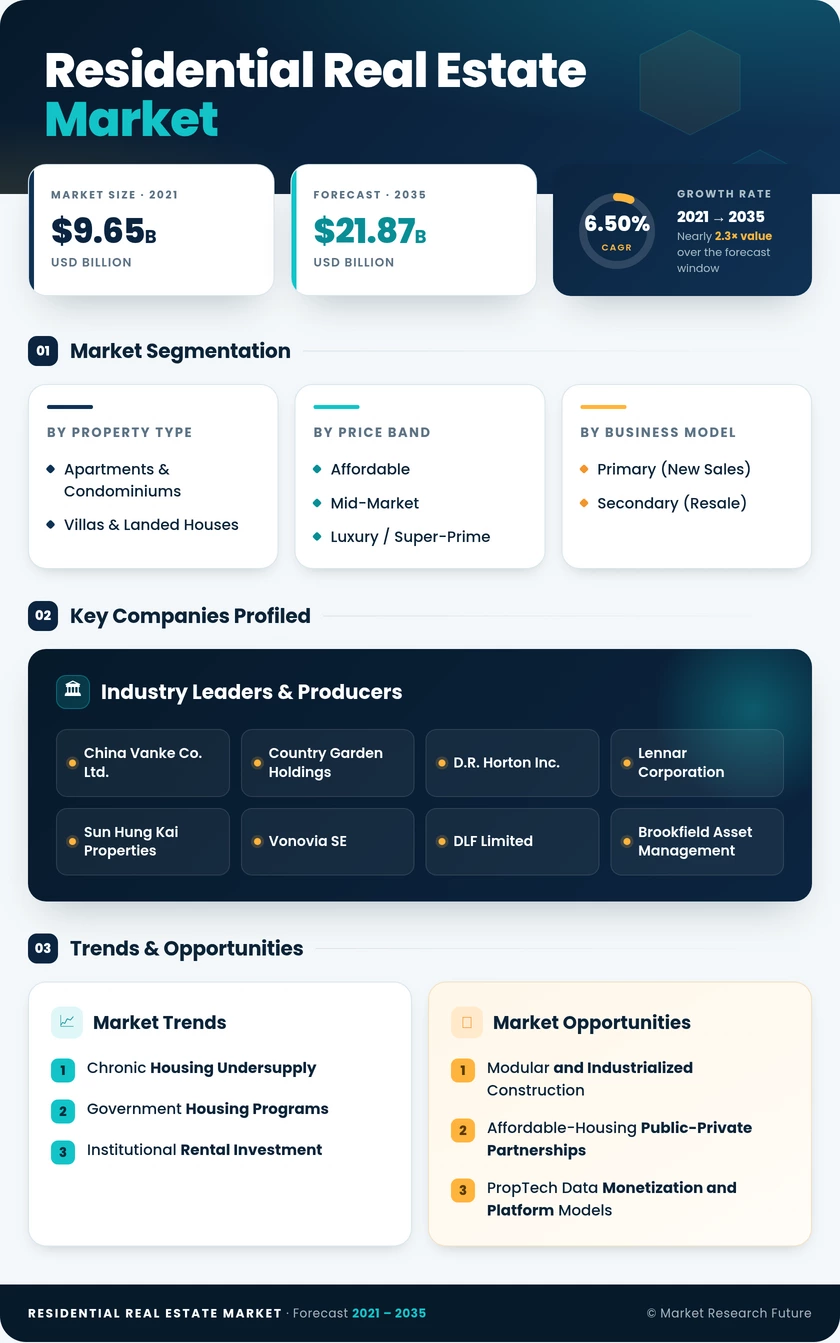
| Property Type | Apartments & Condominiums; Villas & Landed Houses | Apartments & Condominiums (55.0% share) | Villas & Landed Houses (6.72% CAGR) |
| Price Band | Affordable; Mid-Market; Luxury / Super-Prime | Mid-Market (44.0% share) | Luxury / Super-Prime (6.75% CAGR) |
| Business Model | Primary (New Sales); Secondary (Resale) | Secondary (57.0% share) | Primary (7.12% CAGR) |
| Mode of Sale | Outright Sales; Rentals | Outright Sales (58.0% share) | Rentals (7.25% CAGR) |
| Region | North America; Europe; Asia-Pacific; South America; Middle East & Africa | Asia-Pacific (32.0% share) | Asia-Pacific (7.45% CAGR) |
MARKET SEGMENTATION OVERVIEW
By Property Type
| Sub-Segment | Key Trend |
| Apartments & Condominiums | Urban densification, transit-oriented development, micro-unit formats in gateway cities |
| Villas & Landed Houses | Suburban expansion, remote-work-driven demand, peri-urban master-planned communities |
Apartments and condominiums remain the dominant property type globally, driven by land scarcity and vertical-development policies in high-density Asian and European cities. Villas and landed houses are gaining momentum as hybrid-work models sustain suburban and exurban demand, particularly across the US Sun Belt, India's tier-2 corridors, and Gulf-state gated communities.
By Price Band
| Sub-Segment | Key Trend |
| Affordable | Government subsidy-driven pipelines, PMAY and Minha Casa Minha Vida programs |
| Mid-Market | Mortgage-guarantee programs, dual-income household demand |
| Luxury / Super-Prime | Branded residences, cross-border wealth migration, golden-visa frameworks |
Mid-market housing commands the largest share of volumes, sustained by government mortgage-support mechanisms that underwrite buyer access. The luxury segment is growing fastest as high-net-worth individuals diversify into branded-residence formats that offer hospitality-grade services and stronger capital-preservation profiles.
By Business Model
| Sub-Segment | Key Trend |
| Primary (New Sales) | Large-scale greenfield projects, master-planned deliveries in emerging markets |
| Secondary (Resale) | Established housing-stock turnover, PropTech-enabled resale platforms |
Secondary-market transactions dominate global activity, reflecting the sheer volume of existing housing stock in mature economies. Primary sales are accelerating as developers in India, Saudi Arabia, and Southeast Asia bring large master-planned communities to market with institutional-grade pre-sales structures.
By Mode of Sale
| Sub-Segment | Key Trend |
| Outright Sales | Homeownership aspiration, wealth-building motive, government incentive alignment |
| Rentals | Build-to-rent scaling, affordability-driven tenure shifts, lifestyle flexibility |
Outright sales continue to lead, anchored by deep cultural and fiscal incentives for homeownership in most economies. Rentals are the fastest-growing mode as institutional capital professionalizes rental operations and affordability constraints extend tenure durations, particularly in the US, UK, and German gateway cities.