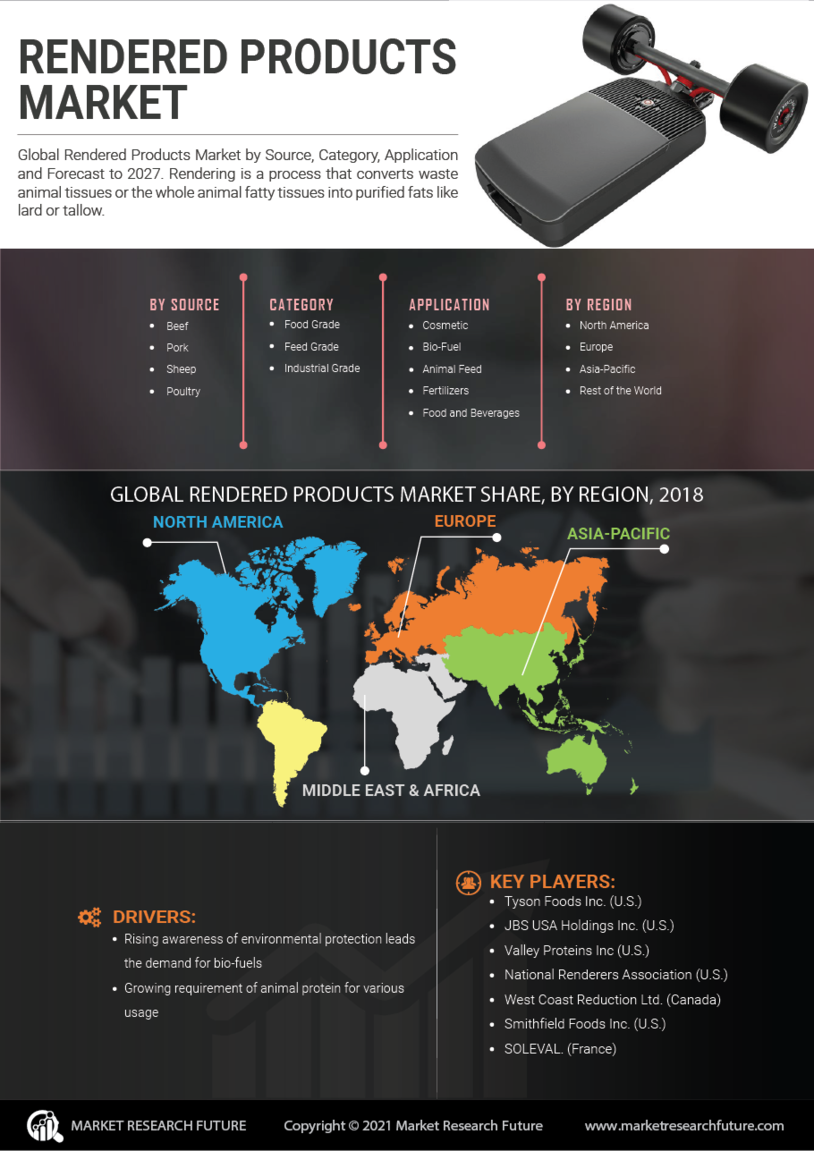
Certified Global Research Member
Isomar fd.webp Wcrc 57.webp
Key Questions Answered
  • Global Market Outlook
  • In-depth analysis of global and regional trends
  • Analyze and identify the major players in the market, their market share, key developments, etc.
  • To understand the capability of the major players based on products offered, financials, and strategies.
  • Identify disrupting products, companies, and trends.
  • To identify opportunities in the market.
  • Analyze the key challenges in the market.
  • Analyze the regional penetration of players, products, and services in the market.
  • Comparison of major playersโ€™ financial performance.
  • Evaluate strategies adopted by major players.
  • Recommendations
Why Choose Market Research Future?
  • Vigorous research methodologies for specific market.
  • Knowledge partners across the globe
  • Large network of partner consultants.
  • Ever-increasing/ Escalating data base with quarterly monitoring of various markets
  • Trusted by fortune 500 companies/startups/ universities/organizations
  • Large database of 5000+ markets reports.
  • Effective and prompt pre- and post-sales support.

Rendered Products Market Research Report Information By Source (Beef, Pork, Sheep, Poultry), By Category (Food Grade, Feed Grade, Industrial Grade), By Application (Cosmetic, Bio-Fuel, Animal Feed, Fertilizers, Food & Beverages), and By Region (North America, Europe, Asia-Pacific, And Rest Of The World) โ€“ Market Forecast Till 2030


ID: MRFR/F-B & N/3174-HCR | 110 Pages | Author: Sakshi Gupta| April 2024
Leading companies partner with us for data-driven Insights
client_1 client_2 client_3 client_4 client_5 client_6 client_7 client_8 client_9 client_10
Please fill in Business Email for Quick Response

Table of Content

Chapter 1. Methodology and Scope

1.1. Research Methodology

1.1.1 Initial Data Exploration

1.1.2 Statistical Modelling and Forecast

1.1.3 Industry Insights and Validation

1.2. Data Sources

Chapter 2. Executive Summary

2.1. Rendered products Industry Market Synopsis, 2023โ€“2030

2.1.1 Business Trends

2.1.2 Product Source Trends

2.1.3 Product Category Trends

2.1.4 Product Application Trends

Chapter 3 Rendered products Industry Insights

3.1 Industry Segmentation

3.2 Industry Size and Forecast

3.3 Industry Ecosystem Analysis

3.4 Industry Impact forces

3.4.1 Growth Drivers

3.4.1.1 Solution to Major Disposable Problem

3.4.1.2 Application in Wide Range of Industries

3.4.2 Industry Pitfalls & Challenges

3.4.2.1 Raw Material in Rendering Process Susceptible to Spoilage

3.4.2.2 Increasing Popularity of Vegan Diet

3.5 Growth Potential Analysis

3.6 Company Market Share Analysis, 2020

3.7 Porterโ€™s Analysis

3.8 PESTEL Analysis

Chapter 4 Rendered products by Sources Insights

4.1 Global Rendered products Market Volume Share by Sources, 2023โ€“2030

4.1.1 Beef

4.1.1.1 Market Estimates & Forecast, 2023โ€“2030

4.1.2 Pork

4.1.2.1 Market Estimates & Forecast, 2023โ€“2030

4.1.3 Sheep

4.1.3.1 Market Estimates & Forecast, 2023โ€“2030

4.1.4 Poultry

4.1.4.1 Market Estimates & Forecast, 2023โ€“2030

4.1.5 Others

4.1.5.1 Market Estimates & Forecast, 2023โ€“2030

Chapter 5 Rendered products by Category Insights

5.1 Global Rendered Products Market Volume Share by Category, 2023โ€“2030

5.1.1 Food Grade

5.1.1.1 Market Estimates & Forecast, 2023โ€“2030

5.1.2 Feed Grade

5.1.2.1 Market Estimates & Forecast, 2023โ€“2030

5.1.3 Industrial Grade

5.1.3.1 Market Estimates & Forecast, 2023โ€“2030

Chapter 6 Rendered products by application Insights

6.1 Global Rendered products Market Volume Share by Application, 2023โ€“2030

6.1.1 Cosmetics

6.1.1.1 Market Estimates & Forecast, 2023โ€“2030

6.1.1.2 Market Estimates & Forecast by Region, 2023โ€“2030

6.1.2 Bio-fuel

6.1.2.1 Market Estimates & Forecast, 2023โ€“2030

6.1.2.2 Market Estimates & Forecast by Region, 2023โ€“2030

6.1.3 Animal feed

6.1.3.1 Market Estimates & Forecast, 2023โ€“2030

6.1.3.2 Market Estimates & Forecast by Region, 2023โ€“2030

6.1.4 Fertilizers

6.1.4.1 Market Estimates & Forecast, 2023โ€“2030

6.1.4.2 Market Estimates & Forecast by Region, 2023โ€“2030

6.1.5 Food and Beverages

6.1.5.1 Market Estimates & Forecast, 2023โ€“2030

6.1.5.2 Market Estimates & Forecast by Region, 2023โ€“2030

6.1.6 Others

6.1.6.1 Market Estimates & Forecast, 2023โ€“2030

6.1.6.2 Market Estimates & Forecast by Region, 2023โ€“2030

Chapter 7 Rendered products Regional Insights

7.1 Rendered products Market Volume Share by Region, 2023โ€“2030.

7.2 North America

7.2. A Market Estimates & Forecast, 2023โ€“2030

7.2. B Market Estimates & Forecast, by Source, 2023โ€“2030

7.2. C Market Estimates & Forecast, by Category, 2023โ€“2030

7.2. D Market Estimates & Forecast, by Application, 2023โ€“2030

7.2.1 U.S.

7.2.1.1 Market Estimates & Forecast, 2023โ€“2030

7.2.1.2 Market Estimates & Forecast, by Source, 2023โ€“2030

7.2.1.3 Market Estimates & Forecast, by Category, 2023โ€“2030

7.2.1.4 Market Estimates & Forecast, by Application, 2023โ€“2030

7.2.2 Canada

7.2.2.1 Market Estimates & Forecast, 2023โ€“2030

7.2.2.2 Market Estimates & Forecast, by Source, 2023โ€“2030

7.2.2.3 Market Estimates & Forecast, by Category, 2023โ€“2030

7.2.2.4 Market Estimates & Forecast, by Application, 2023โ€“2030

7.2.3 Mexico

7.2.3.1 Market Estimates & Forecast, 2023โ€“2030

7.2.3.2 Market Estimates & Forecast, by Source, 2023โ€“2030

7.2.3.3 Market Estimates & Forecast, by Category, 2023โ€“2030

7.2.3.4 Market Estimates & Forecast, by Application, 2023โ€“2030

7.3 Europe

7.3. A Market Estimates & Forecast, 2023โ€“2030

7.3. B Market Estimates & Forecast, by Source, 2023โ€“2030

7.3. C Market Estimates & Forecast, by Category, 2023โ€“2030

7.3. D Market Estimates & Forecast, by Application, 2023โ€“2030

7.3.1 Germany

7.3.1.1 Market Estimates & Forecast, 2023โ€“2030

7.3.1.2 Market Estimates & Forecast, by Source, 2023โ€“2030

7.3.1.3 Market Estimates & Forecast, by Category, 2023โ€“2030

7.3.1.4 Market Estimates & Forecast, by Application, 2023โ€“2030

7.3.2 UK

7.3.2.1 Market Estimates & Forecast, 2023โ€“2030

7.3.2.2 Market Estimates & Forecast, by Source, 2023โ€“2030

7.3.2.3 Market Estimates & Forecast, by Category, 2023โ€“2030

7.3.2.4 Market Estimates & Forecast, by Application, 2023โ€“2030

7.3.3 France

7.3.3.1 Market Estimates & Forecast, 2023โ€“2030

7.3.3.2 Market Estimates & Forecast, by Source, 2023โ€“2030

7.3.3.3 Market Estimates & Forecast, by Category, 2023โ€“2030

7.3.3.4 Market Estimates & Forecast, by Application, 2023โ€“2030

7.3.4 Italy

7.3.4.1 Market Estimates & Forecast, 2023โ€“2030

7.3.4.2 Market Estimates & Forecast, by Source, 2023โ€“2030

7.3.4.3 Market Estimates & Forecast, by Category, 2023โ€“2030

7.3.4.4 Market Estimates & Forecast, by Application, 2023โ€“2030

7.4 Asia Pacific

7.4. A Market Estimates & Forecast, 2023โ€“2030

7.4. B Market Estimates & Forecast, by Source, 2023โ€“2030

7.4. C Market Estimates & Forecast, by Category, 2023โ€“2030

7.4. D Market Estimates & Forecast, by Application, 2023โ€“2030

7.4.1 China

7.4.1.1 Market Estimates & Forecast, 2023โ€“2030

7.4.1.2 Market Estimates & Forecast, by Source, 2023โ€“2030

7.4.1.3 Market Estimates & Forecast, by Category, 2023โ€“2030

7.4.1.4 Market Estimates & Forecast, by Application, 2023โ€“2030

7.4.2 India

7.4.2.1 Market Estimates & Forecast, 2023โ€“2030

7.4.2.2 Market Estimates & Forecast, by Source, 2023โ€“2030

7.4.2.3 Market Estimates & Forecast, by Category, 2023โ€“2030

7.4.2.4 Market Estimates & Forecast, by Application, 2023โ€“2030

7.4.3 Japan

7.4.3.1 Market Estimates & Forecast, 2023โ€“2030

7.4.3.2 Market Estimates & Forecast, by Source, 2023โ€“2030

7.4.3.3 Market Estimates & Forecast, by Category, 2023โ€“2030

7.4.3.4 Market Estimates & Forecast, by Application, 2023โ€“2030

7.5 RoW

7.5. A Market Estimates & Forecast, 2023โ€“2030

7.5. B Market Estimates & Forecast, by Source, 2023โ€“2030

7.5. C Market Estimates & Forecast, by Category, 2023โ€“2030

7.5. D Market Estimates & Forecast, by Application, 2023โ€“2030

Chapter 8 Competitor Profile

8.1 Tyson Foods Inc. (U.S.)

8.1.1 Business Overview

8.1.2 Financial Data

8.1.3 Product Landscape

8.1.4 Key Developments

8.1.5 Business Strategy

8.1.6 SWOT Analysis

8.2 JBS USA Holdings Inc. (U.S.)

8.2.1 Business Overview

8.2.2 Financial Data

8.2.3 Product Landscape

8.2.4 Key Developments

8.2.5 Business Strategy

8.2.6 SWOT Analysis

8.3 Valley Proteins Inc (U.S.)

8.3.1 Business Overview

8.3.2 Financial Data

8.3.3 Product Landscape

8.3.4 Key Developments

8.3.5 Business Strategy

8.3.6 SWOT Analysis

8.4 National Renderers Association. (U.S.)

8.4.1 Business Overview

8.4.2 Financial Data

8.4.3 Product Landscape

8.4.4 Key Developments

8.4.5 Business Strategy

8.4.6 SWOT Analysis

8.5 West Coast Reduction Ltd. (Canada)

8.5.1 Business Overview

8.5.2 Financial Data

8.5.3 Product Landscape

8.5.4 Key Developments

8.5.5 Business Strategy

8.5.6 SWOT Analysis

8.6 Smithfield Foods Inc. (U.S.)

8.6.1 Business Overview

8.6.2 Financial Data

8.6.3 Product Landscape

8.6.4 Key Developments

8.6.5 Business Strategy

8.6.6 SWOT Analysis

8.7 SOLEVAL. (France)

8.7.1 Business Overview

8.7.2 Financial Data

8.7.3 Product Landscape

8.7.4 Key Developments

8.7.5 Business Strategy

8.7.6 SWOT Analysis

Data Tables

TABLE 1 PESTLE ANALYSIS โ€“ U.S.

TABLE 2 PESTLE ANALYSIS- JAPAN

TABLE 3 PESTLE ANALYSIS- CHINA

TABLE 4 PESTLE ANALYSIS- FRANCE

TABLE 5 PESTLE ANALYSIS- GERMANY

TABLE 6 KEY SUPPLIERS OF RENDERED PRODUCTS

TABLE 7 GLOBAL MARKET FOR RENDERED PRODUCTS, BY SOURCE, (2023โ€“2030), USD MILLION

TABLE 8 GLOBAL MARKET FOR RENDERED PRODUCTS, BY CATEGORY, (2023โ€“2030), USD MILLION

TABLE 9 GLOBAL MARKET FOR RENDERED PRODUCTS, BY APPLICATION, (2023โ€“2030), USD MILLION

TABLE 10 GLOBAL RENDERED PRODUCTS SALES AND GROWTH RATE (2023โ€“2030) USD MILLION

TABLE 11 GLOBAL MARKET FOR RENDERED PRODUCTS TOP 5 COUNTRIES

TABLE 12 GLOBAL MARKET FOR RENDERED PRODUCTS TOP COMPANIES-USD MILLION

TABLE 13 NORTH AMERICAN GLOBAL MARKET FOR RENDERED PRODUCTS, BY SOURCE, (2023โ€“2030) USD MILLION

TABLE 14 NORTH AMERICAN MARKET FOR RENDERED PRODUCTS, BY CATEGORY, (2023โ€“2030), USD MILLION

TABLE 15 NORTH AMERICAN MARKET FOR RENDERED PRODUCTS, BY APPLICATION, (2023โ€“2030), USD MILLION

TABLE 16 EUROPEAN GLOBAL MARKET FOR RENDERED PRODUCTS, BY SOURCE, (2023โ€“2030) USD MILLION

TABLE 17 EUROPEAN MARKET FOR RENDERED PRODUCTS, BY CATEGORY, (2023โ€“2030), USD MILLION

TABLE 18 EUROPEAN MARKET FOR RENDERED PRODUCTS, BY APPLICATION, (2023โ€“2030), USD MILLION

TABLE 19 APAC GLOBAL MARKET FOR RENDERED PRODUCTS, BY SOURCE, (2023โ€“2030) USD MILLION

TABLE 20 APAC MARKET FOR RENDERED PRODUCTS, BY CATEGORY, (2023โ€“2030), USD MILLION

TABLE 21 APAC MARKET FOR RENDERED PRODUCTS, BY APPLICATION, (2023โ€“2030), USD MILLION

TABLE 22 REST OF THE WORLD MARKET FOR RENDERED PRODUCTS, BY SOURCE, (2023โ€“2030) USD MILLION

TABLE 23 REST OF THE WORLD MARKET FOR RENDERED PRODUCTS, BY CATEGORY, (2023โ€“2030), USD MILLION

TABLE 24 REST OF THE WORLD MARKET FOR RENDERED PRODUCTS, BY APPLICATION, (2023โ€“2030), USD MILLION

TABLE 25 COMPETITIVE LANDSCAPING BASED ON FINACIALS DURING THE YEAR 2020โ€ƒ

Charts & Figures

LIST OF FIGURES

FIGURE 1 RESEARCH METHODOLOGY

FIGURE 2 PRIMARY DATA ANALYSIS APPROACH

FIGURE 3 SECONDARY DATA ANALYSIS APPROACH

FIGURE 4 TRENDS IN RENDERED PRODUCTS IMPORTS 2020

FIGURE 5 GROWTH RATE IN RENDERED PRODUCTS IMPORTS 2020

FIGURE 6 RENDERED PRODUCTS IMPORTS MARKET SHARE BY TOP 5 IMPORTERS (2020 VS 2027)

FIGURE 7 TRENDS IN RENDERED PRODUCTS EXPORTS 2020

FIGURE 8 GROWTH RATE RENDERED PRODUCTS EXPORTS 2020

FIGURE 9 RENDERED PRODUCTS EXPORTS MARKET SHARE BY TOP 5 EXPORTERS (2020 VS 2027)

FIGURE 10 VALUE CHAIN ANALYSIS

FIGURE 11 COST ANALYSIS: RENDERED PRODUCTS

FIGURE 12 PORTERโ€™S FIVE FORCES ANALYSIS

FIGURE 13 GLOBAL MARKET FOR RENDERED PRODUCTS TRENDS BY SOURCE

FIGURE 14 GLOBAL MARKET FOR RENDERED PRODUCTS TRENDS BY CATEGORY

FIGURE 15 GLOBAL MARKET FOR RENDERED PRODUCTS TRENDS BY APPLICATION

FIGURE 16 FINANCIALS

Purchase Option
Single User $ 4,950
Multiuser License $ 5,950
Enterprise User $ 7,250
Compare Licenses
Tailored for You
  • Dedicated Research on any specifics segment or region.
  • Focused Research on specific players in the market.
  • Custom Report based only on your requirements.
  • Flexibility to add or subtract any chapter in the study.
  • Historic data from 2014 and forecasts outlook till 2040.
  • Flexibility of providing data/insights in formats (PDF, PPT, Excel).
  • Provide cross segmentation in applicable scenario/markets.