Certified Global Research Member
Isomar fd.webp Wcrc 57.webp
Key Questions Answered
  • Global Market Outlook
  • In-depth analysis of global and regional trends
  • Analyze and identify the major players in the market, their market share, key developments, etc.
  • To understand the capability of the major players based on products offered, financials, and strategies.
  • Identify disrupting products, companies, and trends.
  • To identify opportunities in the market.
  • Analyze the key challenges in the market.
  • Analyze the regional penetration of players, products, and services in the market.
  • Comparison of major players financial performance.
  • Evaluate strategies adopted by major players.
  • Recommendations
Why Choose Market Research Future?
  • Vigorous research methodologies for specific market.
  • Knowledge partners across the globe
  • Large network of partner consultants.
  • Ever-increasing/ Escalating data base with quarterly monitoring of various markets
  • Trusted by fortune 500 companies/startups/ universities/organizations
  • Large database of 5000+ markets reports.
  • Effective and prompt pre- and post-sales support.

Rendered Products Market Research Report Information By Source (Beef, Pork, Sheep, Poultry), By Category (Food Grade, Feed Grade, Industrial Grade), By Application (Cosmetic, Bio-Fuel, Animal Feed, Fertilizers, Food & Beverages), and By Region (North America, Europe, Asia-Pacific, And Rest Of The World) – Market Forecast Till 2030


ID: MRFR/F-B & N/3174-HCR | 110 Pages | Author: Sakshi Gupta| April 2024

Global Rendered Products Market Overview


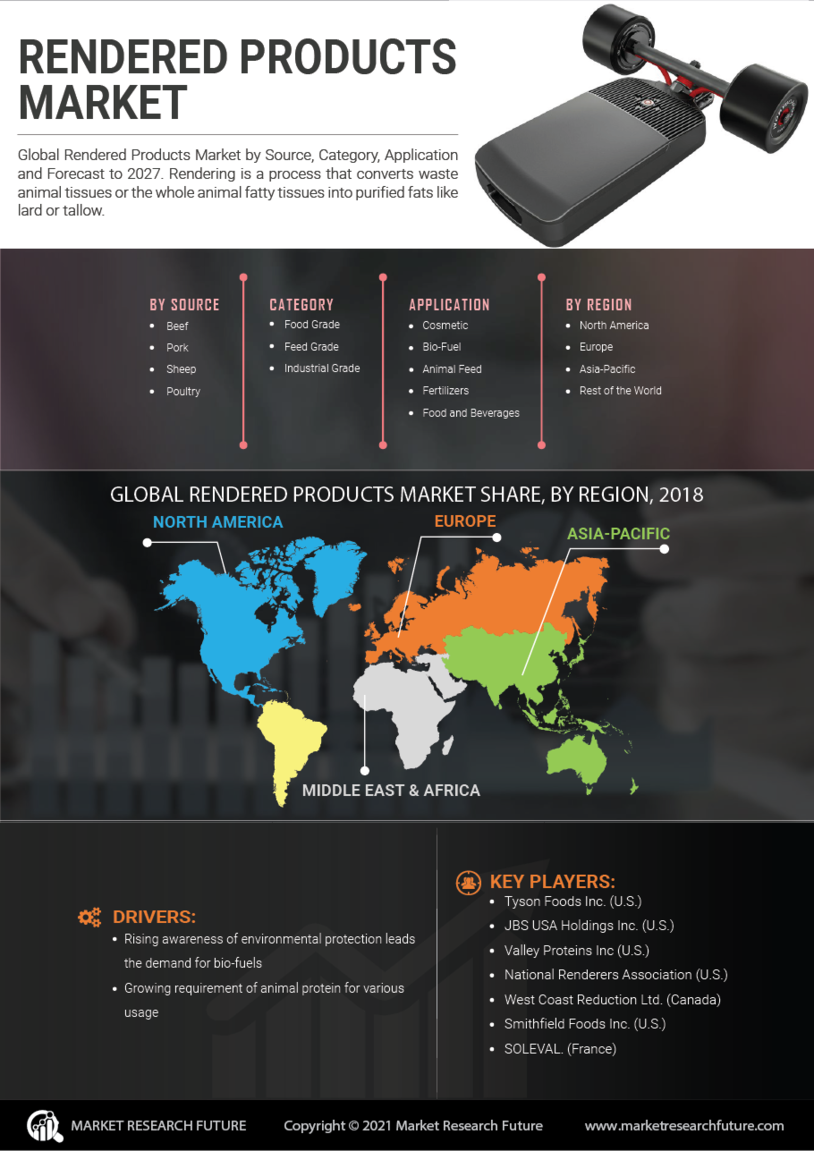
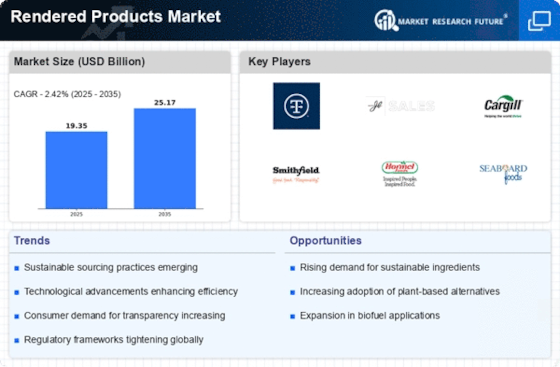
Rendered Products Market Size was valued at USD 18.9 billion in 2022. The Rendered Products market industry is projected to grow from USD 19.35 Billion in 2023 to USD 22.31 billion by 2030, exhibiting a compound annual growth rate (CAGR) of 2.4% during the forecast period (2023 - 2030). Phosphorus, nitrogen, and micronutrients are all highly present in animal byproducts. Several reasons, including the future demand for these items, will drive the market for rendered products., thus driving the growth of the rendered products market. These are just a few of the market drivers that are driving the market.


Rendered Products Market OverviewSource: Secondary Research, Primary Research, MRFR Database and Analyst Review


Rendered Products Market Trends


  • Growing demand uses for pet food, animal feed, and cosmetics to propel market growth


By managing falling stock from a wide range of materials, including bones, blood, feathers, and many others, from the meat processing sector and turning them into valuable byproducts, the rendering business provides a crucial service. Animal waste from diverse sources is recycled as part of the rendering process. These materials could pose a major risk to human health and the environment if not treated correctly. The rendering industry has several advantages for the environment, including a reduction in the amount of landfill space needed to dispose of animal waste and the elimination of the overproduction of carbon dioxide from animal waste, reducing greenhouse gas emissions. It is anticipated that growing environmental sustainability concerns will drive the industry. Thus, this factor is driving the market CAGR.


By managing falling stock from a wide range of materials, including bones, blood, feathers, and many others, from the meat processing sector and turning them into valuable byproducts, the rendering business provides a crucial service. Animal waste from diverse sources is recycled as part of the rendering process. These materials could pose a major risk to human health and the environment if not treated correctly. The rendering industry has several advantages for the environment, including a reduction in the amount of landfill space needed to dispose of animal waste and the elimination of the overproduction of carbon dioxide from animal waste, reducing greenhouse gas emissions. It is anticipated that growing environmental sustainability concerns will drive the industry.


An intriguing concept still in its infancy is producing unique products utilizing animal leftovers. An emerging trend in the market is expanding research into how animal feed quality can be improved by expanding the use of goods obtained through rendering. As an illustration, a recent study has raised the possibility of bio transforming residual red blood cells, bone meal, and meat into high-quality antioxidants and astaxanthin for animal feed. Thus, it is anticipated that this aspect will accelerate rendered products market revenue globally.


Rendered Products Market Segment Insights


Rendered Products Source Insights


The Rendered Products market segmentation, based on source includes, beef, pork, sheep, and poultry. The poultry segment held the majority share in 2022 in the rendered products market data Chicken slaughter is at an all-time high and is predicted to increase significantly over the projection period. For instance, the National Chicken Council (NCC), a national organization devoted to the chicken industry, estimates that in 2020, the average American will eat 96.4 pounds of chicken. Only 56.9 and 50.1 pounds of beef and pork were consumed annually. Furthermore, the USDA and Economic Research Service predict that by 2030, per-person chicken consumption will rise to 101.1 pounds. The need for rendered goods is anticipated to benefit from rising chicken consumption, the abundance of poultry byproducts, including feather meal, blood meal, poultry fat, and many others, and their growing application in the rendered industry.


Rendered Products Category Insights


The Rendered Products market segmentation, based on category, includes food grade, feed grade, and industrial grade. The feed grade segment dominated the market growth in 2022 and is projected to be the faster-growing segment during the forecast period, 2022-2030. In 2022, the revenue share for the feed grade category was higher than that of the industrial grade category. The use of the items to make value-added animal feed and specialty pet foods is expected to increase due to the rising demand for high-value animal feed and the expanding popularity of specialty pet foods. Additionally, it is anticipated that the demand for industrial quality rendered products will increase as more rendered fats and other substances are used to make soap, creams, and other personal care products., hence contributing in the growth of the rendered products market.


Figure 1: Rendered Products Market, by Category, 2022 & 2030 (USD Billion)Rendered Products Market, by Category, 2022 & 2030


Source: Secondary Research, Primary Research, MRFR Database and Analyst Review


Rendered Products Application Insights


The Rendered Products market segmentation, based on application includes, cosmetic, biofuel, animal feed, fertilizers, food & beverages. The animal feed segment held the majority share in 2022 in the rendered products market data. Increasing the use of protein meals in the animal feed sector is anticipated to promote the segment's expansion because it helps animals grow healthily.


Rendered Products Regional Insights


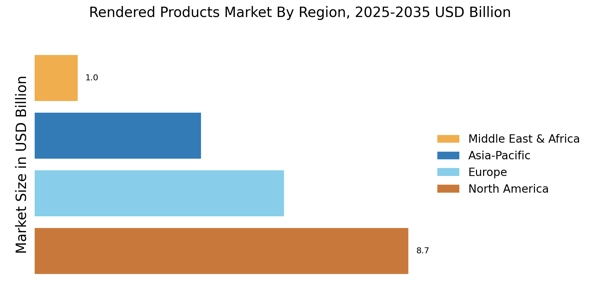
By region, the study provides the market insights into North America, Europe, Asia-Pacific and Rest of the World. North America Rendered Products market accounted for USD 8.656 billion in 2022 with a share of around 45.80% and is expected to exhibit a significant CAGR growth during the study period. The use of these items for value-added animal feed is projected to increase due to the dramatically rising demand for high-quality animal feed to maximize the potential of ranch animals. Additionally, the rising demand for specialty pet food is anticipated to fuel market expansion further. New product development, partnerships, partnerships, expansions, mergers, and acquisitions are the main strategies used by the organisations in the market.


Further, the major countries studied in the market report are: The U.S, Canada, Germany, France, UK, Italy, Spain, China, Japan, India, Australia, South Korea, and Brazil.


Figure 2: RENDERED PRODUCTS MARKET SHARE BY REGION 2022 (%)RENDERED PRODUCTS MARKET SHARE BY REGION 2022


Source: Secondary Research, Primary Research, MRFR Database and Analyst Review


Europe Rendered Products market accounts for the second-largest market share. In the upcoming years, the market share of Europe's rendered products is predicted to increase because of the rising demand for high-quality animal feed and the increasing use of animal byproducts in pet foods. The Feed LCA Institute (GFLI) estimates that Europe processes about 18 million tonnes of animal products annually. Moreover, UK Rendered Products market held the largest market share, and the Germany Rendered Products market was the fastest growing market in the region.


Asia Pacific Rendered Products Market is expected to grow at the fastest CAGR from 2022 to 2030. It can be attributed to the region's expanding food animal industry, changing economics, and growing population. The consumption and production of livestock products have significantly increased in the region, which can help the rendering industry in nations that produce meat, including China and India. Further, the China Rendered Products market held the largest market share, and the India Rendered Products market was the fastest-growing market in the region.


Rendered Products Key Market Players & Competitive Insights


Major market players are spending a lot of money on R&D to increase their product lines, which will help the Rendered Products market grow even more. Market participants are also taking a range of strategic initiatives to grow their worldwide footprint, with key market developments such as new product launches, mergers and acquisitions, contractual agreements, increased investments, and collaboration with other organizations. Competitors in the rendered products industry must offer cost-effective items to expand and survive in an increasingly competitive and rising market environment.


One of the primary business strategies adopted by manufacturers in the rendered products industry to benefit clients and expand the market sector is to manufacture locally to reduce operating costs. In recent years, rendered products industry has provided medicine with some of the most significant benefits. The Rendered Products market major player such as National Renderers Association, Valley Proteins Inc, Smithfield Foods Inc., JBS USA Holdings Inc.


Tyson Foods, Inc. is a worldwide American company headquartered in Springdale, Arkansas that works in the food sector. After JBS S.A., the corporation is the world's second-largest processor and marketer of beef, hog, and chicken. Most of the beef exported from the United States annually comes from this country. Tyson Foods Inc. established a coalition for protein in January 2020 to advance the development of sustainable protein.


The largest meat-processing corporation in the world, JBS S.A., is based in Brazil and produces factory-processed beef, chicken, and pigs in addition to selling its by-products. Its main office is in Sao Paulo. In 1953, it was established in Anápolis, Goiás. In Mato Grosso, Brazil, a new plant owned by JBS SA called Friboi opened in January 2020. This plant initially had a daily processing capacity of 500 animals.


Key Companies in the Rendered Products market includes


  • National Renderers Association

  • Valley Proteins Inc

  • Smithfield Foods Inc.

  • JBS USA Holdings Inc.

  • SOLEVAL

  • Tyson Foods Inc.

  • Darling Ingredients Inc.

  • SRC Companies Inc.

  • Nordfeed

  • Leo Group

  • Sanimax


Rendered Products Industry Developments


March 2022: Darling Ingredients Inc., an industry leader in producing renewable energy and rendering goods, recently purchased FASA Group, a top rendering company in Brazil, for about USD 560 million. Through its 14 rendering factories, FASA Group processes more than 1.3 million metric tonnes annually.


March 2022: To remove non-toxic foreign objects from meat wastes, Tomra Foods develops and manufactures sensor-based sorting equipment for the food sector. Stones, hard and soft polymers, metal, wood, glass, rubber, and bones can all be effectively detected and sorted by TOMRA 5B in finished goods.


Rendered Products Market Segmentations


Rendered Products Type Outlook (USD Billion, 2018-2030)


  • Beef

  • Pork

  • Sheep

  • Poultry


Rendered Products Category Outlook (USD Billion, 2018-2030)


  • Food Grade

  • Feed Grade

  • Industrial Grade


Rendered Products Application Outlook (USD Billion, 2018-2030)


  • Cosmetic

  • Biofuel

  • Animal Feed

  • Fertilizers

  • Food & Beverages


Rendered Products Regional Outlook (USD Billion, 2018-2030)


  • North America

    • US

    • Canada


  • Europe

    • Germany

    • France

    • UK

    • Italy

    • Spain

    • Rest of Europe


  • Asia-Pacific

    • China

    • Japan

    • India

    • Australia

    • South Korea

    • Australia

    • Rest of Asia-Pacific


  • Rest of the World

    • Middle East

    • Africa

    • Latin America


Report Attribute/Metric Details
Market Size 2022 USD 18.9 billion
Market Size 2023 USD 19.35 billion
Market Size 2030 USD 22.313 billion
Compound Annual Growth Rate (CAGR)  2.4% (2023-2030)
Base Year 2022
Market Forecast Period 2023-2030
Historical Data 2018 - 2021
Market Forecast Units Value (USD Billion)
Report Coverage Revenue Forecast, Market Competitive Landscape, Growth Factors, and Trends
Segments Covered Type, Source, Application and Region
Geographies Covered North America, Europe, Asia Pacific, and Rest of the World
Countries Covered The U.S, Canada, Germany, France, UK, Italy, Spain, China, Japan, India, Australia, South Korea, and Brazil
Key Companies Profiled National Renderers Association, Valley Proteins Inc, Smithfield Foods Inc., JBS USA Holdings Inc.
Key Market Opportunities Growing demand uses for pet food, animal feed, and cosmetics
Key Market Dynamics Wide usage in the cosmetic s industry


Frequently Asked Questions (FAQ) :

The Rendered Products market size was valued at USD 18.9 Billion in 2022.

The market is projected to grow at a CAGR of 2.4% during the forecast period, 2022-2030.

North America had the largest share in the market

The key players in the market are National Renderers Association, Valley Proteins Inc, Smithfield Foods Inc., JBS USA Holdings Inc.

The poultry category dominated the market in 2022.

The animal feed had the largest share in the market.

Leading companies partner with us for data-driven Insights
client_1 client_2 client_3 client_4 client_5 client_6 client_7 client_8 client_9 client_10
Kindly complete the form below to receive a free sample of this Report
Please fill in Business Email for Quick Response

We do not share your information with anyone. However, we may send you emails based on your report interest from time to time. You may contact us at any time to opt-out.

Purchase Option
Single User $ 4,950
Multiuser License $ 5,950
Enterprise User $ 7,250
Compare Licenses
Tailored for You
  • Dedicated Research on any specifics segment or region.
  • Focused Research on specific players in the market.
  • Custom Report based only on your requirements.
  • Flexibility to add or subtract any chapter in the study.
  • Historic data from 2014 and forecasts outlook till 2040.
  • Flexibility of providing data/insights in formats (PDF, PPT, Excel).
  • Provide cross segmentation in applicable scenario/markets.