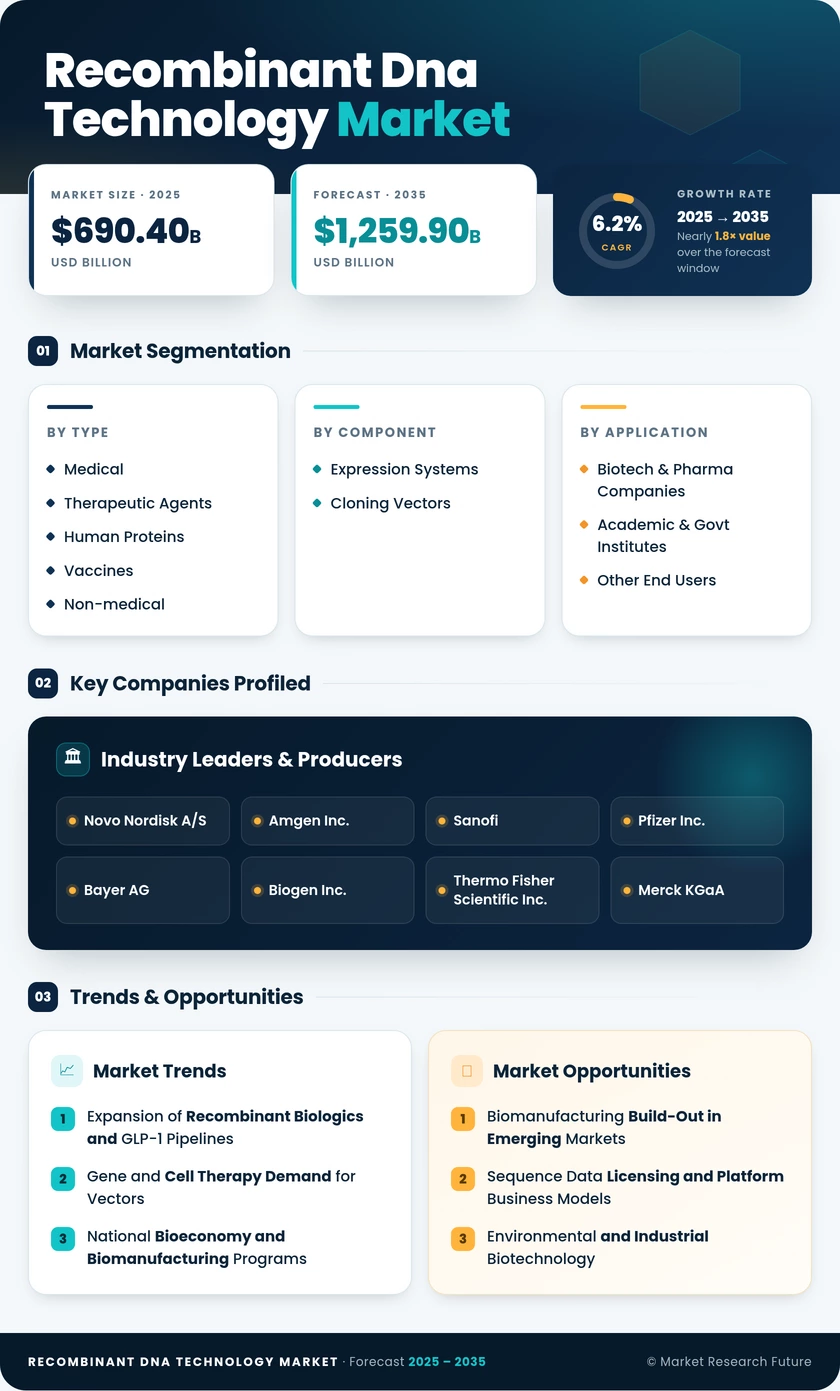
Recombinant DNA Technology Market (2026 - 2035)

ID: MRFR/LS/4389-HCR 100 Pages Vikita Thakur Last Updated: October 21, 2026
Recombinant DNA Technology Market Research Report Information By Product (Medical and Non-Medical), By Component (Expression System and Cloning Vector), By Application (Food & Agriculture, and Health & Disease), By End User (Biotechnology Companies and Pharmaceuticals) And By Region (North America, Europe, Asia-Pacific, And Rest Of The World) –Market Forecast Till 2035
Recombinant DNA Technology Market
Market Size
Forecast Period2026-2035
CAGR (2026-2035)6.2%
2025 Market SizeUSD 690.4 Billion
2035 Market SizeUSD 1,259.9 Billion
Key Players
Novo Nordisk A/S
Amgen Inc.
Sanofi
Pfizer Inc.
Bayer AG
Biogen Inc.
Opportunities
  • Biomanufacturing Build-Out in Emerging Markets
  • Sequence Data Licensing and Platform Business Models
  • Environmental and Industrial Biotechnology
  1. 1 Market Summary | |
  2. 2 Key Report Takeaways | |
    1. 2.1 By Product | |
    2. 2.2 By Component | |
    3. 2.3 By Application | |
    4. 2.4 By End User | |
    5. 2.5 By Region | |
  3. 3 Market Size and Forecast (2021–2035) | |
  4. 4 Driver Impact Analysis | |
    1. 4.1 Expansion of Recombinant Biologics and GLP-1 Pipelines | |
    2. 4.2 Gene and Cell Therapy Demand for Vectors | |
    3. 4.3 National Bioeconomy and Biomanufacturing Programs | |
    4. 4.4 Biosimilar Adoption | |
    5. 4.5 Biomanufacturing Capacity Investment | |
    6. 4.6 Biotech Crop Adoption | |
  5. 5 Restraints Impact Analysis | |
    1. 5.1 Drug Price Controls and Negotiation | |
    2. 5.2 High Development and Manufacturing Cost of Advanced Therapies | |
    3. 5.3 Fragmented GMO and Genome-Editing Regulation | |
    4. 5.4 Supply Chain and Geopolitical Decoupling | |
    5. 5.5 Patent Expiries and Originator Revenue Erosion | |
  6. 6 Opportunities | |
    1. 6.1 Biomanufacturing Build-Out in Emerging Markets | |
    2. 6.2 Sequence Data Licensing and Platform Business Models | |
    3. 6.3 Environmental and Industrial Biotechnology | |
    4. 6.4 Personalized Cancer Vaccines and Vector Supply | |
    5. 6.5 Precision Fermentation for Food Ingredients | |
  7. 7 Regional Market Share and Country-Level Analysis | |
    1. 7.1 North America | | |
      1. 7.1.1 US | | |
      2. 7.1.2 Canada | | |
      3. 7.1.3 Mexico | |
    2. 7.2 Europe | | |
      1. 7.2.1 Germany | | |
      2. 7.2.2 UK | | |
      3. 7.2.3 France | | |
      4. 7.2.4 Italy | | |
      5. 7.2.5 Spain | | |
      6. 7.2.6 Nordic Countries | | |
      7. 7.2.7 Russia | | |
      8. 7.2.8 Rest of Europe | |
    3. 7.3 Asia-Pacific | | |
      1. 7.3.1 China | | |
      2. 7.3.2 India | | |
      3. 7.3.3 Japan | | |
      4. 7.3.4 South Korea | | |
      5. 7.3.5 ASEAN | | |
      6. 7.3.6 Rest of Asia-Pacific | |
    4. 7.4 South America | | |
      1. 7.4.1 Brazil | | |
      2. 7.4.2 Argentina | | |
      3. 7.4.3 Rest of South America | |
    5. 7.5 Middle East & Africa | | |
      1. 7.5.1 Saudi Arabia | | |
      2. 7.5.2 UAE | | |
      3. 7.5.3 South Africa | | |
      4. 7.5.4 Egypt | | |
      5. 7.5.5 Rest of MEA | |
  8. 8 Future Outlook (2026–2035) | |
    1. 8.1 AI-Designed Proteins and Constructs | |
    2. 8.2 Continuous and Distributed Biomanufacturing | |
    3. 8.3 Biosecurity and Supply Chain Localization | |
    4. 8.4 Bio-Based Substitution and Sustainability Reporting | |
  9. 9 Segmentation Analysis | |
    1. 9.1 By Product | | |
      1. 9.1.1 Medical | | |
      2. 9.1.2 Non-medical | |
    2. 9.2 By Component | | |
      1. 9.2.1 Expression Systems | | |
      2. 9.2.2 Cloning Vectors | |
    3. 9.3 By Application | | |
      1. 9.3.1 Food & Agriculture | | |
      2. 9.3.2 Health & Disease | | |
      3. 9.3.3 Environment | | |
      4. 9.3.4 Other Applications | |
    4. 9.4 By End User | | |
      1. 9.4.1 Biotech & Pharma Companies | | |
      2. 9.4.2 Academic & Govt Institutes | | |
      3. 9.4.3 Other End Users | |
  10. 10 Competitive Landscape | |
  11. 11 Recent News & Developments | |
  12. 12 Report Scope and Methodology | |
  13. 13 Detailed Sources and Citations | |
  14. 14 Frequently Asked Questions (FAQs) | | LIST OF TABLES | |
  15. TABLE 1 Global Market Snapshot, 2025–2035 | |
  16. TABLE 2 Global Market Size & Forecast, by Revenue (USD Billion), 2021–2035 | |
  17. TABLE 3 Driver Impact Analysis, 2026–2035 | |
  18. TABLE 4 Restraints Impact Analysis, 2026–2035 | |
  19. TABLE 5 Regional Summary, 2025 | |
  20. TABLE 6 North America, by Country, 2025 | |
  21. TABLE 7 Europe, by Country, 2025 | |
  22. TABLE 8 Asia-Pacific, by Country, 2025 | |
  23. TABLE 9 South America, by Country, 2025 | |
  24. TABLE 10 Middle East & Africa, by Country, 2025 | |
  25. TABLE 11 Global Market, by Product, 2025 | |
  26. TABLE 12 Global Market, by Component, 2025 | |
  27. TABLE 13 Global Market, by Application, 2025 | |
  28. TABLE 14 Global Market, by End User, 2025 | |
  29. TABLE 15 Competitive Benchmarking Table, 2025 | |
  30. TABLE 16 Report Scope and Methodology | |
  31. TABLE 17 Detailed Sources and Citations | | LIST OF FIGURES | |
  32. FIGURE 1 Market Dynamics Overview (Drivers, Restraints, Opportunities) | |
  33. FIGURE 2 Industry Value Chain Analysis | |
  34. FIGURE 3 Porter's Five Forces Analysis | |
  35. FIGURE 4 Global Market Size Trend (USD Billion), 2021–2035 | |
  36. FIGURE 5 Market Share by Product, 2025 | |
  37. FIGURE 6 Market Share by Component, 2025 | |
  38. FIGURE 7 Market Share by Application, 2025 | |
  39. FIGURE 8 Market Share by End User, 2025 | |
  40. FIGURE 9 Regional Market Share, 2025 | |
  41. FIGURE 10 Country-Level Growth Comparison, 2026–2035 | |
  42. FIGURE 11 Competitive Landscape Positioning Matrix, 2025

Segmentation Quick Reference

DimensionSub-SegmentsDominant SegmentFastest Growing Segment
By ProductMedical (Therapeutic Agents, Human Proteins, Vaccines); Non-medical (Biotech Crops, Specialty Chemicals, Other Non-medical Products)Medical (61.4% share)Non-medical (11.5% CAGR)
By ComponentExpression Systems; Cloning VectorsExpression Systems (60.7% share)Cloning Vectors (9.3% CAGR)
By ApplicationFood & Agriculture; Health & Disease; Environment; Other ApplicationsHealth & Disease (43.8% share)Environment (11.8% CAGR)
By End UserBiotech & Pharma Companies; Academic & Govt Institutes; Other End UsersBiotech & Pharma Companies (50.6% share)Academic & Govt Institutes (9.0% CAGR)
By RegionNorth America; Europe; Asia-Pacific; South America; Middle East & AfricaNorth America (35.6% share)Asia-Pacific (8.1% CAGR)

Market Segmentation Overview

By Product

Sub-SegmentKey Trend
MedicalTherapeutic agents, human proteins and vaccines anchored by reimbursement and process maturity
Non-medicalBiotech crops, specialty chemicals and industrial enzymes scaling outside healthcare

Medical products lead with a 61.4% share because therapeutic agents and human proteins such as insulin benefit from validated manufacturing and payer coverage. Non-medical products grow fastest at an 11.5% CAGR as new biotech crop approvals and fermentation-based specialty chemicals replace conventional inputs. That growth diversifies revenue away from drug-pricing cycles.

By Component

Sub-SegmentKey Trend
Expression SystemsMammalian hosts for complex antibodies; microbial and yeast hosts for low-cost proteins
Cloning VectorsGMP-grade plasmids and viral backbones for gene therapies and individualized vaccines

Expression Systems hold a 60.7% share because every recombinant product depends on a production host, with mammalian cells priced at a premium for glycosylated antibodies. Cloning Vectors grow fastest at a 9.3% CAGR, driven by gene-therapy trials and patient-specific vaccines that need small, rapid, GMP-grade plasmid batches.

By Application

Sub-SegmentKey Trend
Food & AgricultureTrait licensing and food-processing enzymes
Health & DiseaseAntibodies, CAR-T and gene therapies in oncology and rare disease
EnvironmentBioremediation, wastewater treatment and carbon conversion
Other ApplicationsResearch reagents, cosmetics and biomaterials

Health & Disease leads with a 43.8% share as oncology and rare-disease biologics secure approvals and premium pricing. Environment grows fastest at an 11.8% CAGR because public funding for carbon capture and wastewater treatment favors engineered microbes. Food & Agriculture remains a large, stable base, though uneven national biosafety rules slow trait launches.

By End User

Sub-SegmentKey Trend
Biotech & Pharma CompaniesIntegrated development, GMP manufacturing and commercial launch
Academic & Govt InstitutesPublicly funded research and upgraded laboratory infrastructure
Other End UsersCROs, CDMOs, agribusiness and industrial buyers on service models

Biotech & Pharma Companies lead with a 50.6% share because they own clinical development, GMP capacity and commercial channels. Academic & Govt Institutes grow fastest at a 9.0% CAGR, supported by public research budgets and post-pandemic biosafety lab upgrades. Other End Users earn recurring service revenue while avoiding direct clinical risk.

6 minutes ago

Download PDF ×

We do not share your information with anyone. However, we may send you emails based on your report interest from time to time. You may contact us at any time to opt-out.