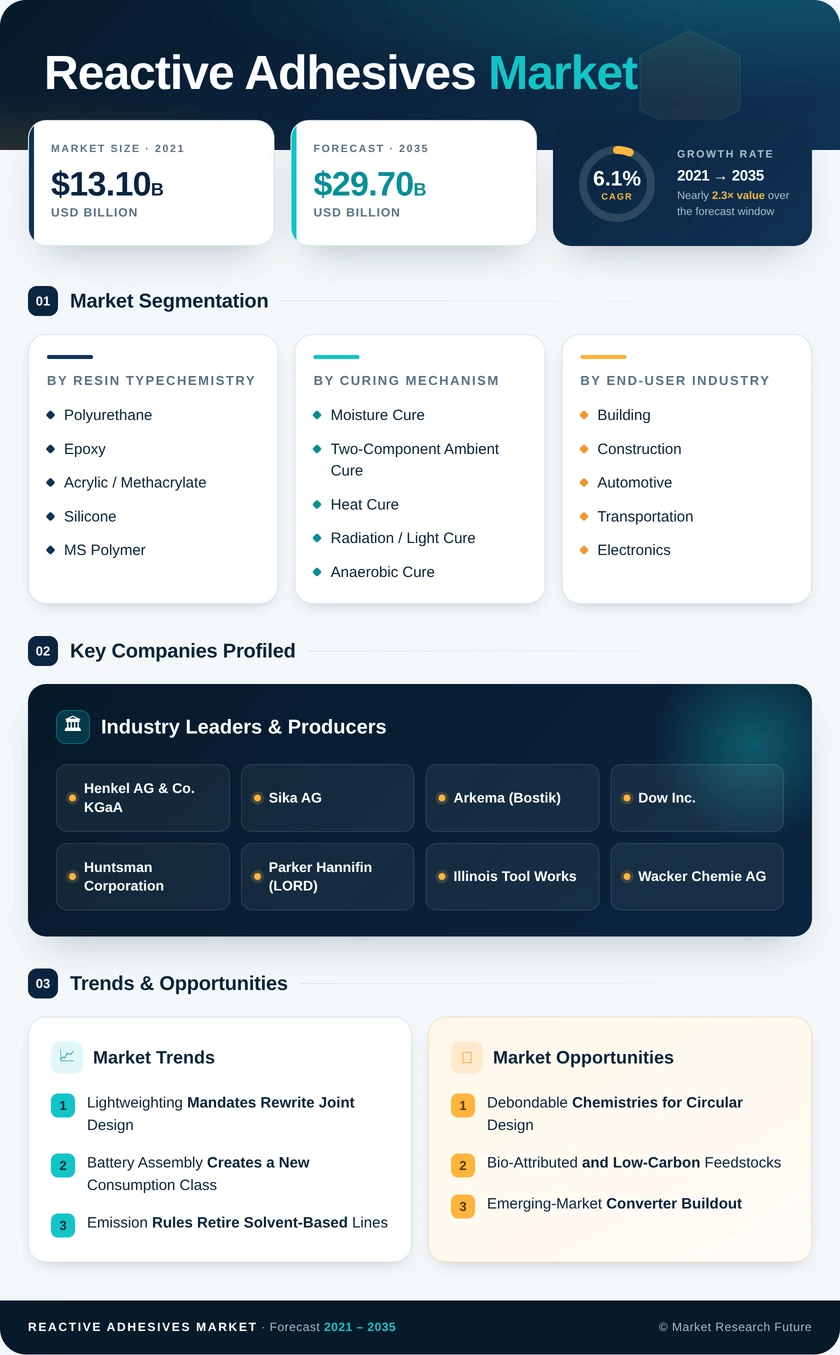
Reactive Adhesives Market (2026 - 2035)

ID: MRFR/AT/30121-HCR 100 Pages Triveni Bhoyar Last Updated: October 17, 2026
Reactive Adhesives Market Research Report By Resin Type (Polyurethane, Epoxy, Acrylic / Methacrylate, Silicone and MS Polymer, Cyanoacrylate, Anaerobic and Others), By Curing Mechanism (Moisture Cure, Two-Component Ambient Cure, Heat Cure, Radiation / Light Cure, Anaerobic Cure), By End-User Industry (Building and Construction, Automotive and Transportation, Electronics and Electricals, Woodworking and Furniture, Packaging, Footwear and Leather, Aerospace, Medical and Others) - Forecast to 2035
Reactive Adhesives Market
Market Size
Forecast Period2026-2035
CAGR (2026-2035)6.1%
2025 Market SizeUSD 16.4 Billion
2035 Market SizeUSD 29.7 billion
Key Players
Henkel AG & Co. KGaA
Sika AG
Arkema
Dow Inc.
Huntsman Corporation
Parker Hannifin
Opportunities
  • Debondable Chemistries for Circular Design
  • Bio-Attributed and Low-Carbon Feedstocks
  • Emerging-Market Converter Buildout
  1. 1 Market Overview | |
    1. 1.1 Study Assumptions & Market Definition | |
    2. 1.2 Scope of the Study | |
    3. 1.3 Research Methodology | |
  2. 2 Market Summary & Key Report Takeaways | |
    1. 2.1 Takeaways by Chemistry | |
    2. 2.2 Takeaways by End-Use Sector | |
    3. 2.3 Takeaways by Region | |
  3. 3 Market Size & Forecast (2021–2035) | |
    1. 3.1 Historical Market Size (2021–2025) | |
    2. 3.2 Current & Forecast Market Size (2026–2035) | |
    3. 3.3 Market Size by Revenue (USD Billion) | |
    4. 3.4 Year-over-Year Growth Analysis | |
  4. 4 Market Drivers Analysis | |
    1. 4.1 Lightweighting Mandates & Multi-Material Joint Design | |
    2. 4.2 Battery Pack Assembly & Thermal Interfacing | |
    3. 4.3 VOC Regulation & Solvent-Line Retirement | |
    4. 4.4 Electronics Packaging Performance Thresholds | |
    5. 4.5 Prefabricated Construction & Medical Device Bonding | |
  5. 5 Market Restraints Analysis | |
    1. 5.1 Epoxy & Isocyanate Feedstock Volatility | |
    2. 5.2 Diisocyanate Restriction & User Training Obligations | |
    3. 5.3 Dispensing Equipment Capital Economics | |
    4. 5.4 Competition from Welding & Mechanical Fastening | |
    5. 5.5 Applicator Skills Gap & Bond-Line Inspection | |
  6. 6 Market Opportunity Analysis | |
    1. 6.1 Debondable Chemistries for Circular Design | |
    2. 6.2 Bio-Attributed & Low-Carbon Feedstocks | |
    3. 6.3 Emerging-Market Converter Buildout | |
    4. 6.4 Service, Equipment & Bond-Line Data Monetisation | |
    5. 6.5 Medical & Wearable Bonding | |
    6. 6.6 Industry Value Chain Analysis | |
    7. 6.7 Porter's Five Forces Analysis | |
  7. 7 Regional Analysis | |
    1. 7.1 North America | | |
      1. 7.1.1 United States | | |
      2. 7.1.2 Canada | | |
      3. 7.1.3 Mexico | |
    2. 7.2 Europe | | |
      1. 7.2.1 Germany | | |
      2. 7.2.2 France | | |
      3. 7.2.3 United Kingdom | | |
      4. 7.2.4 Italy | | |
      5. 7.2.5 Rest of Europe | |
    3. 7.3 Asia-Pacific | | |
      1. 7.3.1 China | | |
      2. 7.3.2 India | | |
      3. 7.3.3 Japan | | |
      4. 7.3.4 South Korea | | |
      5. 7.3.5 Rest of Asia-Pacific | |
    4. 7.4 South America | | |
      1. 7.4.1 Brazil | | |
      2. 7.4.2 Argentina | | |
      3. 7.4.3 Rest of South America | |
    5. 7.5 Middle East & Africa | | |
      1. 7.5.1 Saudi Arabia | | |
      2. 7.5.2 United Arab Emirates | | |
      3. 7.5.3 South Africa | | |
      4. 7.5.4 Rest of Middle East & Africa | |
  8. 8 Future Outlook (2026–2035) | |
    1. 8.1 Instrumented Bonding Lines & Process Analytics | |
    2. 8.2 Electrification Beyond Passenger Vehicles | |
    3. 8.3 Cure Speed as Governing Specification | |
    4. 8.4 Carbon Accounting at the Adhesive Line | |
  9. 9 Segmentation Analysis | |
    1. 9.1 By Resin Type | | |
      1. 9.1.1 Polyurethane | | |
      2. 9.1.2 Epoxy | | |
      3. 9.1.3 Acrylic / Methacrylate | | |
      4. 9.1.4 Silicone and MS Polymer | | |
      5. 9.1.5 Cyanoacrylate | | |
      6. 9.1.6 Anaerobic and Others | |
    2. 9.2 By Curing Mechanism | | |
      1. 9.2.1 Moisture Cure | | |
      2. 9.2.2 Two-Component Ambient Cure | | |
      3. 9.2.3 Heat Cure | | |
      4. 9.2.4 Radiation / Light Cure | | |
      5. 9.2.5 Anaerobic Cure | |
    3. 9.3 By End-User Industry | | |
      1. 9.3.1 Building and Construction | | |
      2. 9.3.2 Automotive and Transportation | | |
      3. 9.3.3 Electronics and Electricals | | |
      4. 9.3.4 Woodworking and Furniture | | |
      5. 9.3.5 Packaging | | |
      6. 9.3.6 Footwear and Leather | | |
      7. 9.3.7 Aerospace, Medical and Others | |
  10. 10 Competitive Landscape | |
    1. 10.1 Market Share Analysis (2026) | |
    2. 10.2 Competitive Benchmarking Matrix | |
    3. 10.3 Company Profiles | | |
      1. 10.3.1 Henkel AG & Co. KGaA | | |
      2. 10.3.2 H.B. Fuller Company | | |
      3. 10.3.3 3M Company | | |
      4. 10.3.4 Sika AG | | |
      5. 10.3.5 Arkema (Bostik) | | |
      6. 10.3.6 Dow Inc. | | |
      7. 10.3.7 Huntsman Corporation | | |
      8. 10.3.8 Parker Hannifin (LORD) | | |
      9. 10.3.9 Illinois Tool Works | | |
      10. 10.3.10 Wacker Chemie AG | |
  11. 11 Recent Developments & News | |
  12. 12 Report Scope & Methodology | |
    1. 12.1 Study Period & Base Year | |
    2. 12.2 Data Sources & Citations | |
    3. 12.3 Abbreviations | |
  13. 13 Detailed Sources & Citations | |
  14. 14 Frequently Asked Questions | | LIST OF TABLES | |
  15. TABLE 1 Global Reactive Adhesives Market Size & Forecast, by Revenue (USD Billion), 2021–2035 | |
  16. TABLE 2 Global Reactive Adhesives Market – Year-over-Year Growth Analysis, 2021–2035 | |
  17. TABLE 3 Driver Impact Analysis – Contribution to Forecast CAGR, 2026–2035 | |
  18. TABLE 4 Restraint Impact Analysis – Drag on Forecast CAGR, 2026–2035 | |
  19. TABLE 5 Global Market Size, by Chemistry, 2021–2035 (USD Billion) | |
  20. TABLE 6 Global Market Size, by Curing Mechanism, 2021–2035 (USD Billion) | |
  21. TABLE 7 Global Market Size, by End-Use Industry, 2021–2035 (USD Billion) | |
  22. TABLE 8 Global Market Size, by Region, 2021–2035 (USD Billion) | |
  23. TABLE 9 Regional Summary – Share, Value and Investment Themes, 2025 | |
  24. TABLE 10 North America Market Size, by Country, 2021–2035 (USD Billion) | |
  25. TABLE 11 Europe Market Size, by Country, 2021–2035 (USD Billion) | |
  26. TABLE 12 Asia-Pacific Market Size, by Country, 2021–2035 (USD Billion) | |
  27. TABLE 13 South America Market Size, by Country, 2021–2035 (USD Billion) | |
  28. TABLE 14 Middle East & Africa Market Size, by Country, 2021–2035 (USD Billion) | |
  29. TABLE 15 North America Market Size, by Chemistry, 2021–2035 (USD Billion) | |
  30. TABLE 16 North America Market Size, by End-Use Industry, 2021–2035 (USD Billion) | |
  31. TABLE 17 Europe Market Size, by Chemistry, 2021–2035 (USD Billion) | |
  32. TABLE 18 Europe Market Size, by End-Use Industry, 2021–2035 (USD Billion) | |
  33. TABLE 19 Asia-Pacific Market Size, by Chemistry, 2021–2035 (USD Billion) | |
  34. TABLE 20 Asia-Pacific Market Size, by End-Use Industry, 2021–2035 (USD Billion) | |
  35. TABLE 21 South America Market Size, by Chemistry, 2021–2035 (USD Billion) | |
  36. TABLE 22 Middle East & Africa Market Size, by Chemistry, 2021–2035 (USD Billion) | |
  37. TABLE 23 United States Market Size, by End-Use Industry, 2021–2035 (USD Billion) | |
  38. TABLE 24 China Market Size, by End-Use Industry, 2021–2035 (USD Billion) | |
  39. TABLE 25 India Market Size, by End-Use Industry, 2021–2035 (USD Billion) | |
  40. TABLE 26 Germany Market Size, by End-Use Industry, 2021–2035 (USD Billion) | |
  41. TABLE 27 Competitive Benchmarking Matrix, 2026 | |
  42. TABLE 28 Company Profiles – Key Players | |
  43. TABLE 29 Recent Developments & Strategic Announcements, 2023–2025 | |
  44. TABLE 30 Report Scope & Methodology Summary | |
  45. TABLE 31 Detailed Sources and Citations Index | | LIST OF FIGURES | |
  46. FIGURE 1 Market Dynamics – Drivers, Restraints and Opportunities Map | |
  47. FIGURE 2 Industry Value Chain Analysis – Feedstock to Converter to OEM | |
  48. FIGURE 3 Porter's Five Forces Analysis | |
  49. FIGURE 4 Global Market Size Trend and Forecast, 2021–2035 (USD Billion) | |
  50. FIGURE 5 Year-over-Year Growth Rate Trend, 2022–2035 (%) | |
  51. FIGURE 6 Market Share by Chemistry, 2025 vs 2035 (%) | |
  52. FIGURE 7 Market Share by Curing Mechanism, 2025 (%) | |
  53. FIGURE 8 Market Share by End-Use Industry, 2025 vs 2035 (%) | |
  54. FIGURE 9 Regional Revenue Share Distribution, 2025 (%) | |
  55. FIGURE 10 Regional CAGR Comparison, 2026–2035 (%) | |
  56. FIGURE 11 Country-Level Growth Heat Map, 2026–2035 | |
  57. FIGURE 12 Competitive Landscape – Estimated Revenue Share Bands, 2026 | |
  58. FIGURE 13 Strategic Positioning Matrix – Portfolio Breadth vs Qualification Depth | |
  59. FIGURE 14 Regulatory Timeline Impacting Formulation, 2023–2030

Segmentation Quick Reference

DimensionSub-SegmentsDominant SegmentFastest Growing Segment
By Resin TypePolyurethane; Epoxy; Acrylic / Methacrylate; Silicone and MS Polymer; Cyanoacrylate; Anaerobic and OthersPolyurethaneAcrylic / Methacrylate
By Curing MechanismMoisture Cure; Two-Component Ambient Cure; Heat Cure; Radiation / Light Cure; Anaerobic CureMoisture CureRadiation / Light Cure
By End-User IndustryBuilding and Construction; Automotive and Transportation; Electronics and Electricals; Woodworking and Furniture; Packaging; Footwear and Leather; Aerospace, Medical and OthersBuilding and ConstructionElectronics and Electricals
By RegionNorth America; Europe; Asia-Pacific; South America; Middle East & AfricaAsia-PacificMiddle East & Africa


Market Segmentation Overview

By Resin Type

Sub-SegmentKey Trend
PolyurethaneOne-component moisture-cure grades expand in glazing, panel lamination and edge banding
EpoxyToughened two-part grades gain crash-relevant structural roles in bonded body structures
Acrylic / MethacrylateOily-metal tolerance removes degreasing steps and shortens takt time
Silicone and MS PolymerThermal management and elastic sealing demand rises with battery enclosures
CyanoacrylateRepair, aftermarket and small-part assembly hold steady niche volumes
Anaerobic and OthersThreadlocking and retaining compounds follow industrial equipment output cycles


Chemistry selection increasingly follows joint function rather than tradition. Formulators that hold positions in both flexible and structural chemistries capture platform-level specifications, while single-chemistry specialists compete on qualification depth in narrow, high-margin applications.

By Curing Mechanism

Sub-SegmentKey Trend
Moisture CurePreferred where mixing equipment is impractical, or line volumes fluctuate
Two-Component Ambient CureStandard for load-bearing joints requiring predictable ultimate strength
Heat CureIntegrates with existing automotive paint and e-coat oven cycles
Radiation / Light CureFastest fixture times; expanding beyond electronics into medical and optics
Anaerobic CureMetal-to-metal locking and sealing tied to machinery and MRO demand


Curing route decides capital exposure more than raw material cost. Plants able to justify meter-mix and inline cure verification systems unlock higher-value structural work; those that cannot remain concentrated in one-component chemistries.

By End-User Industry

Sub-SegmentKey Trend
Building and ConstructionPrefabricated panels and façade systems replace on-site mechanical fixing
Automotive and TransportationMulti-material architectures and battery enclosures raise adhesive content per vehicle
Electronics and ElectricalsAdvanced packaging formats increase adhesive consumption per device
Woodworking and FurnitureEngineered panel output and thin-bond-line aesthetics drive reformulation
PackagingFlexible laminate and carton conversion favour fast-setting reactive systems
Footwear and LeatherSolvent substitution reshapes sole attachment across Asian and Brazilian clusters
Aerospace, Medical and OthersComposite bonding and device assembly deliver premium margins at modest volume


Sector mix determines regional performance across the forecast. Regions weighted toward electronics and automotive assembly outgrow those anchored in construction and packaging, which is the clearest explanation for Asia-Pacific's widening lead through 2035.




Download PDF ×

We do not share your information with anyone. However, we may send you emails based on your report interest from time to time. You may contact us at any time to opt-out.