×
  • Cat-intel
  • MedIntelliX
  • Resources
  • About Us
  • Hero Background
    English
    Chinese
    French
    Japanese
    Korean
    German
    Spanish

    Quantum Sensors Market Trends

    ID: MRFR/SEM/3835-CR
    94 Pages
    Aarti Dhapte
    February 2020

    Quantum Sensors Market Research Report Information By Product (Atomic Clocks, Photosynthetically Active Radiation (PAR), Gravity Sensors, Magnetic Sensors, and Quantum Sensors), By Verticals (Oil & Gas, Military & Defense, Automotive, Healthcare, and Agriculture), And By Region (North America, Europe, Asia-Pacific, And Rest Of The World) – Industry Size, Share and Trends Till 2032

    Share:
    Download PDF ×

    We do not share your information with anyone. However, we may send you emails based on your report interest from time to time. You may contact us at any time to opt-out.

    Quantum Sensors Market Infographic
    Purchase Options

    Market Trends

    Key Emerging Trends in the Quantum Sensors Market

    Quantum Technology in Healthcare:

    Quantum technology is poised to revolutionize healthcare, medicine, and biological research, ushering in a new era of precision and accuracy. Medical researchers and scientists are increasingly leveraging quantum-based data obtained through technologies such as quantum cryptography, quantum computing, and quantum entanglement to enhance techniques for storing and safeguarding healthcare databases, patient treatment, and diagnostics.

    Applications at Atomic and Sub-Atomic Levels:

    Operating at the cellular level, particularly at the atomic and sub-atomic levels, quantum technology offers highly accurate diagnostic results. Applications at these levels provide unprecedented precision, aiding healthcare service providers and improving patient care. Quantum cryptology and quantum cryptography, utilizing light particles (photons), play a crucial role in data security and protection, ensuring secure transmission of medical data. The stability and prevention of decoding in the quantum state make these techniques highly reliable and efficient for various healthcare applications.

    Magnetic Resonance Imaging (MRI) and Quantum Properties:

    Quantum properties are integral to magnetic resonance imaging (MRI), a widely used diagnostic tool. Quantum technology enhances the understanding of the patient's body at the atomic and sub-atomic levels, providing reliable and accurate data. High-quality images generated through these techniques enable healthcare providers to identify biomarkers or chemicals associated with neurological disorders and cancers.

    Initiatives and Investments in Quantum Technology:

    The UK government's formation of Qymru, a quantum technology network in Wales, signifies the commitment to contribute significantly to quantum technology. Quantum technology comprises computing, communication, imaging, and sensors, with quantum sensors anticipated to bring revolutionary transformations across various industry verticals, including automotive, transportation and logistics, and healthcare.

    European Region's Investment Plans:

    In the European region, plans to increase investments in quantum technology are underway. For example, the University of Birmingham has invested approximately USD 103 million (80 million pounds) in developing the UK Quantum Technology Hub for sensors and metrology. This investment aims to facilitate the use of quantum technology by vendors to create next-generation sensors for magnetic fields, rotation, terahertz (THz) radiation, quantum light, time, and gravity sensors, catering to diverse end-use applications.

    As quantum technology continues to advance, its applications in healthcare and other industries are poised to redefine precision, data security, and diagnostic capabilities, offering transformative benefits and shaping the future of technology.

    Author
    Aarti Dhapte
    Team Lead - Research

    She holds an experience of about 6+ years in Market Research and Business Consulting, working under the spectrum of Information Communication Technology, Telecommunications and Semiconductor domains. Aarti conceptualizes and implements a scalable business strategy and provides strategic leadership to the clients. Her expertise lies in market estimation, competitive intelligence, pipeline analysis, customer assessment, etc.

    Leave a Comment

    FAQs

    What is the projected market valuation for the Quantum Sensors Market in 2035?

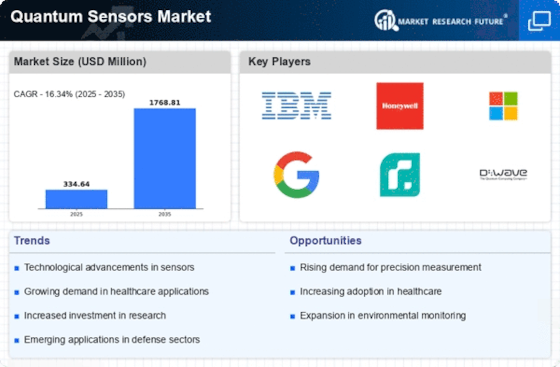
    The projected market valuation for the Quantum Sensors Market in 2035 is 1,768.81 USD Million.

    What was the overall market valuation for the Quantum Sensors Market in 2024?

    The overall market valuation for the Quantum Sensors Market in 2024 was 334.64 USD Million.

    What is the expected CAGR for the Quantum Sensors Market during the forecast period 2025 - 2035?

    The expected CAGR for the Quantum Sensors Market during the forecast period 2025 - 2035 is 16.34%.

    Which companies are considered key players in the Quantum Sensors Market?

    Key players in the Quantum Sensors Market include IBM, Honeywell, Microsoft, Google, and Rigetti Computing.

    What are the projected revenue ranges for Magnetic Sensors in the Quantum Sensors Market?

    The projected revenue range for Magnetic Sensors in the Quantum Sensors Market is between 70.0 and 350.0 USD Million.

    How does the revenue for Healthcare compare to other verticals in the Quantum Sensors Market?

    The revenue for Healthcare in the Quantum Sensors Market is projected to range from 80.0 to 400.0 USD Million, indicating a strong position among verticals.

    Market Summary

    As per MRFR analysis, the Quantum Sensors Market Size was estimated at 334.64 USD Million in 2024. The Quantum Sensors industry is projected to grow from 389.33 USD Million in 2025 to 1768.81 USD Million by 2035, exhibiting a compound annual growth rate (CAGR) of 16.34 during the forecast period 2025 - 2035.

    Key Market Trends & Highlights

    The Quantum Sensors Market is poised for substantial growth driven by technological advancements and increasing applications across various sectors.

    • Technological advancements are propelling the development of quantum sensors, enhancing their precision and functionality.
    • The healthcare sector is witnessing increased adoption of quantum sensors for improved diagnostic and monitoring capabilities.
    • Hybrid solutions are gaining traction, combining quantum sensors with traditional technologies to optimize performance.
    • Growing demand for precision measurement and advancements in quantum technology are driving the market, particularly in North America and the Asia-Pacific region, with atomic clocks leading in size and military & defense applications emerging as the fastest-growing segment.

    Market Size & Forecast

    2024 Market Size 334.64 (USD Million)
    2035 Market Size 1768.81 (USD Million)
    CAGR (2025 - 2035) 16.34%
    Largest Regional Market Share in 2024 Europe

    Major Players

    <p>IBM (US), Honeywell (US), Microsoft (US), Google (US), Rigetti Computing (US), D-Wave Systems (CA), QinetiQ (GB), Toshiba (JP), NIST (US), Xanadu (CA)</p>

    Market Trends

    The Quantum Sensors Market is currently experiencing a transformative phase, driven by advancements in technology and increasing demand across various sectors. These sensors, which leverage quantum mechanics principles, are becoming integral in fields such as healthcare, telecommunications, and defense. The growing emphasis on precision measurement and enhanced sensitivity is propelling innovations, leading to the development of new applications that were previously unattainable. As industries recognize the potential of quantum sensors, investments in research and development are likely to surge, fostering a competitive landscape that encourages collaboration among key players. Moreover, the integration of quantum sensors into existing systems appears to be a focal point for many organizations. This trend suggests a shift towards hybrid solutions that combine classical and quantum technologies, potentially enhancing overall performance. The increasing awareness of the benefits offered by quantum sensors, such as improved accuracy and reduced operational costs, may further stimulate market growth. As the Quantum Sensors Market evolves, it is poised to redefine measurement standards and open new avenues for innovation across multiple domains.

    Technological Advancements

    Recent innovations in quantum technology are significantly enhancing the capabilities of quantum sensors. These advancements are likely to improve sensitivity and accuracy, making them more appealing for various applications.

    Increased Adoption in Healthcare

    The healthcare sector is increasingly recognizing the potential of quantum sensors for applications such as medical imaging and diagnostics. This trend indicates a growing reliance on advanced measurement techniques to improve patient outcomes.

    Focus on Hybrid Solutions

    There is a noticeable trend towards integrating quantum sensors with traditional technologies. This hybrid approach may offer enhanced performance and broaden the scope of applications, appealing to a wider range of industries.

    Quantum Sensors Market Market Drivers

    Advancements in Quantum Technology

    Recent advancements in quantum technology are propelling the Quantum Sensors Market forward. Innovations in quantum computing and quantum communication are creating new opportunities for sensor development. For example, the integration of quantum entanglement and superposition principles is leading to the creation of highly sensitive sensors that can detect minute changes in environmental conditions. This technological evolution is expected to enhance the performance of quantum sensors, making them more accessible and cost-effective. As a result, the market is likely to witness an influx of new products and applications, further driving growth and adoption across various industries.

    Growing Demand for Precision Measurement

    The Quantum Sensors Market is experiencing a notable surge in demand for precision measurement tools across various sectors. Industries such as aerospace, defense, and telecommunications are increasingly relying on quantum sensors for their unparalleled accuracy and sensitivity. For instance, quantum gravimeters and magnetometers are being utilized to enhance navigation systems and geological surveys. The market for quantum sensors is projected to reach USD 1.5 billion by 2026, reflecting a compound annual growth rate of approximately 25%. This growth is driven by the need for advanced measurement techniques that traditional sensors cannot provide, thereby solidifying the role of quantum sensors in critical applications.

    Integration with Internet of Things (IoT)

    The integration of quantum sensors with the Internet of Things (IoT) is emerging as a transformative trend within the Quantum Sensors Market. This convergence allows for enhanced data collection and analysis, enabling smarter decision-making across various applications. For instance, quantum sensors can provide high-resolution data that, when combined with IoT platforms, can optimize resource management in industries such as agriculture and energy. The potential for real-time monitoring and predictive analytics is likely to drive demand for quantum sensors, as organizations seek to leverage advanced technologies for operational efficiency. This trend is expected to contribute significantly to market growth in the coming years.

    Rising Applications in Environmental Monitoring

    The Quantum Sensors Market is witnessing a rise in applications related to environmental monitoring. Quantum sensors are being employed to measure atmospheric conditions, detect pollutants, and monitor climate change effects with unprecedented accuracy. For example, quantum-based sensors can provide real-time data on greenhouse gas emissions, aiding in regulatory compliance and environmental protection efforts. The increasing awareness of climate change and the need for sustainable practices are driving the adoption of these sensors. As a result, the market for quantum sensors in environmental applications is expected to grow significantly, potentially reaching USD 500 million by 2027.

    Increased Investment in Research and Development

    Investment in research and development is a critical driver for the Quantum Sensors Market. Governments and private entities are allocating substantial funds to explore the potential of quantum technologies. For instance, initiatives aimed at developing quantum networks and enhancing sensor capabilities are gaining traction. In 2025, it is estimated that R&D spending in quantum technologies will exceed USD 2 billion, reflecting a commitment to advancing this field. This influx of capital is likely to accelerate innovation, leading to the introduction of novel quantum sensors that meet the evolving needs of various sectors, including healthcare and environmental monitoring.

    Market Segment Insights

    By Product: Atomic Clocks (Largest) vs. Gravity Sensors (Fastest-Growing)

    <p>In the Quantum Sensors Market, the distribution of market share among the product segments reveals that Atomic Clocks command the largest share, primarily due to their established applications in telecommunications and global positioning systems. Meanwhile, Gravity Sensors are experiencing rapid growth, driven by increasing demand in geological and geophysical applications, which is reshaping their market position as a critical player in various industries.</p>

    <p>Atomic Clocks (Dominant) vs. Gravity Sensors (Emerging)</p>

    <p>Atomic Clocks stand as the dominant force in the Quantum Sensors Market, renowned for their precision in timekeeping and synchronization. They are widely utilized in navigation systems, telecommunications, and scientific research, offering unparalleled accuracy that is essential for GPS and network operations. Conversely, Gravity Sensors are emerging in prominence, fueled by advancements in sensor technology and increasing application in fields such as oil and gas exploration, environmental monitoring, and archaeology. Their ability to detect minute changes in gravitational fields makes them invaluable for analyzing subsurface structures and resources, indicating a promising trajectory for future growth.</p>

    By Vertical: Oil & Gas (Largest) vs. Military & Defense (Fastest-Growing)

    <p>In the Quantum Sensors Market, the vertical segment reflects a diverse distribution among various industries. The Oil & Gas sector holds the largest share, driven by the need for advanced sensing technologies in exploration and production processes. In contrast, Military & Defense showcases a growing interest, leveraging quantum sensors for applications such as navigation and surveillance. This disparity highlights the unique needs and adoption rates across different verticals in the market.</p>

    <p>Oil & Gas: Dominant vs. Military & Defense: Emerging</p>

    <p>The Oil & Gas sector remains a dominant player in the Quantum Sensors Market due to its ongoing investment in high-precision exploration technologies, crucial for maximizing resource extraction efficiency. Quantum sensors enable enhanced measurements of gravitational fields and magnetic anomalies, leading to improved decision-making in drilling and reservoir management. Meanwhile, the Military & Defense sector is emerging as a significant force, utilizing quantum sensing for strategic applications like secure communications and advanced navigational aids. The rapid advancements in quantum technology provide this sector with unique capabilities, making it a major player in the market’s future.</p>

    Get more detailed insights about Quantum Sensors Market Research Report- Forecast till 2035

    Regional Insights

    North America : Innovation and Leadership Hub

    North America is the largest market for quantum sensors, holding approximately 45% of the global share. The region's growth is driven by significant investments in research and development, particularly from government agencies and private sector leaders. Regulatory support, such as funding initiatives from the National Institute of Standards and Technology (NIST), further catalyzes market expansion. The demand for advanced sensing technologies in sectors like defense, healthcare, and telecommunications is also on the rise. The United States leads the market, with key players like IBM, Google, and Honeywell spearheading innovation. Canada follows closely, with companies like D-Wave Systems and Xanadu contributing to the competitive landscape. The presence of these major players fosters a robust ecosystem for quantum technology development, ensuring that North America remains at the forefront of the quantum sensors market.

    Europe : Emerging Quantum Ecosystem

    Europe is witnessing a rapid growth in the quantum sensors market, holding approximately 30% of the global share. The region benefits from strong governmental support and collaborative initiatives, such as the Quantum Flagship program, which aims to accelerate quantum technology development. Countries like Germany and the UK are at the forefront, driving demand through investments in quantum research and applications in various industries, including automotive and healthcare. Germany is a leading player, with companies like QinetiQ and significant academic contributions from institutions. The UK also plays a crucial role, with initiatives from universities and startups focusing on quantum technologies. The competitive landscape is characterized by a mix of established firms and innovative startups, fostering a vibrant ecosystem for quantum advancements.

    Asia-Pacific : Rapidly Growing Market

    Asia-Pacific is emerging as a significant player in the quantum sensors market, accounting for approximately 20% of the global share. The region's growth is fueled by increasing investments in quantum research and development, particularly in countries like China and Japan. Government initiatives aimed at fostering innovation and collaboration in quantum technologies are also key drivers of market expansion, with a focus on applications in telecommunications and environmental monitoring. China is leading the charge, with substantial funding for quantum research and development, while Japan is home to companies like Toshiba that are advancing quantum sensor technologies. The competitive landscape is evolving, with both government-backed initiatives and private sector investments shaping the future of quantum sensors in the region, ensuring a dynamic market environment.

    Middle East and Africa : Emerging Technology Frontier

    The Middle East and Africa region is in the nascent stages of developing its quantum sensors market, currently holding about 5% of the global share. Growth is driven by increasing interest in advanced technologies and government initiatives aimed at diversifying economies. Countries like the UAE are investing in technology sectors, including quantum research, to enhance their global competitiveness and innovation capabilities. While the market is still developing, there is a growing recognition of the potential applications of quantum sensors in sectors such as oil and gas, healthcare, and environmental monitoring. The competitive landscape is characterized by emerging startups and collaborations with international firms, indicating a promising future for quantum technology in the region.

    Key Players and Competitive Insights

    The Quantum Sensors Market is currently characterized by a dynamic competitive landscape, driven by rapid technological advancements and increasing demand across various sectors, including telecommunications, healthcare, and defense. Key players such as IBM (US), Honeywell (US), and Google (US) are at the forefront, leveraging their extensive research capabilities and innovative technologies to enhance their market positioning. IBM (US) focuses on integrating quantum computing with sensor technology, aiming to develop solutions that can significantly improve data accuracy and processing speed. Meanwhile, Honeywell (US) emphasizes partnerships and collaborations to expand its product offerings and enhance its operational capabilities, particularly in industrial applications. Google (US) continues to invest heavily in research and development, seeking to pioneer new quantum sensing technologies that could redefine industry standards. Collectively, these strategies contribute to a competitive environment that is increasingly centered on innovation and technological advancement.

    In terms of business tactics, companies are increasingly localizing manufacturing and optimizing supply chains to enhance efficiency and reduce costs. The Quantum Sensors Market appears moderately fragmented, with a mix of established players and emerging startups. This structure allows for a diverse range of products and services, fostering competition that drives innovation. The collective influence of key players is significant, as they not only set industry standards but also shape consumer expectations through their technological advancements.

    In August 2025, IBM (US) announced the launch of its new quantum sensor platform, which integrates advanced machine learning algorithms to enhance sensor accuracy. This strategic move is pivotal as it positions IBM to capture a larger share of the market by offering cutting-edge solutions that address the growing need for precision in various applications, from environmental monitoring to healthcare diagnostics. The integration of AI with quantum sensing technology could potentially revolutionize data analysis and interpretation, providing IBM with a competitive edge.

    In September 2025, Honeywell (US) entered into a strategic partnership with a leading aerospace company to develop quantum sensors specifically designed for navigation and positioning systems. This collaboration is significant as it not only expands Honeywell's product portfolio but also enhances its credibility in the aerospace sector, which is increasingly adopting advanced technologies for improved operational efficiency. The partnership underscores Honeywell's commitment to leveraging strategic alliances to drive innovation and market penetration.

    In October 2025, Google (US) unveiled its latest quantum sensor prototype, which reportedly achieves unprecedented sensitivity levels. This development is crucial as it positions Google as a leader in the quantum sensing space, potentially opening new avenues for applications in fields such as telecommunications and environmental science. The emphasis on sensitivity and accuracy reflects a broader trend in the industry, where companies are striving to push the boundaries of what is technologically possible.

    As of October 2025, the competitive trends in the Quantum Sensors Market are increasingly defined by digitalization, sustainability, and the integration of artificial intelligence. Strategic alliances are becoming more prevalent, as companies recognize the value of collaboration in driving innovation and expanding market reach. Looking ahead, competitive differentiation is likely to evolve, shifting from traditional price-based competition to a focus on technological innovation, reliability in supply chains, and the ability to deliver sustainable solutions. This transition may redefine the competitive landscape, compelling companies to continuously adapt and innovate to maintain their market positions.

    Key Companies in the Quantum Sensors Market market include

    Industry Developments

    • Q2 2024: Qnami Raises CHF 5 Million in Series B Funding to Accelerate Quantum Sensing Technology Qnami, a Swiss quantum technology company, announced it has raised CHF 5 million in Series B funding to expand its quantum sensing product portfolio and accelerate commercialization efforts.
    • Q2 2024: Qnami and Zurich Instruments Announce Strategic Partnership to Advance Quantum Sensing Solutions Qnami and Zurich Instruments have entered a strategic partnership to jointly develop and market advanced quantum sensing solutions, combining Qnami’s quantum sensor technology with Zurich Instruments’ control electronics.
    • Q2 2024: Infleqtion Opens New Quantum Technology Facility in the UK Infleqtion, a quantum technology company, opened a new facility in Oxfordshire, UK, dedicated to the development and manufacturing of quantum sensors for navigation and timing applications.
    • Q2 2024: Q-CTRL Raises $25 Million Series B to Expand Quantum Sensing and Control Products Q-CTRL, an Australian quantum technology startup, secured $25 million in Series B funding to accelerate the development and commercialization of its quantum sensing and control products.
    • Q1 2024: Honeywell Launches New Quantum Accelerometer for Precision Navigation Honeywell announced the launch of a new quantum accelerometer designed for precision navigation in environments where GPS is unavailable, targeting aerospace and defense markets.
    • Q1 2024: QuSpin Secures $10 Million in Series A Funding to Scale Quantum Magnetometer Production QuSpin, a US-based quantum sensor company, raised $10 million in Series A funding to scale up production of its quantum magnetometers for medical imaging and geophysical exploration.
    • Q1 2024: Quantum Diamond Technologies Appoints New CEO to Drive Commercial Expansion Quantum Diamond Technologies, a developer of quantum sensors for biomedical applications, appointed Dr. Jane Smith as CEO to lead the company’s commercial expansion and product development.
    • Q2 2024: UK Government Awards £15 Million Contract to Consortium for Quantum Gravity Sensor Development A UK government consortium led by Teledyne e2v was awarded a £15 million contract to develop quantum gravity sensors for infrastructure monitoring and geophysical applications.
    • Q2 2024: Muquans Acquired by iXblue to Strengthen Quantum Sensing Portfolio iXblue, a French high-tech company, acquired Muquans, a specialist in quantum sensors, to enhance its portfolio of quantum gravimeters and atomic clocks for navigation and scientific research.
    • Q1 2024: ColdQuanta Rebrands as Infleqtion and Launches Quantum RF Sensor ColdQuanta announced its rebranding to Infleqtion and launched a new quantum RF sensor aimed at defense and communications markets.
    • Q2 2024: Quantum Sensors Startup SBQuantum Raises $8 Million in Seed Funding SBQuantum, a Canadian startup developing diamond-based quantum magnetometers, raised $8 million in seed funding to advance product development and expand its team.
    • Q1 2024: AOSense Wins NASA Contract for Space-Based Quantum Sensor Development AOSense, a US-based quantum sensor company, was awarded a contract by NASA to develop space-based quantum sensors for Earth observation and navigation missions.

    Future Outlook

    Quantum Sensors Market Future Outlook

    <p>The Quantum Sensors Market is projected to grow at a 16.34% CAGR from 2024 to 2035, driven by advancements in technology, increased demand for precision measurement, and applications in various industries.</p>

    New opportunities lie in:

    • <p>Development of quantum-enhanced imaging systems for medical diagnostics.</p>
    • <p>Integration of quantum sensors in autonomous vehicle navigation systems.</p>
    • <p>Creation of portable quantum sensors for environmental monitoring and data collection.</p>

    <p>By 2035, the Quantum Sensors Market is expected to achieve substantial growth, solidifying its role in various sectors.</p>

    Market Segmentation

    Quantum Sensors Market Product Outlook

    • Atomic Clocks
    • Photosynthetically Active Radiation (PAR)
    • Gravity Sensors
    • Magnetic Sensors
    • Quantum Sensors

    Quantum Sensors Market Vertical Outlook

    • Oil & Gas
    • Military & Defense
    • Automotive
    • Healthcare
    • Agriculture

    Report Scope

    MARKET SIZE 2024334.64(USD Million)
    MARKET SIZE 2025389.33(USD Million)
    MARKET SIZE 20351768.81(USD Million)
    COMPOUND ANNUAL GROWTH RATE (CAGR)16.34% (2024 - 2035)
    REPORT COVERAGERevenue Forecast, Competitive Landscape, Growth Factors, and Trends
    BASE YEAR2024
    Market Forecast Period2025 - 2035
    Historical Data2019 - 2024
    Market Forecast UnitsUSD Million
    Key Companies ProfiledMarket analysis in progress
    Segments CoveredMarket segmentation analysis in progress
    Key Market OpportunitiesAdvancements in quantum technology enhance precision measurement capabilities in the Quantum Sensors Market.
    Key Market DynamicsTechnological advancements drive competitive forces, enhancing performance and applications of quantum sensors across various industries.
    Countries CoveredNorth America, Europe, APAC, South America, MEA

    FAQs

    What is the projected market valuation for the Quantum Sensors Market in 2035?

    The projected market valuation for the Quantum Sensors Market in 2035 is 1,768.81 USD Million.

    What was the overall market valuation for the Quantum Sensors Market in 2024?

    The overall market valuation for the Quantum Sensors Market in 2024 was 334.64 USD Million.

    What is the expected CAGR for the Quantum Sensors Market during the forecast period 2025 - 2035?

    The expected CAGR for the Quantum Sensors Market during the forecast period 2025 - 2035 is 16.34%.

    Which companies are considered key players in the Quantum Sensors Market?

    Key players in the Quantum Sensors Market include IBM, Honeywell, Microsoft, Google, and Rigetti Computing.

    What are the projected revenue ranges for Magnetic Sensors in the Quantum Sensors Market?

    The projected revenue range for Magnetic Sensors in the Quantum Sensors Market is between 70.0 and 350.0 USD Million.

    How does the revenue for Healthcare compare to other verticals in the Quantum Sensors Market?

    The revenue for Healthcare in the Quantum Sensors Market is projected to range from 80.0 to 400.0 USD Million, indicating a strong position among verticals.

    1. SECTION I: EXECUTIVE SUMMARY AND KEY HIGHLIGHTS
      1. | 1.1 EXECUTIVE SUMMARY
      2. | | 1.1.1 Market Overview
      3. | | 1.1.2 Key Findings
      4. | | 1.1.3 Market Segmentation
      5. | | 1.1.4 Competitive Landscape
      6. | | 1.1.5 Challenges and Opportunities
      7. | | 1.1.6 Future Outlook
    2. SECTION II: SCOPING, METHODOLOGY AND MARKET STRUCTURE
      1. | 2.1 MARKET INTRODUCTION
      2. | | 2.1.1 Definition
      3. | | 2.1.2 Scope of the study
      4. | | | 2.1.2.1 Research Objective
      5. | | | 2.1.2.2 Assumption
      6. | | | 2.1.2.3 Limitations
      7. | 2.2 RESEARCH METHODOLOGY
      8. | | 2.2.1 Overview
      9. | | 2.2.2 Data Mining
      10. | | 2.2.3 Secondary Research
      11. | | 2.2.4 Primary Research
      12. | | | 2.2.4.1 Primary Interviews and Information Gathering Process
      13. | | | 2.2.4.2 Breakdown of Primary Respondents
      14. | | 2.2.5 Forecasting Model
      15. | | 2.2.6 Market Size Estimation
      16. | | | 2.2.6.1 Bottom-Up Approach
      17. | | | 2.2.6.2 Top-Down Approach
      18. | | 2.2.7 Data Triangulation
      19. | | 2.2.8 Validation
    3. SECTION III: QUALITATIVE ANALYSIS
      1. | 3.1 MARKET DYNAMICS
      2. | | 3.1.1 Overview
      3. | | 3.1.2 Drivers
      4. | | 3.1.3 Restraints
      5. | | 3.1.4 Opportunities
      6. | 3.2 MARKET FACTOR ANALYSIS
      7. | | 3.2.1 Value chain Analysis
      8. | | 3.2.2 Porter's Five Forces Analysis
      9. | | | 3.2.2.1 Bargaining Power of Suppliers
      10. | | | 3.2.2.2 Bargaining Power of Buyers
      11. | | | 3.2.2.3 Threat of New Entrants
      12. | | | 3.2.2.4 Threat of Substitutes
      13. | | | 3.2.2.5 Intensity of Rivalry
      14. | | 3.2.3 COVID-19 Impact Analysis
      15. | | | 3.2.3.1 Market Impact Analysis
      16. | | | 3.2.3.2 Regional Impact
      17. | | | 3.2.3.3 Opportunity and Threat Analysis
    4. SECTION IV: QUANTITATIVE ANALYSIS
      1. | 4.1 Semiconductor & Electronics, BY Product (USD Million)
      2. | | 4.1.1 Atomic Clocks
      3. | | 4.1.2 Photosynthetically Active Radiation (PAR)
      4. | | 4.1.3 Gravity Sensors
      5. | | 4.1.4 Magnetic Sensors
      6. | | 4.1.5 Quantum Sensors
      7. | 4.2 Semiconductor & Electronics, BY Vertical (USD Million)
      8. | | 4.2.1 Oil & Gas
      9. | | 4.2.2 Military & Defense
      10. | | 4.2.3 Automotive
      11. | | 4.2.4 Healthcare
      12. | | 4.2.5 Agriculture
      13. | 4.3 Semiconductor & Electronics, BY Region (USD Million)
      14. | | 4.3.1 North America
      15. | | | 4.3.1.1 US
      16. | | | 4.3.1.2 Canada
      17. | | 4.3.2 Europe
      18. | | | 4.3.2.1 Germany
      19. | | | 4.3.2.2 UK
      20. | | | 4.3.2.3 France
      21. | | | 4.3.2.4 Russia
      22. | | | 4.3.2.5 Italy
      23. | | | 4.3.2.6 Spain
      24. | | | 4.3.2.7 Rest of Europe
      25. | | 4.3.3 APAC
      26. | | | 4.3.3.1 China
      27. | | | 4.3.3.2 India
      28. | | | 4.3.3.3 Japan
      29. | | | 4.3.3.4 South Korea
      30. | | | 4.3.3.5 Malaysia
      31. | | | 4.3.3.6 Thailand
      32. | | | 4.3.3.7 Indonesia
      33. | | | 4.3.3.8 Rest of APAC
      34. | | 4.3.4 South America
      35. | | | 4.3.4.1 Brazil
      36. | | | 4.3.4.2 Mexico
      37. | | | 4.3.4.3 Argentina
      38. | | | 4.3.4.4 Rest of South America
      39. | | 4.3.5 MEA
      40. | | | 4.3.5.1 GCC Countries
      41. | | | 4.3.5.2 South Africa
      42. | | | 4.3.5.3 Rest of MEA
    5. SECTION V: COMPETITIVE ANALYSIS
      1. | 5.1 Competitive Landscape
      2. | | 5.1.1 Overview
      3. | | 5.1.2 Competitive Analysis
      4. | | 5.1.3 Market share Analysis
      5. | | 5.1.4 Major Growth Strategy in the Semiconductor & Electronics
      6. | | 5.1.5 Competitive Benchmarking
      7. | | 5.1.6 Leading Players in Terms of Number of Developments in the Semiconductor & Electronics
      8. | | 5.1.7 Key developments and growth strategies
      9. | | | 5.1.7.1 New Product Launch/Service Deployment
      10. | | | 5.1.7.2 Merger & Acquisitions
      11. | | | 5.1.7.3 Joint Ventures
      12. | | 5.1.8 Major Players Financial Matrix
      13. | | | 5.1.8.1 Sales and Operating Income
      14. | | | 5.1.8.2 Major Players R&D Expenditure. 2023
      15. | 5.2 Company Profiles
      16. | | 5.2.1 IBM (US)
      17. | | | 5.2.1.1 Financial Overview
      18. | | | 5.2.1.2 Products Offered
      19. | | | 5.2.1.3 Key Developments
      20. | | | 5.2.1.4 SWOT Analysis
      21. | | | 5.2.1.5 Key Strategies
      22. | | 5.2.2 Honeywell (US)
      23. | | | 5.2.2.1 Financial Overview
      24. | | | 5.2.2.2 Products Offered
      25. | | | 5.2.2.3 Key Developments
      26. | | | 5.2.2.4 SWOT Analysis
      27. | | | 5.2.2.5 Key Strategies
      28. | | 5.2.3 Microsoft (US)
      29. | | | 5.2.3.1 Financial Overview
      30. | | | 5.2.3.2 Products Offered
      31. | | | 5.2.3.3 Key Developments
      32. | | | 5.2.3.4 SWOT Analysis
      33. | | | 5.2.3.5 Key Strategies
      34. | | 5.2.4 Google (US)
      35. | | | 5.2.4.1 Financial Overview
      36. | | | 5.2.4.2 Products Offered
      37. | | | 5.2.4.3 Key Developments
      38. | | | 5.2.4.4 SWOT Analysis
      39. | | | 5.2.4.5 Key Strategies
      40. | | 5.2.5 Rigetti Computing (US)
      41. | | | 5.2.5.1 Financial Overview
      42. | | | 5.2.5.2 Products Offered
      43. | | | 5.2.5.3 Key Developments
      44. | | | 5.2.5.4 SWOT Analysis
      45. | | | 5.2.5.5 Key Strategies
      46. | | 5.2.6 D-Wave Systems (CA)
      47. | | | 5.2.6.1 Financial Overview
      48. | | | 5.2.6.2 Products Offered
      49. | | | 5.2.6.3 Key Developments
      50. | | | 5.2.6.4 SWOT Analysis
      51. | | | 5.2.6.5 Key Strategies
      52. | | 5.2.7 QinetiQ (GB)
      53. | | | 5.2.7.1 Financial Overview
      54. | | | 5.2.7.2 Products Offered
      55. | | | 5.2.7.3 Key Developments
      56. | | | 5.2.7.4 SWOT Analysis
      57. | | | 5.2.7.5 Key Strategies
      58. | | 5.2.8 Toshiba (JP)
      59. | | | 5.2.8.1 Financial Overview
      60. | | | 5.2.8.2 Products Offered
      61. | | | 5.2.8.3 Key Developments
      62. | | | 5.2.8.4 SWOT Analysis
      63. | | | 5.2.8.5 Key Strategies
      64. | | 5.2.9 NIST (US)
      65. | | | 5.2.9.1 Financial Overview
      66. | | | 5.2.9.2 Products Offered
      67. | | | 5.2.9.3 Key Developments
      68. | | | 5.2.9.4 SWOT Analysis
      69. | | | 5.2.9.5 Key Strategies
      70. | | 5.2.10 Xanadu (CA)
      71. | | | 5.2.10.1 Financial Overview
      72. | | | 5.2.10.2 Products Offered
      73. | | | 5.2.10.3 Key Developments
      74. | | | 5.2.10.4 SWOT Analysis
      75. | | | 5.2.10.5 Key Strategies
      76. | 5.3 Appendix
      77. | | 5.3.1 References
      78. | | 5.3.2 Related Reports
    6. LIST OF FIGURES
      1. | 6.1 MARKET SYNOPSIS
      2. | 6.2 NORTH AMERICA MARKET ANALYSIS
      3. | 6.3 US MARKET ANALYSIS BY PRODUCT
      4. | 6.4 US MARKET ANALYSIS BY VERTICAL
      5. | 6.5 CANADA MARKET ANALYSIS BY PRODUCT
      6. | 6.6 CANADA MARKET ANALYSIS BY VERTICAL
      7. | 6.7 EUROPE MARKET ANALYSIS
      8. | 6.8 GERMANY MARKET ANALYSIS BY PRODUCT
      9. | 6.9 GERMANY MARKET ANALYSIS BY VERTICAL
      10. | 6.10 UK MARKET ANALYSIS BY PRODUCT
      11. | 6.11 UK MARKET ANALYSIS BY VERTICAL
      12. | 6.12 FRANCE MARKET ANALYSIS BY PRODUCT
      13. | 6.13 FRANCE MARKET ANALYSIS BY VERTICAL
      14. | 6.14 RUSSIA MARKET ANALYSIS BY PRODUCT
      15. | 6.15 RUSSIA MARKET ANALYSIS BY VERTICAL
      16. | 6.16 ITALY MARKET ANALYSIS BY PRODUCT
      17. | 6.17 ITALY MARKET ANALYSIS BY VERTICAL
      18. | 6.18 SPAIN MARKET ANALYSIS BY PRODUCT
      19. | 6.19 SPAIN MARKET ANALYSIS BY VERTICAL
      20. | 6.20 REST OF EUROPE MARKET ANALYSIS BY PRODUCT
      21. | 6.21 REST OF EUROPE MARKET ANALYSIS BY VERTICAL
      22. | 6.22 APAC MARKET ANALYSIS
      23. | 6.23 CHINA MARKET ANALYSIS BY PRODUCT
      24. | 6.24 CHINA MARKET ANALYSIS BY VERTICAL
      25. | 6.25 INDIA MARKET ANALYSIS BY PRODUCT
      26. | 6.26 INDIA MARKET ANALYSIS BY VERTICAL
      27. | 6.27 JAPAN MARKET ANALYSIS BY PRODUCT
      28. | 6.28 JAPAN MARKET ANALYSIS BY VERTICAL
      29. | 6.29 SOUTH KOREA MARKET ANALYSIS BY PRODUCT
      30. | 6.30 SOUTH KOREA MARKET ANALYSIS BY VERTICAL
      31. | 6.31 MALAYSIA MARKET ANALYSIS BY PRODUCT
      32. | 6.32 MALAYSIA MARKET ANALYSIS BY VERTICAL
      33. | 6.33 THAILAND MARKET ANALYSIS BY PRODUCT
      34. | 6.34 THAILAND MARKET ANALYSIS BY VERTICAL
      35. | 6.35 INDONESIA MARKET ANALYSIS BY PRODUCT
      36. | 6.36 INDONESIA MARKET ANALYSIS BY VERTICAL
      37. | 6.37 REST OF APAC MARKET ANALYSIS BY PRODUCT
      38. | 6.38 REST OF APAC MARKET ANALYSIS BY VERTICAL
      39. | 6.39 SOUTH AMERICA MARKET ANALYSIS
      40. | 6.40 BRAZIL MARKET ANALYSIS BY PRODUCT
      41. | 6.41 BRAZIL MARKET ANALYSIS BY VERTICAL
      42. | 6.42 MEXICO MARKET ANALYSIS BY PRODUCT
      43. | 6.43 MEXICO MARKET ANALYSIS BY VERTICAL
      44. | 6.44 ARGENTINA MARKET ANALYSIS BY PRODUCT
      45. | 6.45 ARGENTINA MARKET ANALYSIS BY VERTICAL
      46. | 6.46 REST OF SOUTH AMERICA MARKET ANALYSIS BY PRODUCT
      47. | 6.47 REST OF SOUTH AMERICA MARKET ANALYSIS BY VERTICAL
      48. | 6.48 MEA MARKET ANALYSIS
      49. | 6.49 GCC COUNTRIES MARKET ANALYSIS BY PRODUCT
      50. | 6.50 GCC COUNTRIES MARKET ANALYSIS BY VERTICAL
      51. | 6.51 SOUTH AFRICA MARKET ANALYSIS BY PRODUCT
      52. | 6.52 SOUTH AFRICA MARKET ANALYSIS BY VERTICAL
      53. | 6.53 REST OF MEA MARKET ANALYSIS BY PRODUCT
      54. | 6.54 REST OF MEA MARKET ANALYSIS BY VERTICAL
      55. | 6.55 KEY BUYING CRITERIA OF SEMICONDUCTOR & ELECTRONICS
      56. | 6.56 RESEARCH PROCESS OF MRFR
      57. | 6.57 DRO ANALYSIS OF SEMICONDUCTOR & ELECTRONICS
      58. | 6.58 DRIVERS IMPACT ANALYSIS: SEMICONDUCTOR & ELECTRONICS
      59. | 6.59 RESTRAINTS IMPACT ANALYSIS: SEMICONDUCTOR & ELECTRONICS
      60. | 6.60 SUPPLY / VALUE CHAIN: SEMICONDUCTOR & ELECTRONICS
      61. | 6.61 SEMICONDUCTOR & ELECTRONICS, BY PRODUCT, 2024 (% SHARE)
      62. | 6.62 SEMICONDUCTOR & ELECTRONICS, BY PRODUCT, 2024 TO 2035 (USD Million)
      63. | 6.63 SEMICONDUCTOR & ELECTRONICS, BY VERTICAL, 2024 (% SHARE)
      64. | 6.64 SEMICONDUCTOR & ELECTRONICS, BY VERTICAL, 2024 TO 2035 (USD Million)
      65. | 6.65 BENCHMARKING OF MAJOR COMPETITORS
    7. LIST OF TABLES
      1. | 7.1 LIST OF ASSUMPTIONS
      2. | | 7.1.1
      3. | 7.2 North America MARKET SIZE ESTIMATES; FORECAST
      4. | | 7.2.1 BY PRODUCT, 2025-2035 (USD Million)
      5. | | 7.2.2 BY VERTICAL, 2025-2035 (USD Million)
      6. | 7.3 US MARKET SIZE ESTIMATES; FORECAST
      7. | | 7.3.1 BY PRODUCT, 2025-2035 (USD Million)
      8. | | 7.3.2 BY VERTICAL, 2025-2035 (USD Million)
      9. | 7.4 Canada MARKET SIZE ESTIMATES; FORECAST
      10. | | 7.4.1 BY PRODUCT, 2025-2035 (USD Million)
      11. | | 7.4.2 BY VERTICAL, 2025-2035 (USD Million)
      12. | 7.5 Europe MARKET SIZE ESTIMATES; FORECAST
      13. | | 7.5.1 BY PRODUCT, 2025-2035 (USD Million)
      14. | | 7.5.2 BY VERTICAL, 2025-2035 (USD Million)
      15. | 7.6 Germany MARKET SIZE ESTIMATES; FORECAST
      16. | | 7.6.1 BY PRODUCT, 2025-2035 (USD Million)
      17. | | 7.6.2 BY VERTICAL, 2025-2035 (USD Million)
      18. | 7.7 UK MARKET SIZE ESTIMATES; FORECAST
      19. | | 7.7.1 BY PRODUCT, 2025-2035 (USD Million)
      20. | | 7.7.2 BY VERTICAL, 2025-2035 (USD Million)
      21. | 7.8 France MARKET SIZE ESTIMATES; FORECAST
      22. | | 7.8.1 BY PRODUCT, 2025-2035 (USD Million)
      23. | | 7.8.2 BY VERTICAL, 2025-2035 (USD Million)
      24. | 7.9 Russia MARKET SIZE ESTIMATES; FORECAST
      25. | | 7.9.1 BY PRODUCT, 2025-2035 (USD Million)
      26. | | 7.9.2 BY VERTICAL, 2025-2035 (USD Million)
      27. | 7.10 Italy MARKET SIZE ESTIMATES; FORECAST
      28. | | 7.10.1 BY PRODUCT, 2025-2035 (USD Million)
      29. | | 7.10.2 BY VERTICAL, 2025-2035 (USD Million)
      30. | 7.11 Spain MARKET SIZE ESTIMATES; FORECAST
      31. | | 7.11.1 BY PRODUCT, 2025-2035 (USD Million)
      32. | | 7.11.2 BY VERTICAL, 2025-2035 (USD Million)
      33. | 7.12 Rest of Europe MARKET SIZE ESTIMATES; FORECAST
      34. | | 7.12.1 BY PRODUCT, 2025-2035 (USD Million)
      35. | | 7.12.2 BY VERTICAL, 2025-2035 (USD Million)
      36. | 7.13 APAC MARKET SIZE ESTIMATES; FORECAST
      37. | | 7.13.1 BY PRODUCT, 2025-2035 (USD Million)
      38. | | 7.13.2 BY VERTICAL, 2025-2035 (USD Million)
      39. | 7.14 China MARKET SIZE ESTIMATES; FORECAST
      40. | | 7.14.1 BY PRODUCT, 2025-2035 (USD Million)
      41. | | 7.14.2 BY VERTICAL, 2025-2035 (USD Million)
      42. | 7.15 India MARKET SIZE ESTIMATES; FORECAST
      43. | | 7.15.1 BY PRODUCT, 2025-2035 (USD Million)
      44. | | 7.15.2 BY VERTICAL, 2025-2035 (USD Million)
      45. | 7.16 Japan MARKET SIZE ESTIMATES; FORECAST
      46. | | 7.16.1 BY PRODUCT, 2025-2035 (USD Million)
      47. | | 7.16.2 BY VERTICAL, 2025-2035 (USD Million)
      48. | 7.17 South Korea MARKET SIZE ESTIMATES; FORECAST
      49. | | 7.17.1 BY PRODUCT, 2025-2035 (USD Million)
      50. | | 7.17.2 BY VERTICAL, 2025-2035 (USD Million)
      51. | 7.18 Malaysia MARKET SIZE ESTIMATES; FORECAST
      52. | | 7.18.1 BY PRODUCT, 2025-2035 (USD Million)
      53. | | 7.18.2 BY VERTICAL, 2025-2035 (USD Million)
      54. | 7.19 Thailand MARKET SIZE ESTIMATES; FORECAST
      55. | | 7.19.1 BY PRODUCT, 2025-2035 (USD Million)
      56. | | 7.19.2 BY VERTICAL, 2025-2035 (USD Million)
      57. | 7.20 Indonesia MARKET SIZE ESTIMATES; FORECAST
      58. | | 7.20.1 BY PRODUCT, 2025-2035 (USD Million)
      59. | | 7.20.2 BY VERTICAL, 2025-2035 (USD Million)
      60. | 7.21 Rest of APAC MARKET SIZE ESTIMATES; FORECAST
      61. | | 7.21.1 BY PRODUCT, 2025-2035 (USD Million)
      62. | | 7.21.2 BY VERTICAL, 2025-2035 (USD Million)
      63. | 7.22 South America MARKET SIZE ESTIMATES; FORECAST
      64. | | 7.22.1 BY PRODUCT, 2025-2035 (USD Million)
      65. | | 7.22.2 BY VERTICAL, 2025-2035 (USD Million)
      66. | 7.23 Brazil MARKET SIZE ESTIMATES; FORECAST
      67. | | 7.23.1 BY PRODUCT, 2025-2035 (USD Million)
      68. | | 7.23.2 BY VERTICAL, 2025-2035 (USD Million)
      69. | 7.24 Mexico MARKET SIZE ESTIMATES; FORECAST
      70. | | 7.24.1 BY PRODUCT, 2025-2035 (USD Million)
      71. | | 7.24.2 BY VERTICAL, 2025-2035 (USD Million)
      72. | 7.25 Argentina MARKET SIZE ESTIMATES; FORECAST
      73. | | 7.25.1 BY PRODUCT, 2025-2035 (USD Million)
      74. | | 7.25.2 BY VERTICAL, 2025-2035 (USD Million)
      75. | 7.26 Rest of South America MARKET SIZE ESTIMATES; FORECAST
      76. | | 7.26.1 BY PRODUCT, 2025-2035 (USD Million)
      77. | | 7.26.2 BY VERTICAL, 2025-2035 (USD Million)
      78. | 7.27 MEA MARKET SIZE ESTIMATES; FORECAST
      79. | | 7.27.1 BY PRODUCT, 2025-2035 (USD Million)
      80. | | 7.27.2 BY VERTICAL, 2025-2035 (USD Million)
      81. | 7.28 GCC Countries MARKET SIZE ESTIMATES; FORECAST
      82. | | 7.28.1 BY PRODUCT, 2025-2035 (USD Million)
      83. | | 7.28.2 BY VERTICAL, 2025-2035 (USD Million)
      84. | 7.29 South Africa MARKET SIZE ESTIMATES; FORECAST
      85. | | 7.29.1 BY PRODUCT, 2025-2035 (USD Million)
      86. | | 7.29.2 BY VERTICAL, 2025-2035 (USD Million)
      87. | 7.30 Rest of MEA MARKET SIZE ESTIMATES; FORECAST
      88. | | 7.30.1 BY PRODUCT, 2025-2035 (USD Million)
      89. | | 7.30.2 BY VERTICAL, 2025-2035 (USD Million)
      90. | 7.31 PRODUCT LAUNCH/PRODUCT DEVELOPMENT/APPROVAL
      91. | | 7.31.1
      92. | 7.32 ACQUISITION/PARTNERSHIP
      93. | | 7.32.1

    Quantum Sensors Market Segmentation

    Quantum Sensors Product Outlook (USD Million, 2018-2032)

    Atomic Clocks

    Photosynthetically Active Radiation (PAR)

    Gravity Sensors

    Automotive

    Quantum Sensors

    Quantum Sensors Verticals Outlook (USD Million, 2018-2032)

    Oil & Gas

    Military & Defense

    Automotive

    Healthcare

    Agriculture

    Quantum Sensors Regional Outlook (USD Million, 2018-2032)

    North America Outlook (USD Million, 2018-2032)

    North America Quantum Sensors by Product

    Atomic Clocks

    Photosynthetically Active Radiation (PAR)

    Gravity Sensors

    Magnetic Sensors

    Quantum Sensors

    North America Quantum Sensors by Verticals

    Oil & Gas

    Military & Defense

    Automotive

    Healthcare

    Agriculture

    US Outlook (USD Million, 2018-2032)

    US Quantum Sensors by Product

    Atomic Clocks

    Photosynthetically Active Radiation (PAR)

    Gravity Sensors

    Magnetic Sensors

    Quantum Sensors

    US Quantum Sensors by Verticals

    Oil & Gas

    Military & Defense

    Automotive

    Healthcare

    Agriculture

    CANADA Outlook (USD Million, 2018-2032)

    CANADA Quantum Sensors by Product

    Atomic Clocks

    Photosynthetically Active Radiation (PAR)

    Gravity Sensors

    Magnetic Sensors

    Quantum Sensors

    CANADA Quantum Sensors by Verticals

    Oil & Gas

    Military & Defense

    Automotive

    Healthcare

    Agriculture

    Europe Outlook (USD Million, 2018-2032)

    Europe Quantum Sensors by Product

    Atomic Clocks

    Photosynthetically Active Radiation (PAR)

    Gravity Sensors

    Magnetic Sensors

    Quantum Sensors

    Europe Quantum Sensors by Verticals

    Oil & Gas

    Military & Defense

    Automotive

    Healthcare

    Agriculture

    Germany Outlook (USD Million, 2018-2032)

    Germany Quantum Sensors by Product

    Atomic Clocks

    Photosynthetically Active Radiation (PAR)

    Gravity Sensors

    Magnetic Sensors

    Quantum Sensors

    Germany Quantum Sensors by Verticals

    Oil & Gas

    Military & Defense

    Automotive

    Healthcare

    Agriculture

    France Outlook (USD Million, 2018-2032)

    France Quantum Sensors by Product

    Atomic Clocks

    Photosynthetically Active Radiation (PAR)

    Gravity Sensors

    Magnetic Sensors

    Quantum Sensors

    France Quantum Sensors by Verticals

    Oil & Gas

    Military & Defense

    Automotive

    Healthcare

    Agriculture

    UK Outlook (USD Million, 2018-2032)

    UK Quantum Sensors by Product

    Atomic Clocks

    Photosynthetically Active Radiation (PAR)

    Gravity Sensors

    Magnetic Sensors

    Quantum Sensors

    UK Quantum Sensors by Verticals

    Oil & Gas

    Military & Defense

    Automotive

    Healthcare

    Agriculture

    ITALY Outlook (USD Million, 2018-2032)

    ITALY Quantum Sensors by Product

    Atomic Clocks

    Photosynthetically Active Radiation (PAR)

    Gravity Sensors

    Magnetic Sensors

    Quantum Sensors

    ITALY Quantum Sensors by Verticals

    Oil & Gas

    Military & Defense

    Automotive

    Healthcare

    Agriculture

    SPAIN Outlook (USD Million, 2018-2032)

    Spain Quantum Sensors by Product

    Atomic Clocks

    Photosynthetically Active Radiation (PAR)

    Gravity Sensors

    Magnetic Sensors

    Quantum Sensors

    Spain Quantum Sensors by Verticals

    Oil & Gas

    Military & Defense

    Automotive

    Healthcare

    Agriculture

    Rest Of Europe Outlook (USD Million, 2018-2032)

    Rest Of Europe Quantum Sensors by Product

    Atomic Clocks

    Photosynthetically Active Radiation (PAR)

    Gravity Sensors

    Magnetic Sensors

    Quantum Sensors

    REST OF EUROPE Quantum Sensors by Verticals

    Oil & Gas

    Military & Defense

    Automotive

    Healthcare

    Agriculture

    Asia-Pacific Outlook (USD Million, 2018-2032)

    Asia-Pacific Quantum Sensors by Product

    Atomic Clocks

    Photosynthetically Active Radiation (PAR)

    Gravity Sensors

    Magnetic Sensors

    Quantum Sensors

    Asia-Pacific Quantum Sensors by Verticals

    Oil & Gas

    Military & Defense

    Automotive

    Healthcare

    Agriculture

    China Outlook (USD Million, 2018-2032)

    China Quantum Sensors by Product

    Atomic Clocks

    Photosynthetically Active Radiation (PAR)

    Gravity Sensors

    Magnetic Sensors

    Quantum Sensors

    China Quantum Sensors by Verticals

    Oil & Gas

    Military & Defense

    Automotive

    Healthcare

    Agriculture

    Japan Outlook (USD Million, 2018-2032)

    Japan Quantum Sensors by Product

    Atomic Clocks

    Photosynthetically Active Radiation (PAR)

    Gravity Sensors

    Magnetic Sensors

    Quantum Sensors

    Japan Quantum Sensors by Verticals

    Oil & Gas

    Military & Defense

    Automotive

    Healthcare

    Agriculture

    India Outlook (USD Million, 2018-2032)

    India Quantum Sensors by Product

    Atomic Clocks

    Photosynthetically Active Radiation (PAR)

    Gravity Sensors

    Magnetic Sensors

    Quantum Sensors

    India Quantum Sensors by Verticals

    Oil & Gas

    Military & Defense

    Automotive

    Healthcare

    Agriculture

    Australia Outlook (USD Million, 2018-2032)

    Australia Quantum Sensors by Product

    Atomic Clocks

    Photosynthetically Active Radiation (PAR)

    Gravity Sensors

    Magnetic Sensors

    Quantum Sensors

    Australia Quantum Sensors by Verticals

    Oil & Gas

    Military & Defense

    Automotive

    Healthcare

    Agriculture

    Rest of Asia-Pacific Outlook (USD Million, 2018-2032)

    Rest of Asia-Pacific Quantum Sensors by Product

    Atomic Clocks

    Photosynthetically Active Radiation (PAR)

    Gravity Sensors

    Magnetic Sensors

    Quantum Sensors

    Rest of Asia-Pacific Quantum Sensors by Verticals

    Oil & Gas

    Military & Defense

    Automotive

    Healthcare

    Agriculture

    Rest of the World Outlook (USD Million, 2018-2032)

    Rest of the World Quantum Sensors by Product

    Atomic Clocks

    Photosynthetically Active Radiation (PAR)

    Gravity Sensors

    Magnetic Sensors

    Quantum Sensors

    Rest of the World Quantum Sensors by Verticals

    Oil & Gas

    Military & Defense

    Automotive

    Healthcare

    Agriculture

    Middle East Outlook (USD Million, 2018-2032)

    Middle East Quantum Sensors by Product

    Atomic Clocks

    Photosynthetically Active Radiation (PAR)

    Gravity Sensors

    Automotive

    Middle East Quantum Sensors by Verticals

    Oil & Gas

    Military & Defense

    Automotive

    Middle East Quantum Sensors by Surgery

    Minimally Invasive Spine Surgery

    Open Spine Surgery

    Middle East Quantum Sensors by End User

    Orthopedic Clinics

    Multispecialty Hospitals

    Neurology Clinics

    Automotive

    Africa Outlook (USD Million, 2018-2032)

    Africa Quantum Sensors by Product

    Atomic Clocks

    Photosynthetically Active Radiation (PAR)

    Gravity Sensors

    Automotive

    Africa Quantum Sensors by Verticals

    Oil & Gas

    Military & Defense

    Automotive

    Africa Quantum Sensors by Surgery

    Minimally Invasive Spine Surgery

    Open Spine Surgery

    Africa Quantum Sensors by End User

    Orthopedic Clinics

    Multispecialty Hospitals

    Neurology Clinics

    Automotive

    Latin America Outlook (USD Million, 2018-2032)

    Latin America Quantum Sensors by Product

    Atomic Clocks

    Photosynthetically Active Radiation (PAR)

    Gravity Sensors

    Automotive

    Latin America Quantum Sensors by Verticals

    Oil & Gas

    Military & Defense

    Automotive

    Latin America Quantum Sensors by Surgery

    Minimally Invasive Spine Surgery

    Open Spine Surgery

    Latin America Quantum Sensors by End User

    Orthopedic Clinics

    Multispecialty Hospitals

    Neurology Clinics

    Automotive


    Infographic

    Free Sample Request

    Kindly complete the form below to receive a free sample of this Report

    Get Free Sample

    Customer Strories

    “I am very pleased with how market segments have been defined in a relevant way for my purposes (such as "Portable Freezers & refrigerators" and "last-mile"). In general the report is well structured. Thanks very much for your efforts.”

    Victoria Milne

    Founder
    Case Study
    Chemicals and Materials

    Compare Licence

    ×
    Features License Type
    Single User Multiuser License Enterprise User
    Price $4,950 $5,950 $7,250
    Maximum User Access Limit 1 User Upto 10 Users Unrestricted Access Throughout the Organization
    Free Customization
    Direct Access to Analyst
    Deliverable Format
    Platform Access
    Discount on Next Purchase 10% 15% 15%
    Printable Versions