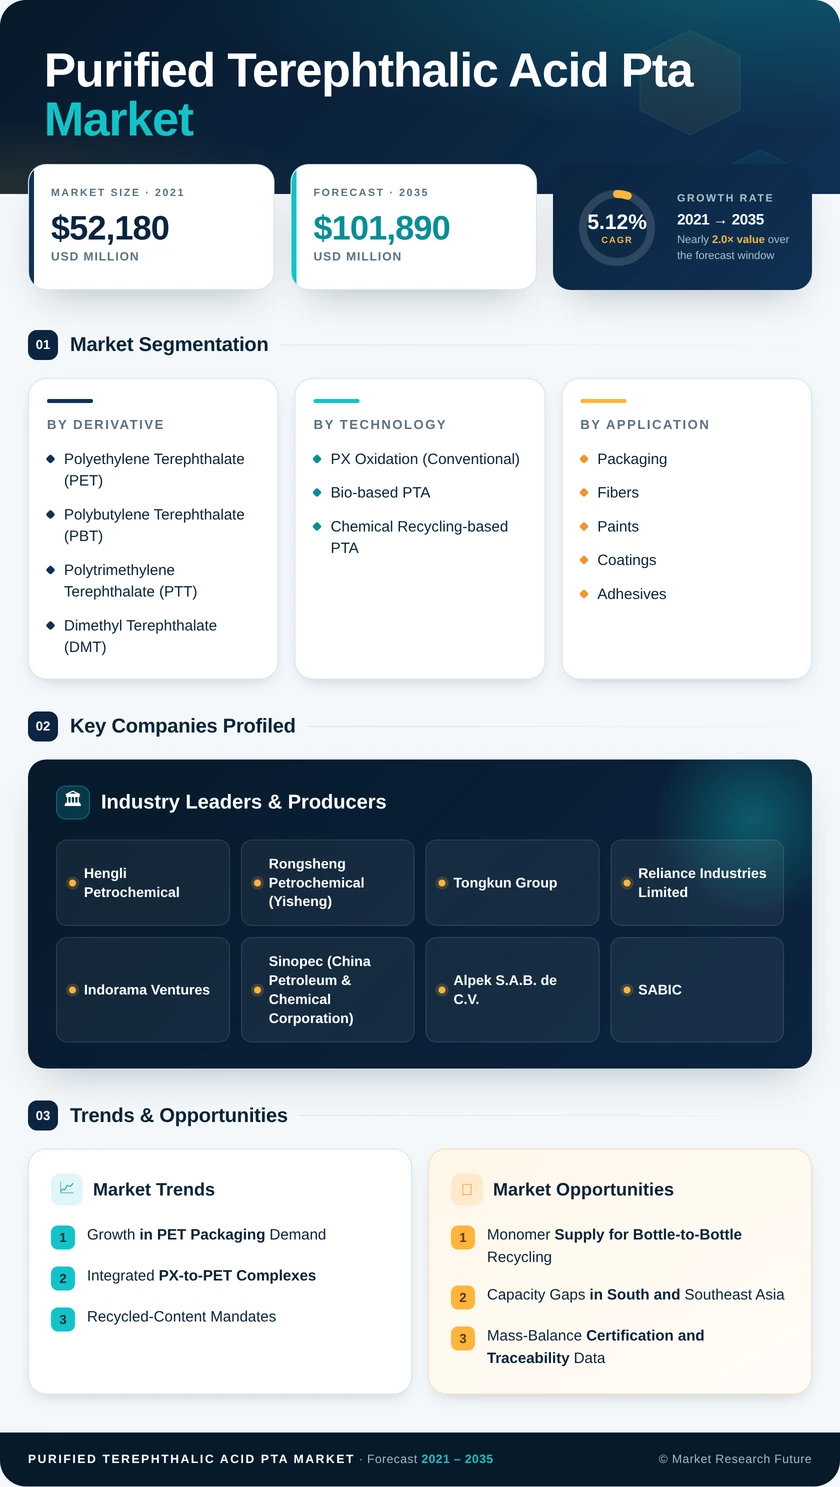
Purified Terephthalic Acid PTA Market (2026 - 2035)

ID: MRFR/CnM/3456-HCR 111 Pages Chitranshi Jaiswal Last Updated: October 21, 2026
Purified Terephthalic Acid Market Research Report Information By Derivative (Polyethylene Terephthalate (PET), Polybutylene Terephthalate (PBT), Polytrimethylene Terephthalate (PTT), and Dimethyl Terephthalate (DMT)), By Technology (PX Oxidation, Bio-based PTA, and Chemical Recycling-based PTA), By Application (Packaging, Fibers, Paints & Coatings, Adhesives, and Other Applications), And By Region (North America, Europe, Asia-Pacific, and Rest of the World) – Market Forecast Till 2035.
Purified Terephthalic Acid PTA Market
Market Size
Forecast Period2026-2035
CAGR (2026-2035)5.12%
2025 Market SizeUSD 61,840 Million
2035 Market SizeUSD 101,890 Million
Key Players
Hengli Petrochemical
Rongsheng Petrochemical
Tongkun Group
Reliance Industries Limited
Indorama Ventures
Sinopec
Opportunities
  • Monomer Supply for Bottle-to-Bottle Recycling
  • Capacity Gaps in South and Southeast Asia
  • Mass-Balance Certification and Traceability Data
  1. 1 Market Summary | |
  2. 2 Key Report Takeaways | |
    1. 2.1 By Derivative | |
    2. 2.2 By Technology | |
    3. 2.3 By Application | |
    4. 2.4 By Region | |
  3. 3 Market Size and Forecast (2021–2035) | |
    1. 3.1 Historical Market Size (2021–2025) | |
    2. 3.2 Forecast Market Size (2026–2035) | |
    3. 3.3 Year-over-Year Growth Analysis | |
  4. 4 Driver Impact Analysis | |
    1. 4.1 Growth in PET Packaging Demand | |
    2. 4.2 Integrated PX-to-PET Complexes | |
    3. 4.3 Recycled-Content Mandates | |
    4. 4.4 Apparel and Home-Textile Exports | |
    5. 4.5 Indian Import Substitution | |
    6. 4.6 Engineering Plastics in EVs and Electronics | |
  5. 5 Restraints Impact Analysis | |
    1. 5.1 Chinese Overcapacity and Margin Compression | |
    2. 5.2 Paraxylene and Crude Price Volatility | |
    3. 5.3 Trade Remedies and Quality Controls | |
    4. 5.4 Carbon Pricing and Scope 3 Pressure | |
    5. 5.5 High Capital Cost of Recycling Routes | |
  6. 6 Opportunities | |
    1. 6.1 Monomer Supply for Bottle-to-Bottle Recycling | |
    2. 6.2 Capacity Gaps in South and Southeast Asia | |
    3. 6.3 Mass-Balance Certification and Traceability Data | |
    4. 6.4 Ultrapure Grades for Energy and Electronics | |
    5. 6.5 Tolling and Licensing Business Models | |
  7. 7 Regional Market Share and Country-Level Analysis | |
    1. 7.1 Asia-Pacific | | |
      1. 7.1.1 China | | |
      2. 7.1.2 India | | |
      3. 7.1.3 Japan | | |
      4. 7.1.4 South Korea | | |
      5. 7.1.5 ASEAN Countries | | |
      6. 7.1.6 Rest of Asia-Pacific | |
    2. 7.2 North America | | |
      1. 7.2.1 United States | | |
      2. 7.2.2 Canada | | |
      3. 7.2.3 Mexico | |
    3. 7.3 Europe | | |
      1. 7.3.1 Germany | | |
      2. 7.3.2 United Kingdom | | |
      3. 7.3.3 Italy | | |
      4. 7.3.4 France | | |
      5. 7.3.5 NORDIC Countries | | |
      6. 7.3.6 Rest of Europe | |
    4. 7.4 South America | | |
      1. 7.4.1 Brazil | | |
      2. 7.4.2 Argentina | | |
      3. 7.4.3 Rest of South America | |
    5. 7.5 Middle-East and Africa | | |
      1. 7.5.1 Saudi Arabia | | |
      2. 7.5.2 South Africa | | |
      3. 7.5.3 Rest of Middle East and Africa | |
  8. 8 Future Outlook (2026–2035) | |
    1. 8.1 Circular Feedstock Becomes a Procurement Standard | |
    2. 8.2 Capacity Rationalization in China | |
    3. 8.3 Decarbonization of Aromatics Chains | |
    4. 8.4 Sustainability Reporting and Traceability | |
  9. 9 Segmentation Analysis | |
    1. 9.1 By Derivative | | |
      1. 9.1.1 Polyethylene Terephthalate (PET) | | |
      2. 9.1.2 Polybutylene Terephthalate (PBT) | | |
      3. 9.1.3 Polytrimethylene Terephthalate (PTT) | | |
      4. 9.1.4 Dimethyl Terephthalate (DMT) | |
    2. 9.2 By Technology | | |
      1. 9.2.1 PX Oxidation (Conventional) | | |
      2. 9.2.2 Bio-based PTA | | |
      3. 9.2.3 Chemical Recycling-based PTA | |
    3. 9.3 By Application | | |
      1. 9.3.1 Packaging | | |
      2. 9.3.2 Fibers | | |
      3. 9.3.3 Paints and Coatings | | |
      4. 9.3.4 Adhesives | | |
      5. 9.3.5 Other Applications (Engineering Plastics, Pharmaceuticals and Intermediates, etc.) | |
  10. 10 Competitive Landscape | |
    1. 10.1 Market Concentration Analysis | |
    2. 10.2 Competitive Benchmarking Table | |
    3. 10.3 Company Profiles | | |
      1. 10.3.1 Hengli Petrochemical | | |
      2. 10.3.2 Rongsheng Petrochemical (Yisheng) | | |
      3. 10.3.3 Tongkun Group | | |
      4. 10.3.4 Reliance Industries Limited | | |
      5. 10.3.5 Indorama Ventures | | |
      6. 10.3.6 Sinopec (China Petroleum & Chemical Corporation) | | |
      7. 10.3.7 Alpek S.A.B. de C.V. | | |
      8. 10.3.8 SABIC | | |
      9. 10.3.9 Lotte Chemical | | |
      10. 10.3.10 INEOS | | |
      11. 10.3.11 Mitsubishi Chemical Group | |
  11. 11 Recent News & Developments | |
  12. 12 Report Scope and Methodology | |
  13. 13 Detailed Sources and Citations | |
  14. 14 Frequently Asked Questions (FAQs) | | LIST OF TABLES | |
  15. TABLE 1 Global Market Snapshot, 2025 and 2035 | |
  16. TABLE 2 Global Market Size & Forecast, by Revenue (USD Million), 2021–2035 | |
  17. TABLE 3 Driver Impact Analysis, 2026–2035 | |
  18. TABLE 4 Restraints Impact Analysis, 2026–2035 | |
  19. TABLE 5 Regional Summary, 2025 | |
  20. TABLE 6 Asia-Pacific Market, by Country, 2025 | |
  21. TABLE 7 North America Market, by Country, 2025 | |
  22. TABLE 8 Europe Market, by Country, 2025 | |
  23. TABLE 9 South America Market, by Country, 2025 | |
  24. TABLE 10 Middle-East and Africa Market, by Country, 2025 | |
  25. TABLE 11 Global Market, by Derivative, 2025 | |
  26. TABLE 12 Global Market, by Technology, 2025 | |
  27. TABLE 13 Global Market, by Application, 2025 | |
  28. TABLE 14 Competitive Benchmarking Table, 2025 | |
  29. TABLE 15 Report Scope and Methodology | |
  30. TABLE 16 Detailed Sources and Citations | | LIST OF FIGURES | |
  31. FIGURE 1 Market Dynamics Overview — Drivers, Restraints, Opportunities | |
  32. FIGURE 2 Industry Value Chain Analysis | |
  33. FIGURE 3 Porter's Five Forces Analysis | |
  34. FIGURE 4 Global Market Size Trend, 2021–2035 (USD Million) | |
  35. FIGURE 5 Market Share, by Derivative, 2025 | |
  36. FIGURE 6 Market Share, by Technology, 2025 | |
  37. FIGURE 7 Market Share, by Application, 2025 | |
  38. FIGURE 8 Market Share, by Region, 2025 | |
  39. FIGURE 9 Asia-Pacific Market Share, by Country, 2025 | |
  40. FIGURE 10 Competitive Landscape — Estimated Revenue Share Ranges, 2025

Segmentation Quick Reference

DimensionSub-SegmentsDominant SegmentFastest Growing Segment
By DerivativePolyethylene Terephthalate (PET); Polybutylene Terephthalate (PBT); Polytrimethylene Terephthalate (PTT); Dimethyl Terephthalate (DMT)Polyethylene Terephthalate (PET) (68.2% share)Polytrimethylene Terephthalate (PTT) (6.1% CAGR)
By TechnologyPX Oxidation (Conventional); Bio-based PTA; Chemical Recycling-based PTAPX Oxidation (Conventional) (95.8% share)Bio-based PTA (7.3% CAGR)
By ApplicationPackaging; Fibers; Paints and Coatings; Adhesives; Other Applications (Engineering Plastics, Pharmaceuticals and Intermediates, etc.)Packaging (43.6% share)Other Applications (Engineering Plastics, Pharmaceuticals and Intermediates, etc.) (6.0% CAGR)
By RegionAsia-Pacific; North America; Europe; South America; Middle-East and AfricaAsia-Pacific (78.4% share)Asia-Pacific (78.4% share)

Market Segmentation Overview

By Derivative

Sub-SegmentKey Trend
Polyethylene Terephthalate (PET)Recycled-content targets reshaping bottle-grade supply
Polybutylene Terephthalate (PBT)Rising use in EV connectors and sensor housings
Polytrimethylene Terephthalate (PTT)Growth in premium carpets and stretch apparel
Dimethyl Terephthalate (DMT)Renewed relevance as a methanolysis output

Polyethylene Terephthalate (PET) leads this dimension because a single polymer serves both bottles and filament, giving it the deepest and most diversified offtake. Polytrimethylene Terephthalate (PTT) grows fastest from a small base, as its elastic recovery earns premium pricing in carpets and stretch fabrics. Polybutylene Terephthalate (PBT) provides steady demand tied to automotive electronics rather than packaging cycles.

By Technology

Sub-SegmentKey Trend
PX Oxidation (Conventional)Mega-train designs lowering capital intensity
Bio-based PTADemonstration plants awaiting cheaper bio-paraxylene
Chemical Recycling-based PTAMethanolysis and glycolysis plants nearing commercial scale

PX Oxidation (Conventional) dominates because integrated producers using licensed designs such as P8 reach cash costs alternative routes cannot yet match. Bio-based PTA posts the fastest growth as brand owners fund plant-based bottle pilots, though feedstock economics keep volumes small. Chemical Recycling-based PTA already earns meaningful revenue where recycled-content laws guarantee premiums for traceable monomer.

By Application

Sub-SegmentKey Trend
PackagingSingle-serve beverage growth and rPET content targets
FibersExport-led demand tempered by Chinese overcapacity
Paints and CoatingsHigher crosslink density in alkyd resins
AdhesivesSteady use in hot-melt polyester systems
Other Applications (Engineering Plastics, Pharmaceuticals and Intermediates, etc.)Ultrapure grades for battery separators and optical films

Packaging leads as beverage and food container demand expands across Asia and Latin America, with recycled-content rules adding value per ton. Other Applications (Engineering Plastics, Pharmaceuticals and Intermediates, etc.) grow fastest because battery separator and optical films require ultrapure grades with margin premiums. Fibers remain a close second by value, but Chinese overcapacity limits their growth relative to packaging.


Download PDF ×

We do not share your information with anyone. However, we may send you emails based on your report interest from time to time. You may contact us at any time to opt-out.