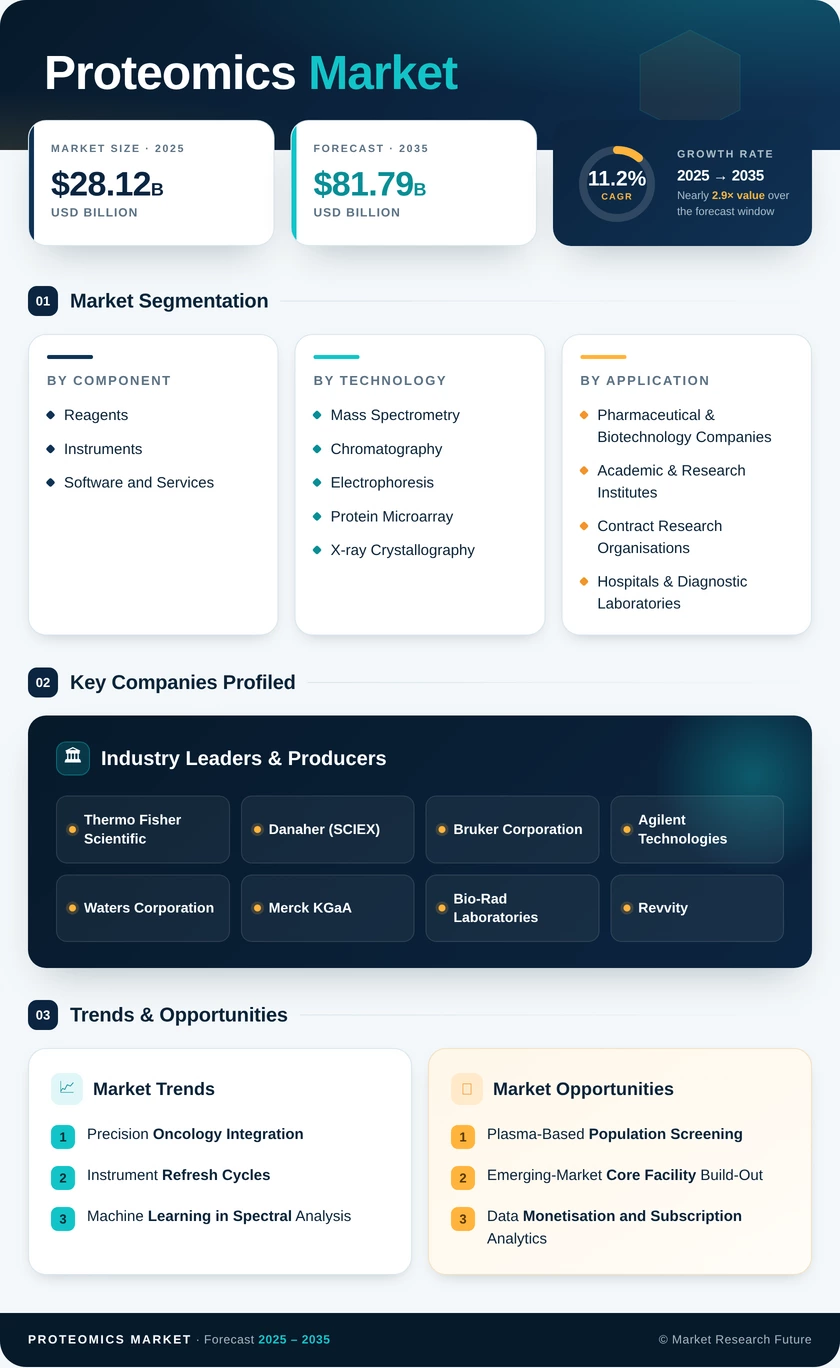
Proteomics Market (2026 - 2035)

Proteomics Market Research Report: Size, Share, Trend Analysis By Applications (Drug Discovery, Clinical Diagnostics, Biomarker Discovery, Personalized Medicine), By Product Type (Instruments, Reagents, Bioinformatics Tools, Services), By Technology (Mass Spectrometry, Chromatography, Microarray, Electrophoresis), By End Use (Research Institutions, Pharmaceutical Companies, Academic Institutions, Clinical Laboratories) and By Regional (North America, Europe, South America, Asia Pacific, Middle East and Africa) - Growth Outlook & Industry Forecast 2025 To 2035

Forecast Period
2026-2035
CAGR
11.2%
2025 Market Size
USD 28.12 Billion
2035 Market Size
USD 81.79 Billion
Healthcare ● Updated August 2026 Report ID: MRFR/HC/5465-HCR | Pages: 200 | Author: Rahul Gotadki, Vikita Thakur
  1. 1 Market Overview |
    1. 1.1 Study Assumptions & Market Definition |
    2. 1.2 Scope of the Study |
    3. 1.3 Research Methodology
  2. 2 Market Summary & Key Takeaways |
    1. 2.1 Key Takeaways by Technology |
    2. 2.2 Key Takeaways by Sector |
    3. 2.3 Key Takeaways by Geography
  3. 3 Global Market Size & Forecast (2021–2035) |
    1. 3.1 Historical Market Size (2021–2025) |
    2. 3.2 Current & Forecast Market Size (2026–2035) |
    3. 3.3 Year-over-Year Growth Analysis
  4. 4 Market Dynamics — Drivers |
    1. 4.1 Precision Oncology Integration |
    2. 4.2 Instrument Refresh Cycles |
    3. 4.3 Machine Learning in Spectral Analysis |
    4. 4.4 Outsourcing to Contract Research Organisations
  5. 5 Market Dynamics — Restraints |
    1. 5.1 Capital Intensity |
    2. 5.2 Talent Scarcity |
    3. 5.3 Standardisation and Reproducibility
  6. 6 Market Opportunity Analysis |
    1. 6.1 Plasma-Based Population Screening |
    2. 6.2 Emerging-Market Core Facility Build-Out |
    3. 6.3 Data Monetisation and Subscription Analytics |
    4. 6.4 Companion Diagnostics Co-Development |
    5. 6.5 Single-Cell and Spatial Extension |
    6. 6.6 Industry Value Chain Analysis |
    7. 6.7 Porter's Five Forces Analysis
  7. 7 Regional Analysis |
    1. 7.1 North America | |
      1. 7.1.1 United States | |
      2. 7.1.2 Canada | |
      3. 7.1.3 Mexico |
    2. 7.2 Europe | |
      1. 7.2.1 Germany | |
      2. 7.2.2 United Kingdom | |
      3. 7.2.3 France | |
      4. 7.2.4 Italy | |
      5. 7.2.5 Spain | |
      6. 7.2.6 Nordic Countries | |
      7. 7.2.7 Russia | |
      8. 7.2.8 Rest of Europe |
    3. 7.3 Asia-Pacific | |
      1. 7.3.1 China | |
      2. 7.3.2 India | |
      3. 7.3.3 Japan | |
      4. 7.3.4 South Korea | |
      5. 7.3.5 ASEAN | |
      6. 7.3.6 Rest of Asia-Pacific |
    4. 7.4 South America | |
      1. 7.4.1 Brazil | |
      2. 7.4.2 Argentina | |
      3. 7.4.3 Rest of South America |
    5. 7.5 Middle East & Africa | |
      1. 7.5.1 Saudi Arabia | |
      2. 7.5.2 UAE | |
      3. 7.5.3 South Africa | |
      4. 7.5.4 Egypt | |
      5. 7.5.5 Rest of Middle East & Africa
  8. 8 Future Outlook (2026–2035) |
    1. 8.1 Autonomous Laboratory Operations |
    2. 8.2 Platform Economics and Recurring Revenue |
    3. 8.3 Diagnostic Translation |
    4. 8.4 Data Infrastructure and Open Repositories
  9. 9 Segmentation Analysis |
    1. 9.1 By Component | |
      1. 9.1.1 Instruments | |
      2. 9.1.2 Reagents | |
      3. 9.1.3 Software and Services |
    2. 9.2 By Technology | |
      1. 9.2.1 Mass Spectrometry | |
      2. 9.2.2 Chromatography | |
      3. 9.2.3 Electrophoresis | |
      4. 9.2.4 Protein Microarray | |
      5. 9.2.5 X-ray Crystallography | |
      6. 9.2.6 Next-Generation Sequencing | |
      7. 9.2.7 Other Technologies |
    3. 9.3 By Application | |
      1. 9.3.1 Drug Discovery & Development | |
      2. 9.3.2 Clinical Diagnostics | |
      3. 9.3.3 Precision & Personalized Medicine | |
      4. 9.3.4 Academic Research | |
      5. 9.3.5 Other Applications |
    4. 9.4 By End-User | |
      1. 9.4.1 Pharmaceutical & Biotechnology Companies | |
      2. 9.4.2 Academic & Research Institutes | |
      3. 9.4.3 Contract Research Organisations | |
      4. 9.4.4 Hospitals & Diagnostic Laboratories
  10. 10 Competitive Landscape |
    1. 10.1 Market Share Analysis (2026) |
    2. 10.2 Competitive Benchmarking Matrix |
    3. 10.3 Company Profiles | |
      1. 10.3.1 Thermo Fisher Scientific | |
      2. 10.3.2 Danaher (SCIEX) | |
      3. 10.3.3 Bruker Corporation | |
      4. 10.3.4 Agilent Technologies | |
      5. 10.3.5 Waters Corporation | |
      6. 10.3.6 Merck KGaA | |
      7. 10.3.7 Bio-Rad Laboratories | |
      8. 10.3.8 Revvity | |
      9. 10.3.9 Shimadzu Corporation | |
      10. 10.3.10 QIAGEN | |
      11. 10.3.11 Bio-Techne | |
      12. 10.3.12 Standard BioTools
  11. 11 Recent Developments & News
  12. 12 Report Scope & Methodology |
    1. 12.1 Study Period & Base Year |
    2. 12.2 Data Sources & Citations |
    3. 12.3 Abbreviations
  13. 13 Detailed Sources and Citations
  14. 14 Frequently Asked Questions (FAQs)
  15. 15 LIST OF TABLES |
  16. TABLE 1 Global Proteomics Market Size & Forecast, by Revenue (USD Billion), 2021–2035 |
  17. TABLE 2 Global Proteomics Market – Year-over-Year Growth Analysis, 2021–2035 |
  18. TABLE 3 Driver Impact Analysis – Global Proteomics Market, 2026–2035 |
  19. TABLE 4 Restraint Impact Analysis – Global Proteomics Market, 2026–2035 |
  20. TABLE 5 Global Proteomics Market Size, by Region, 2021–2035 (USD Billion) |
  21. TABLE 6 North America Proteomics Market Size, by Country, 2021–2035 (USD Billion) |
  22. TABLE 7 Europe Proteomics Market Size, by Country, 2021–2035 (USD Billion) |
  23. TABLE 8 Asia-Pacific Proteomics Market Size, by Country, 2021–2035 (USD Billion) |
  24. TABLE 9 South America Proteomics Market Size, by Country, 2021–2035 (USD Billion) |
  25. TABLE 10 Middle East & Africa Proteomics Market Size, by Country, 2021–2035 (USD Billion) |
  26. TABLE 11 Global Proteomics Market Size, by Component, 2021–2035 (USD Billion) |
  27. TABLE 12 Global Proteomics Market Size, by Technology, 2021–2035 (USD Billion) |
  28. TABLE 13 Global Proteomics Market Size, by Application, 2021–2035 (USD Billion) |
  29. TABLE 14 Global Proteomics Market Size, by End-User, 2021–2035 (USD Billion) |
  30. TABLE 15 North America Proteomics Market Size, by Technology, 2021–2035 (USD Billion) |
  31. TABLE 16 Europe Proteomics Market Size, by Application, 2021–2035 (USD Billion) |
  32. TABLE 17 Asia-Pacific Proteomics Market Size, by End-User, 2021–2035 (USD Billion) |
  33. TABLE 18 Competitive Benchmarking Matrix – Global Proteomics Market, 2026 |
  34. TABLE 19 Company Profiles – Key Players, Global Proteomics Market |
  35. TABLE 20 Recent Developments & Strategic Announcements, 2023–2025 |
  36. TABLE 21 Report Scope & Methodology Summary |
  37. TABLE 22 Detailed Sources and Citations Index
  38. 16 LIST OF FIGURES |
  39. FIGURE 1 Global Proteomics Market Dynamics – Drivers, Restraints, Opportunities |
  40. FIGURE 2 Industry Value Chain Analysis – Proteomics Market |
  41. FIGURE 3 Porter's Five Forces Analysis – Proteomics Market |
  42. FIGURE 4 Global Market Size Trend & Forecast, 2021–2035 (USD Billion) |
  43. FIGURE 5 Year-over-Year Growth Trajectory, 2022–2035 |
  44. FIGURE 6 Market Share by Component, 2025 vs 2035 |
  45. FIGURE 7 Market Share by Technology, 2025 vs 2035 |
  46. FIGURE 8 Market Share by Application, 2025 vs 2035 |
  47. FIGURE 9 Market Share by End-User, 2025 vs 2035 |
  48. FIGURE 10 Regional Revenue Share Distribution, 2025 |
  49. FIGURE 11 Regional CAGR Comparison, 2026–2035 |
  50. FIGURE 12 North America Country-Level Share Breakdown, 2025 |
  51. FIGURE 13 Asia-Pacific Country-Level Growth Comparison, 2026–2035 |
  52. FIGURE 14 Competitive Landscape – Estimated Revenue Share Bands, 2026 |
  53. FIGURE 15 Strategic Positioning Matrix – Leading Suppliers
Share::
Request Free Sample

Segmentation Quick Reference

DimensionSub-SegmentsDominant SegmentFastest Growing Segment
By ComponentInstruments; Reagents; Software and ServicesReagentsSoftware and Services
By TechnologyMass Spectrometry; Chromatography; Electrophoresis; Protein Microarray; X-ray Crystallography; Next-Generation Sequencing; Other TechnologiesMass SpectrometryNext-Generation Sequencing
By ApplicationDrug Discovery & Development; Clinical Diagnostics; Precision & Personalized Medicine; Academic Research; Other ApplicationsDrug Discovery & DevelopmentPrecision & Personalized Medicine
By End-UserPharmaceutical & Biotechnology Companies; Academic & Research Institutes; Contract Research Organisations; Hospitals & Diagnostic LaboratoriesPharmaceutical & Biotechnology CompaniesContract Research Organisations
By GeographyNorth America; Europe; Asia-Pacific; South America; Middle East & AfricaNorth AmericaAsia-Pacific


Market Segmentation Overview

By Component

Sub-SegmentKey Trend
InstrumentsCapital replacement toward higher-throughput acquisition architectures
ReagentsRecurring consumption tied to installed-base utilisation rates
Software and ServicesSubscription licensing and cloud-hosted search engines expanding fastest


Consumables carry the category. Instrument placements matter primarily because each unit locks in years of downstream reagent revenue, which is why suppliers price hardware aggressively and protect consumable margins.

By Technology

Sub-SegmentKey Trend
Mass SpectrometryData-independent acquisition becoming the default workflow
ChromatographyMicro-flow and capillary formats improving sensitivity per sample
ElectrophoresisSteady demand in quality control and purity verification
Protein MicroarrayMultiplex screening panels scaling in translational studies
X-ray CrystallographyComplemented increasingly by cryo-EM in structural pipelines
Next-Generation SequencingAffinity-panel readouts leveraging existing sequencer capacity
Other TechnologiesNanopore and single-molecule approaches at early commercialisation


Method choice increasingly depends on question type rather than laboratory tradition. Discovery work stays with spectrometry; scaled cohort measurement migrates toward affinity and sequencing-based readouts.

By Application

Sub-SegmentKey Trend
Drug Discovery & DevelopmentProtein readouts embedded from target ID through lead optimisation
Clinical DiagnosticsAssay validation pipelines maturing toward regulatory submission
Precision & Personalized MedicineStratification biomarkers entering protocol inclusion criteria
Academic ResearchGrant-dependent, concentrated in shared core facilities
Other ApplicationsAgricultural, food safety, and environmental testing niches


Pharmaceutical pipelines dominate spending today, but the diagnostic segment carries the larger long-run option value if coverage decisions turn favourable.

By End-User

Sub-SegmentKey Trend
Pharmaceutical & Biotechnology CompaniesInternal capacity paired with selective outsourcing
Academic & Research InstitutesShared instrumentation models reducing per-institution capital burden
Contract Research OrganisationsAggregating demand from sponsors lacking in-house capability
Hospitals & Diagnostic LaboratoriesEarly adoption in reference and specialty testing


Buyer concentration among large sponsors shapes product roadmaps industry-wide. Contract providers grow fastest by absorbing episodic demand that would never justify captive infrastructure.


 

Share::
Request Free Sample
Download PDF ×

We do not share your information with anyone. However, we may send you emails based on your report interest from time to time. You may contact us at any time to opt-out.