ID: MRFR/LS/5465-HCR | February 2021 | Region: Global | 90 pages
Market Scenario:
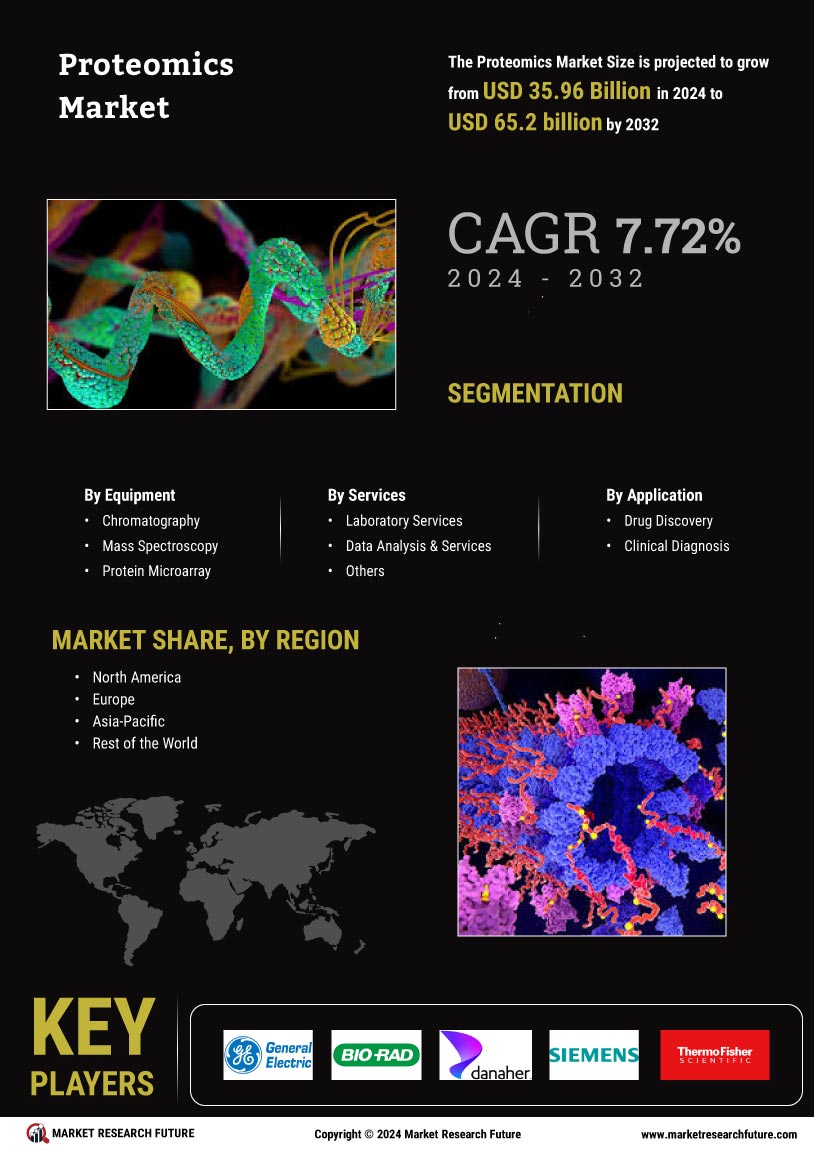
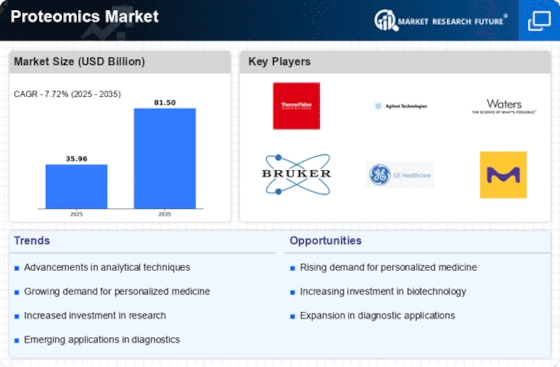
Global Proteomics Market is expected to grow significantly over the forecast period. It is anticipated that the market held a valuation of USD 23.2 Billion in 2017 and is projected to grow at a CAGR of 14.1% over the forecast period. Proteomes are a set of proteins which are produced in a system, organism, or any biological entity. Study of proteomes is known as proteomics. It is used in various applications, like investigation of protein expression, transcriptional & post transcriptional studies, metabolic pathways, protein interaction in diseases, etc.
The factors such as increasing research & development activities in the healthcare industry, rising demand for personalized medicines, rising number of approvals of personalized medicines and increasing activities of drug discovery are expected to propel the growth of the market. According to Foley & Lardner LLP, Food and Drug Administration (FDA) approved 16 new personalized medicine therapies in 2017. However, the high cost of devices and lack of skilled researchers can hamper the market growth over the forecast period.
Segmentation:
The Global Proteomics Market has been segmented into equipment, service and applicationThe market, on the basis of equipment, has been segmented into chromatography, mass spectroscopy, protein microarray, x-ray crystallography, protein fractionation and others.The market, by services, has been segmented into laboratory services and data analysis & services. The laboratory services segment accounted for the largest market share owing to its benefits in effective diagnosis and research for drug discovery. Data analysis and services is expected to register the highest CAGR owing to increasing demand for data analytics.The market, by application, has been segmented into drug discovery, clinical diagnosis and others.
The market has been segmented, by region, into the Americas, Europe, Asia-Pacific, and the Middle East & Africa. The Proteomics Market in the Americas has further been segmented into North America and South America, with the North American market divided into the US and Canada. The European Proteomics Market has been segmented into Western Europe and Eastern Europe. Western Europe has been classified as Germany, France, the UK, Italy, Spain, and the rest of Western Europe. The Proteomics Market in Asia-Pacific has been segmented into Japan, China, India, South Korea, Australia, and the rest of Asia-Pacific. The Proteomics market in the Middle East & Africa has been segmented into the Middle East and Africa.
Key players:
GENERAL ELECTRIC COMPANY, Bio-Rad Laboratories, Inc., Danaher, Siemens Ltd., Thermo Fisher Scientific Inc. Inc., Agilent Technologies, Inc., Genzyme Corporation, Biognosys AG, Bruker, Luminex Corporation, Merck KGaA, PerkinElmer Inc., WATERS, Caprion Biosciences Inc. and others are some of the key players in the Global Proteomics Market.
Regional Market Summary
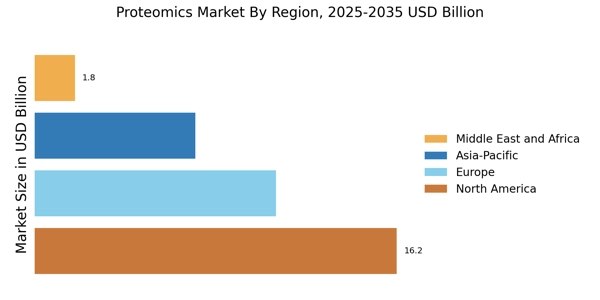
Global Proteomics Market Share (%), by Region, 2017
Source: Centers for Disease Control and Prevention (CDC), Eurostat, White Papers, Company Presentations, Annual Reports
Geographically, the Americas is anticipated to dominate the global proteomics market owing to rising funding from government, rising awareness regarding applications of proteomics, cost effectiveness and increasing demand for personalized medicines. According to a report published in a journal named Leukemia Research in November 2017, personalized medicines improve life of cancer patients by 7 months at USD 32,000.
Europe is expected to hold the second largest position in the Global Proteomics Market. The market growth in this region is attributed to rising cancer research activities and government support. The proteomics market in Asia-Pacific region consists of countries namely China, Japan, Republic of Korea, India, Australia and the Rest of the Asia-Pacific. The Asia-Pacific region is expected to be fastest growing region owing to the increasing demand for personalized medicine due to rising prevalence of cancer and other such diseases and presence of large number of manufacturers of personalized medicines in the region. According to a report published by the National Institute of Cancer Prevention and Research (NICPR), around 2.25 million people in India are living with cancer in 2018.
The Middle East & Africa are expected to hold the least share of the market. The market growth in this region is expected to be driven by a developing healthcare infrastructure.
Global Proteomics Market, by Equipment:
Global Proteomics Market, by Services:
Global Proteomics Market, by Application:
Global Proteomics Market, by Region:
Global Proteomics Market, by Key Players:
Intended Audience:
Table of Contents:
Chapter 1. Report Prologue
Chapter 2. Market Introduction
2.1 Definition
2.2 Scope of the Study
2.2.1 Research Objective
2.2.2 Assumptions
2.2.3 Limitations
Chapter 3. Research Methodology
3.1 Introduction
3.2 Primary Research
3.3 Secondary Research
3.4 Market Size Estimation
Chapter 4. Market Dynamics
4.1 Drivers
4.2 Restraints
4.3 Opportunities
4.4 Challenges
4.5 Macroeconomic Indicators
4.6 Equipment Trends & Assessment
Chapter 5. Market Factor Analysis
5.1 Porter’s Five Forces Analysis
5.1.1 Bargaining Power of Suppliers
5.1.2 Bargaining Power of Buyers
5.1.3 Threat of New Entrants
5.1.4 Threat of Substitutes
5.1.5 Intensity of Rivalry
5.2 Value Chain Analysis
5.3 Investment Feasibility Analysis
5.4 Pricing Analysis
Chapter 6. Global Proteomics Market, by Equipment
6.1 Introduction
6.2 Chromatography
Market Estimates & Forecast, by Region, 2020-2027
Market Estimates & Forecast, by Country, 2020-2027
6.3 Mass Spectroscopy
Market Estimates & Forecast, by Region, 2020-2027
Market Estimates & Forecast, by Country, 2020-2027
6.4 Protein Microarray
Market Estimates & Forecast, by Region, 2020-2027
Market Estimates & Forecast, by Country, 2020-2027
6.5 X-ray Crystallography
Market Estimates & Forecast, by Region, 2020-2027
Market Estimates & Forecast, by Country, 2020-2027
6.6 Protein Fractionation
Market Estimates & Forecast, by Region, 2020-2027
Market Estimates & Forecast, by Country, 2020-2027
6.7 Others
Market Estimates & Forecast, by Region, 2020-2027
Market Estimates & Forecast, by Country, 2020-2027
Chapter 7. Global Proteomics Market, by Service
7.1 Introduction
7.2 Laboratory Service
Market Estimates & Forecast, by Region, 2020-2027
Market Estimates & Forecast, by Country, 2020-2027
7.3 Data Analysis and Services
Market Estimates & Forecast, by Region, 2020-2027
Market Estimates & Forecast, by Country, 2020-2027
Chapter 8. Global Proteomics Market, by Application
8.1 Introduction
8.2 Drug Discovery
Market Estimates & Forecast, by Region, 2020-2027
Market Estimates & Forecast, by Country, 2020-2027
8.3 Clinical Diagnosis
Market Estimates & Forecast, by Region, 2020-2027
Market Estimates & Forecast, by Country, 2020-2027
8.4 Others
Market Estimates & Forecast, by Region, 2020-2027
Market Estimates & Forecast, by Country, 2020-2027
Chapter 9. Global Proteomics Market, by Region
9.1 Introduction
9.2 Americas
9.2.1 North America
9.2.1.1 US
9.2.1.2 Canada
9.2.2 South America
9.3 Europe
9.3.1 Western Europe
9.3.1.1 Germany
9.3.1.2 France
9.3.1.3 Italy
9.3.1.4 Spain
9.3.1.5 UK
9.3.1.6 Rest of Western Europe
9.3.2 Eastern Europe
9.4 Asia-Pacific
9.4.1 Japan
9.4.2 China
9.4.3 India
9.4.4 Australia
9.4.5 South Korea
9.4.6 Rest of Asia-Pacific
9.5 Middle East & Africa
9.5.1 Middle East
9.5.2 Africa
Chapter 10. Company Landscape
10.1 Introduction
10.2 Market Share Analysis
10.3 Key Development & Strategies
Chapter 11. Company Profiles
11.1 GENERAL ELECTRIC COMPANY
11.1.1 Company Overview
11.1.2 Equipment Overview
11.1.3 Financials Overview
11.1.4 Key Developments
11.1.5 SWOT Analysis
11.2 Bio-Rad Laboratories, Inc.
11.2.1 Company Overview
11.2.2 Equipment Overview
11.2.3 Financial Overview
11.2.4 Key Developments
11.2.5 SWOT Analysis
11.3 DANAHER
11.3.1 Company Overview
11.3.2 Equipment Overview
11.3.3 Financial Overview
11.3.4 Key Development
11.3.5 SWOT Analysis
11.4 Siemens Ltd.
11.4.1 Company Overview
11.4.2 Equipment Overview
11.4.3 Financial Overview
11.4.4 Key Development
11.4.5 SWOT Analysis
11.5 Thermo Fisher Scientific Inc.
11.5.1 Company Overview
11.5.2 Equipment Overview
11.5.3 Financial overview
11.5.4 Key Developments
11.5.5 SWOT Analysis
11.6 Agilent Technologies, Inc.
11.6.1 Company Overview
11.6.2 Equipment Overview
11.6.3 Financial Overview
11.6.4 Key Developments
11.6.5 SWOT Analysis
11.7 Genzyme Corporation
11.7.1 Overview
11.7.2 Equipment Overview
11.7.3 Financial Overview
11.7.4 Key Developments
11.7.5 SWOT Analysis
11.8 Biognosys AG
11.8.1 Overview
11.8.2 Equipment Overview
11.8.3 Financials
11.8.4 Key Developments
11.8.5 SWOT Analysis
11.9 Bruker
11.9.1 Overview
11.9.2 Equipment Overview
11.9.3 Financials
11.9.4 Key Developments
11.9.5 SWOT Analysis
11.10 Luminex Corporation
11.10.1 Overview
11.10.2 Equipment Overview
11.10.3 Financials
11.10.4 Key Developments
11.10.5 SWOT Analysis
11.11 Merck KGaA
11.11.1 Overview
11.11.2 Equipment Overview
11.11.3 Financial Overview
11.11.4 Key Developments
11.11.5 SWOT Analysis
11.12 PerkinElmer Inc.
11.12.1 Overview
11.12.2 Equipment Overview
11.12.3 Financials
11.12.4 Key Developments
11.12.5 SWOT Analysis
11.13 WATERS
11.13.1 Overview
11.13.2 Equipment Overview
11.13.3 Financials
11.13.4 Key Developments
11.13.5 SWOT Analysis
11.14 Caprion Biosciences Inc.
11.14.1 Overview
11.14.2 Equipment Overview
11.14.3 Financials
11.14.4 Key Developments
11.14.5 SWOT Analysis
Chapter 12 MRFR Conclusion
12.1 Key Findings
12.1.1 From CEO’s View point
12.1.2 Unmet Needs of the Market
12.2 Key Companies to Watch
12.3 Predictions for the Proteomics Industry
Chapter 13. Appendix
LIST OF TABLES
Table 1 Global Proteomics Market Synopsis, 2020-2027
Table 2 Global Proteomics Market Estimates and Forecast, 2020-2027 (USD Million)
Table 3 Global Proteomics Market, by Region, 2020-2027 (USD Million)
Table 4 Global Proteomics Market, by Equipment, 2020-2027 (USD Million)
Table 5 Global Proteomics Market, by Services, 2020-2027 (USD Million)
Table 6 Global Proteomics Market, by Application, 2020-2027 (USD Million)
Table 7 North America: Proteomics Market, by Equipment, 2020-2027 (USD Million)
Table 8 North America: Proteomics Market, by Services, 2020-2027 (USD Million)
Table 9 North America: Proteomics Market, by Application, 2020-2027 (USD Million)
Table 10 US: Proteomics Market, by Equipment, 2020-2027 (USD Million)
Table 11 US: Proteomics Market, by Services, 2020-2027 (USD Million)
Table 12 US: Proteomics Market, by Application, 2020-2027 (USD Million)
Table 13 Canada: Proteomics Market, by Equipment, 2020-2027 (USD Million)
Table 14 Canada: Proteomics Market, by Services, 2020-2027 (USD Million)
Table 15 Canada: Proteomics Market, by Application, 2020-2027 (USD Million)
Table 16 South America: Proteomics Market, by Equipment, 2020-2027 (USD Million)
Table 17 South America: Proteomics Market, by Services, 2020-2027 (USD Million)
Table 18 South America: Proteomics Market, by Application, 2020-2027 (USD Million)
Table 19 Europe: Proteomics Market, by Equipment, 2020-2027 (USD Million)
Table 20 Europe: Proteomics Market, by Services, 2020-2027 (USD Million)
Table 21 Europe: Proteomics Market, by Application, 2020-2027 (USD Million)
Table 22 Western Europe: Proteomics Market, by Equipment, 2020-2027 (USD Million)
Table 23 Western Europe: Proteomics Market, by Services, 2020-2027 (USD Million)
Table 24 Western Europe: Proteomics Market, by Application, 2020-2027 (USD Million)
Table 25 Eastern Europe: Proteomics Market, by Equipment, 2020-2027 (USD Million)
Table 26 Eastern Europe: Proteomics Market, by Services, 2020-2027 (USD Million)
Table 27 Eastern Europe: Proteomics Market, by Application, 2020-2027 (USD Million)
Table 28 Asia-Pacific: Proteomics Market, by Equipment, 2020-2027 (USD Million)
Table 29 Asia-Pacific: Proteomics Market, by Services, 2020-2027 (USD Million)
Table 30 Asia-Pacific: Proteomics Market, by Application, 2020-2027 (USD Million)
Table 31 Middle East & Africa: Proteomics Market, by Equipment, 2020-2027 (USD Million)
Table 32 Middle East & Africa: Proteomics Market, by Services, 2020-2027 (USD Million)
Table 33 Middle East & Africa: Proteomics Market, by Application, 2020-2027 (USD Million)
LIST OF FIGURES
Figure 1 Research Process
Figure 2 Market Structure for Global Proteomics Market
Figure 3 Market Dynamics for Global Proteomics Market
Figure 4 Global Proteomics Market Share, by Equipment, 2020
Figure 5 Global Proteomics Market Share, by Services, 2020
Figure 6 Global Proteomics Market Share, by Application, 2020
Figure 7 Global Proteomics Market Share, by Region, 2020
Figure 8 North America: Proteomics Market Share, by Country, 2020
Figure 9 Europe: Proteomics Market Share, by Country, 2020
Figure 10 Asia-Pacific: Proteomics Market Share, by Country, 2020
Figure 11 Middle East & Africa: Proteomics Market Share, by Country, 2020
Figure 12 Global Proteomics Market: Company Share Analysis, 2020 (%)
Figure 13 GENERAL ELECTRIC COMPANY: Key Financials
Figure 14 GENERAL ELECTRIC COMPANY: Segmental Revenue
Figure 15 GENERAL ELECTRIC COMPANY: Geographical Revenue
Figure 16 Bio-Rad Laboratories, Inc.: Key Financials
Figure 17 Bio-Rad Laboratories, Inc.: Segmental Revenue
Figure 18 Bio-Rad Laboratories, Inc.: Geographical Revenue
Figure 19 DANAHER: Key Financials
Figure 20 DANAHER: Segmental Revenue
Figure 21 DANAHER: Geographical Revenue
Figure 22 Siemens Ltd.: Key Financials
Figure 23 Siemens Ltd.: Segmental Revenue
Figure 24 Siemens Ltd.: Geographical Revenue
Figure 25 Thermo Fisher Scientific Inc.: Key Financials
Figure 26 Thermo Fisher Scientific Inc.: Segmental Revenue
Figure 27 Thermo Fisher Scientific Inc.: Geographical Revenue
Figure 28 Agilent Technologies, Inc.: Key Financials
Figure 29 Agilent Technologies, Inc.: Segmental Revenue
Figure 30 Agilent Technologies, Inc.: Geographical Revenue
Figure 31 Genzyme Corporation: Key Financials
Figure 32 Genzyme Corporation: Segmental Revenue
Figure 33 Genzyme Corporation: Geographical Revenue
Figure 34 Biognosys AG: Key Financials
Figure 35 Biognosys AG: Segmental Revenue
Figure 36 Biognosys AG: Geographical Revenue
Figure 37 Bruker: Key Financials
Figure 38 Bruker: Segmental Revenue
Figure 39 Bruker: Geographical Revenue
Figure 40 Luminex Corporation: Key Financials
Figure 41 Luminex Corporation: Segmental Revenue
Figure 42 Luminex Corporation: Geographical Revenue
Figure 43 Merck KGaA: Key Financials
Figure 44 Merck KGaA: Segmental Revenue
Figure 45 Merck KGaA: Geographical Revenue
Figure 46 PerkinElmer Inc.: Key Financials
Figure 47 PerkinElmer Inc.: Segmental Revenue
Figure 48 PerkinElmer Inc.: Geographical Revenue
Figure 49 WATERS: Key Financials
Figure 50 WATERS: Segmental Revenue
Figure 51 WATERS: Geographical Revenue
Figure 52 Caprion Biosciences Inc.: Key Financials
Figure 53 Caprion Biosciences Inc.: Segmental Revenue
Figure 54 Caprion Biosciences Inc.: Geographical Revenue