Property Management Software Market (2026 - 2035)

ID: MRFR/ICT/31079-HCR 100 Pages Nirmit Biswas Last Updated: October 16, 2026
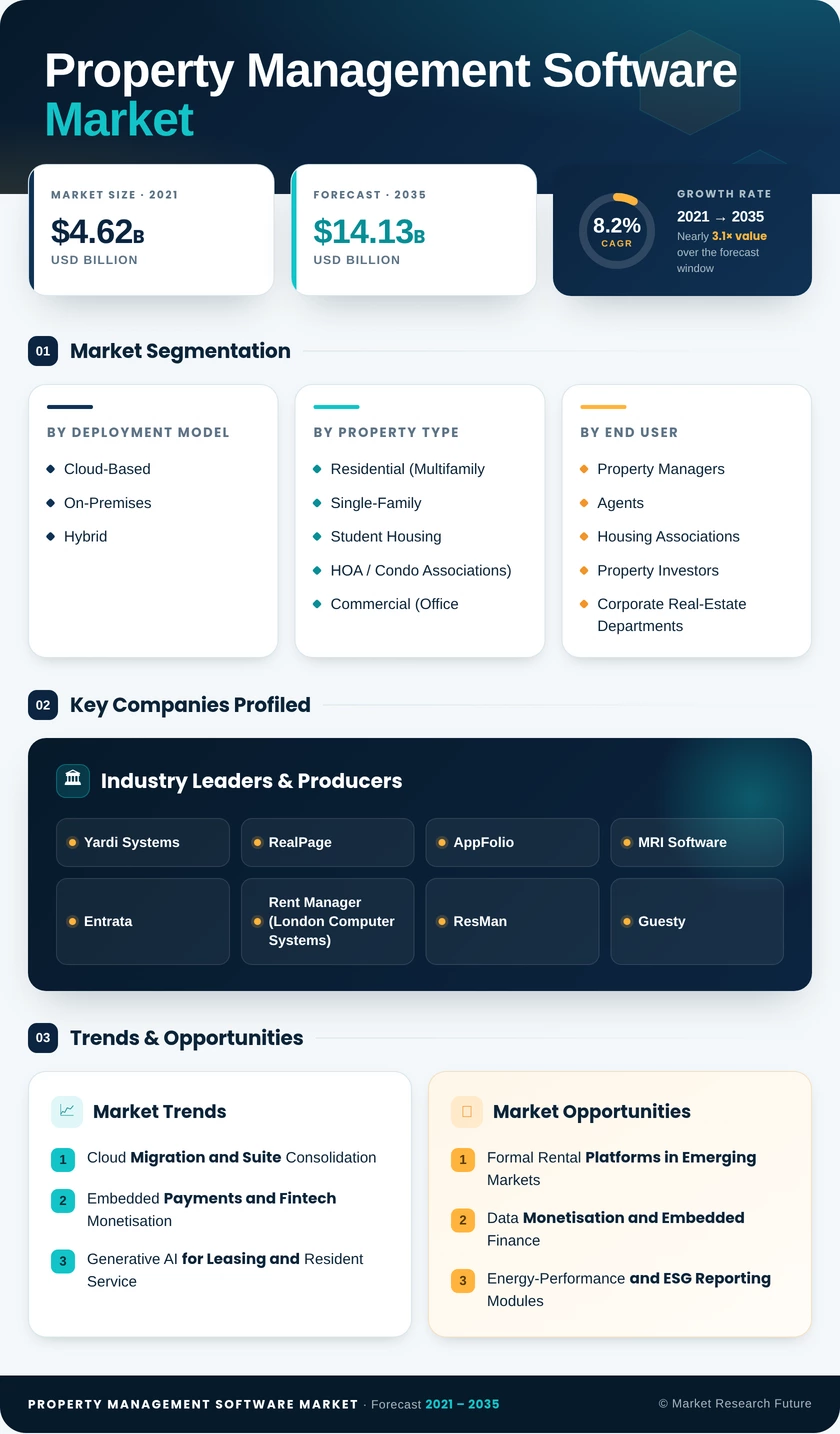
Property Management Software Market Size, Share and Research Report By Deployment Model (Cloud-Based, On-Premises, Hybrid), By Property Type (Residential, Commercial, Mixed-Use), By End User (Property Managers and Agents, Housing Associations, Property Investors, Corporate Real-Estate Departments, Facilities-Management Firms), By Solution Module (Lease and Tenant Management, Accounting and Reporting, Maintenance Management, Marketing and Listing, Integrated Payments, Advanced Analytics and AI Tools), By Organization Size (Small (1–500 Units), Mid (501–5,000 Units), Large (>5,000 Units)) and By Regional (North America, Europe, South America, Asia Pacific, Middle East and Africa) - Industry Forecast to 2035.
Property Management Software Market
Market Size
Forecast Period2026-2035
CAGR (2026-2035)8.2%
2025 Market SizeUSD 6.42 Billion
2035 Market SizeUSD 14.13 Billion
Key Players
Yardi Systems
RealPage
AppFolio
MRI Software
Entrata
Rent Manager
Opportunities
  • Formal Rental Platforms in Emerging Markets
  • Data Monetisation and Embedded Finance
  • Energy-Performance and ESG Reporting Modules
  1. 1 Market Summary | |
  2. 2 Key Report Takeaways | |
    1. 2.1 By Deployment Model | |
    2. 2.2 By Property Type | |
    3. 2.3 By End User | |
    4. 2.4 By Solution Module | |
    5. 2.5 By Organization Size | |
    6. 2.6 By Region | |
  3. 3 Market Size and Forecast (2021–2035) | |
  4. 4 Driver Impact Analysis | |
    1. 4.1 Cloud Migration and Suite Consolidation | |
    2. 4.2 Embedded Payments and Fintech Monetisation | |
    3. 4.3 Generative AI for Leasing and Resident Service | |
    4. 4.4 Tightening Rental and Data Regulation | |
    5. 4.5 Institutional Rental and Build-to-Rent Investment | |
    6. 4.6 Urbanisation and Formal Rental Growth in Emerging Economies | |
  5. 5 Restraints Impact Analysis | |
    1. 5.1 Data Security and Privacy Liability | |
    2. 5.2 Algorithmic Pricing Litigation and Regulatory Backlash | |
    3. 5.3 Legacy Data Migration and Integration Complexity | |
    4. 5.4 Price Sensitivity Among Small Landlords | |
    5. 5.5 Vendor Lock-In and Subscription Cost Escalation | |
  6. 6 Opportunities | |
    1. 6.1 Formal Rental Platforms in Emerging Markets | |
    2. 6.2 Data Monetisation and Embedded Finance | |
    3. 6.3 Energy-Performance and ESG Reporting Modules | |
    4. 6.4 Convergence of Short-Term and Long-Term Rentals | |
    5. 6.5 Workplace Management for Facilities-Management Firms | |
  7. 7 Regional Market Share and Country-Level Analysis | |
    1. 7.1 North America | | |
      1. 7.1.1 United States | | |
      2. 7.1.2 Canada | | |
      3. 7.1.3 Mexico | |
    2. 7.2 Europe | | |
      1. 7.2.1 Germany | | |
      2. 7.2.2 United Kingdom | | |
      3. 7.2.3 France | | |
      4. 7.2.4 Italy | | |
      5. 7.2.5 Spain | | |
      6. 7.2.6 Russia | | |
      7. 7.2.7 Rest of Europe | |
    3. 7.3 Asia Pacific | | |
      1. 7.3.1 China | | |
      2. 7.3.2 Japan | | |
      3. 7.3.3 South Korea | | |
      4. 7.3.4 India | | |
      5. 7.3.5 Australia | | |
      6. 7.3.6 New Zealand | | |
      7. 7.3.7 Rest of Asia Pacific | |
    4. 7.4 South America | | |
      1. 7.4.1 Brazil | | |
      2. 7.4.2 Argentina | | |
      3. 7.4.3 Rest of South America | |
    5. 7.5 Middle East and Africa | | |
      1. 7.5.1 United Arab Emirates | | |
      2. 7.5.2 Saudi Arabia | | |
      3. 7.5.3 Turkey | | |
      4. 7.5.4 Rest of Middle East | | |
      5. 7.5.5 South Africa | | |
      6. 7.5.6 Nigeria | | |
      7. 7.5.7 Kenya | | |
      8. 7.5.8 Rest of Africa | |
  8. 8 Future Outlook (2026–2035) | |
    1. 8.1 Agentic AI Runs Routine Operations | |
    2. 8.2 Platform Economics and Embedded Finance | |
    3. 8.3 Regulatory-Grade Transparency | |
    4. 8.4 Building Decarbonisation and Performance Data | |
  9. 9 Segmentation Analysis | |
    1. 9.1 By Deployment Model | | |
      1. 9.1.1 Cloud-Based | | |
      2. 9.1.2 On-Premises | | |
      3. 9.1.3 Hybrid | |
    2. 9.2 By Property Type | | |
      1. 9.2.1 Residential | | |
      2. 9.2.2 Commercial | | |
      3. 9.2.3 Mixed-Use | |
    3. 9.3 By End User | | |
      1. 9.3.1 Property Managers and Agents | | |
      2. 9.3.2 Housing Associations | | |
      3. 9.3.3 Property Investors | | |
      4. 9.3.4 Corporate Real-Estate Departments | | |
      5. 9.3.5 Facilities-Management Firms | |
    4. 9.4 By Solution Module | | |
      1. 9.4.1 Lease and Tenant Management | | |
      2. 9.4.2 Accounting and Reporting | | |
      3. 9.4.3 Maintenance Management | | |
      4. 9.4.4 Marketing and Listing | | |
      5. 9.4.5 Integrated Payments | | |
      6. 9.4.6 Advanced Analytics and AI Tools | |
    5. 9.5 By Organization Size | | |
      1. 9.5.1 Small (1-500 units) | | |
      2. 9.5.2 Mid (501-5 000 units) | | |
      3. 9.5.3 Large (>5 000 units) | |
  10. 10 Competitive Landscape | |
    1. 10.1 Market Concentration Analysis | |
    2. 10.2 Competitive Benchmarking Table | |
  11. 11 Recent News & Developments | |
  12. 12 Report Scope and Methodology | |
  13. 13 Detailed Sources and Citations | |
  14. 14 Frequently Asked Questions (FAQs) | | LIST OF TABLES | |
  15. TABLE 1 Global Market Size & Forecast, by Revenue (USD Billion), 2021–2035 | |
  16. TABLE 2 Driver Impact Analysis, 2026–2035 | |
  17. TABLE 3 Restraints Impact Analysis, 2026–2035 | |
  18. TABLE 4 Global Market Size, by Region, 2025 (USD Billion) | |
  19. TABLE 5 North America Market, by Country, 2025 | |
  20. TABLE 6 Europe Market, by Country, 2025 | |
  21. TABLE 7 Asia Pacific Market, by Country, 2025 | |
  22. TABLE 8 South America Market, by Country, 2025 | |
  23. TABLE 9 Middle East and Africa Market, by Country, 2025 | |
  24. TABLE 10 Global Market, by Deployment Model, 2025 | |
  25. TABLE 11 Global Market, by Property Type, 2025 | |
  26. TABLE 12 Global Market, by End User, 2025 | |
  27. TABLE 13 Global Market, by Solution Module, 2025 | |
  28. TABLE 14 Global Market, by Organization Size, 2025 | |
  29. TABLE 15 Competitive Benchmarking Table, 2025 | |
  30. TABLE 16 Report Scope and Methodology | |
  31. TABLE 17 Detailed Sources and Citations | | LIST OF FIGURES | |
  32. FIGURE 1 Market Dynamics Overview – Drivers, Restraints and Opportunities | |
  33. FIGURE 2 Industry Value Chain Analysis | |
  34. FIGURE 3 Porter's Five Forces Analysis | |
  35. FIGURE 4 Global Market Size Trend, 2021–2035 (USD Billion) | |
  36. FIGURE 5 Market Share, by Deployment Model, 2025 | |
  37. FIGURE 6 Market Share, by Property Type, 2025 | |
  38. FIGURE 7 Market Share, by End User, 2025 | |
  39. FIGURE 8 Market Share, by Solution Module, 2025 | |
  40. FIGURE 9 Market Share, by Organization Size, 2025 | |
  41. FIGURE 10 Market Share, by Region, 2025 | |
  42. FIGURE 11 Regional Growth Comparison, 2026–2035 (CAGR) | |
  43. FIGURE 12 Competitive Landscape – Estimated Revenue Share Ranges, 2025

Segmentation Quick Reference

DimensionSub-SegmentsDominant SegmentFastest Growing Segment
By Deployment ModelCloud-Based, On-Premises, HybridCloud-Based (68.0% share)Hybrid (9.7% CAGR)
By Property TypeResidential (Multifamily, Single-Family, Student Housing, HOA / Condo Associations), Commercial (Office, Retail, Industrial / Logistics, Hospitality), Mixed-UseResidential (54.5% share)Industrial / Logistics (11.1% CAGR)
By End UserProperty Managers and Agents, Housing Associations, Property Investors, Corporate Real-Estate Departments, Facilities-Management FirmsProperty Managers and Agents (40.0% share)Facilities-Management Firms (11.9% CAGR)
By Solution ModuleLease and Tenant Management, Accounting and Reporting, Maintenance Management, Marketing and Listing, Integrated Payments, Advanced Analytics and AI ToolsLease and Tenant Management (33.2% share)Integrated Payments (11.5% CAGR)
By Organization SizeSmall (1-500 units), Mid (501-5 000 units), Large (>5 000 units)Mid (501- 5,000 units) (44.0% share)Small (1-500 units) (11.8% CAGR)
By RegionNorth America, Europe, Asia Pacific, South America, Middle East and AfricaNorth America (38.5% share)Asia Pacific (10.6% CAGR)

Market Segmentation Overview

By Deployment Model

Sub-SegmentKey Trend
Cloud-BasedContinuous updates and low upfront cost drive default adoption
On-PremisesRetained by public housing bodies and control-sensitive owners
HybridLocal storage of personal data with cloud analytics

Cloud-Based deployment leads because operators avoid server costs and receive new AI and payment features automatically. Hybrid grows fastest as multinational landlords keep resident identity data on local infrastructure to meet residency rules while running analytics in the cloud. On-premises installations are shrinking in share but remain relevant where data control outweighs convenience.

By Property Type

Sub-SegmentKey Trend
ResidentialHigh-volume rent collection and resident self-service portals
CommercialComplex lease accounting, with Industrial / Logistics demand rising fastest
Mixed-UseConsolidated reporting across residential, retail and office components

Residential properties lead, with Multifamily portfolios generating the largest transaction volumes. Industrial / Logistics, within Commercial, grows fastest because warehouse operators need lease engines for variable rent structures and space-utilisation data tied to e-commerce fulfilment. Mixed-Use assets push owners toward suites that allocate shared expenses accurately across tenant types.

By End User

Sub-SegmentKey Trend
Property Managers and AgentsTrust accounting and owner reporting at scale
Housing AssociationsSubsidy and social-housing compliance automation
Property InvestorsPortfolio benchmarking dashboards
Corporate Real-Estate DepartmentsLease accounting and footprint reduction
Facilities-Management FirmsWorkplace management convergence

Property Managers and Agents lead because they operate portfolios for many owners and depend on owner statements and trust accounting. Facilities-Management Firms grow fastest as corporations outsource building operations and want leases, space allocation and preventive maintenance on one platform. Housing Associations and Corporate Real-Estate Departments buy primarily for compliance and lease-accounting accuracy.

By Solution Module

Sub-SegmentKey Trend
Lease and Tenant ManagementAutomated enforcement of local rent rules
Accounting and ReportingFaster month-end close and investor reporting
Maintenance ManagementPredictive work-order routing
Marketing and ListingAutomated syndication to listing portals
Integrated PaymentsTransaction revenue for vendors and faster collections for operators
Advanced Analytics and AI ToolsGenerative assistants and rent forecasting

Lease and Tenant Management leads as the first module every operator deploys and the system of record for tenancies. Integrated Payments grows fastest because vendors earn on each transaction while operators reduce late payments and reconciliation work. Advanced Analytics and AI Tools follow closely as generative assistants take over resident communication.

By Organization Size

Sub-SegmentKey Trend
Small (1-500 units)Freemium tiers and mobile-first onboarding
Mid (501-5 000 units)Full-suite adoption with agile vendor switching
Large (> 5,000 units)Enterprise integration and multi-year contracts

Mid (501-5 000 units) portfolios lead because they need comprehensive suites but can change vendors quickly when features lag. Small (1-500 units) landlords grow fastest as low-cost and free entry plans remove the budget barrier that kept them on spreadsheets. Large (> 5,000 units) owners focus on integration with enterprise data systems and investor-reporting requirements.


Download PDF ×

We do not share your information with anyone. However, we may send you emails based on your report interest from time to time. You may contact us at any time to opt-out.