ID: MRFR/HC/6649-HCR | February 2021 | Region: Global | 90 pages
Market Scenario
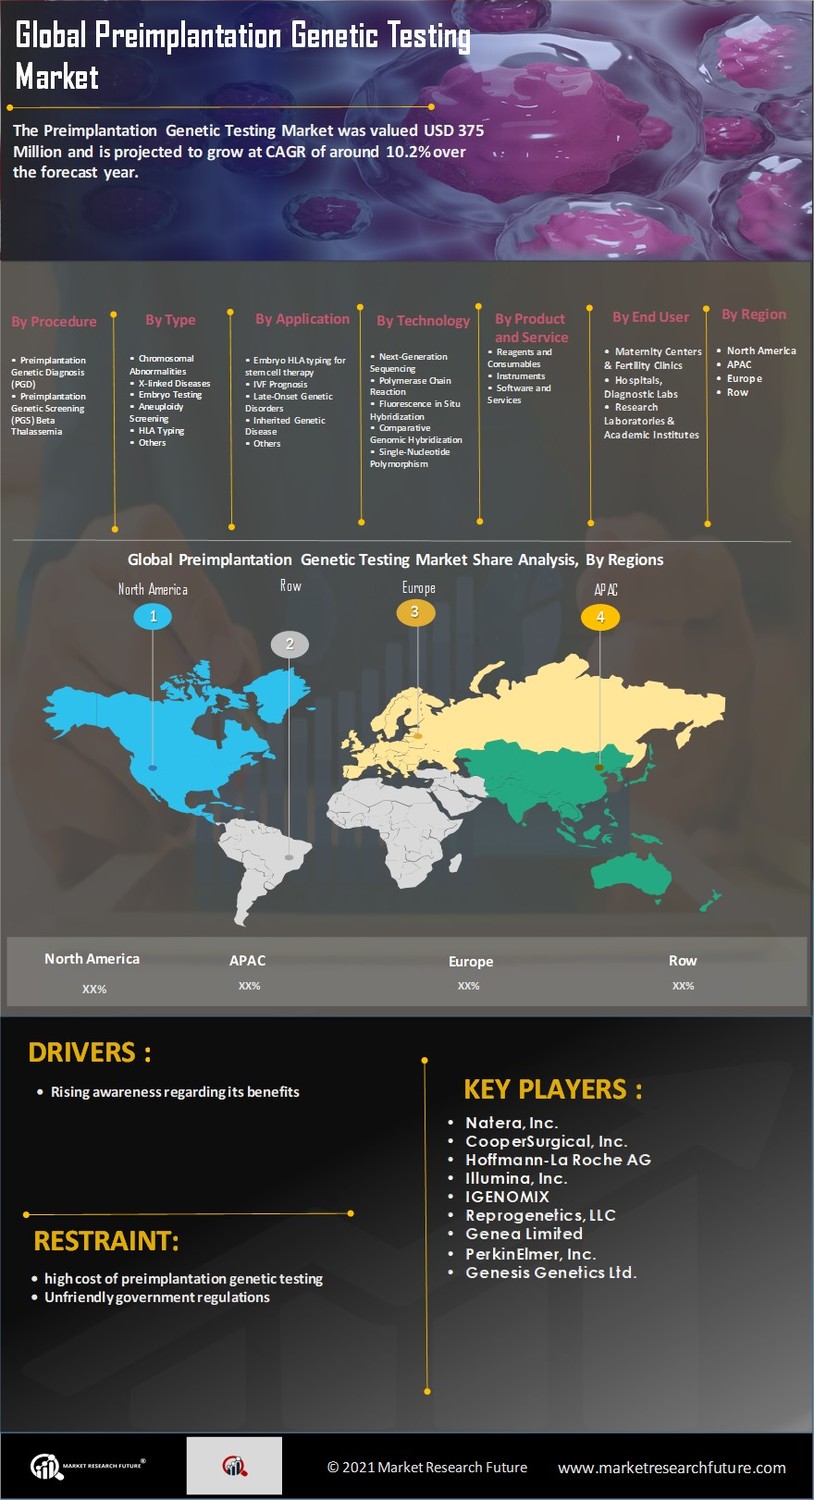
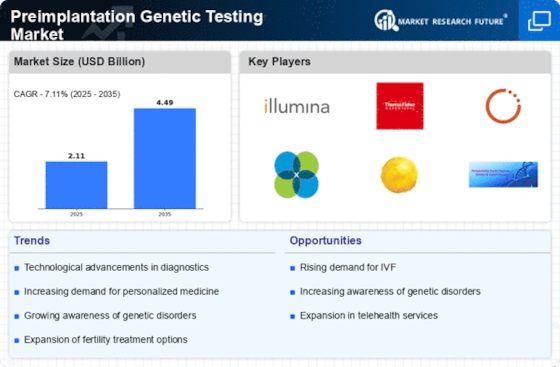
The global preimplantation genetic testing market is expected to grow significantly over the forecast period. It is anticipated that the market held a valuation of USD 375.8 million in 2018 and is projected to register a CAGR of around 10.2% over the forecast period.
Preimplantation genetic testing is a wide term, which is used to describe the genetic analysis of cells of an embryo, and the outcome is used for analysis and guide, which embryos should transfer to the uterus.
Also, nowadays, preimplantation genetic testing has become much more common in North America and Europe due to innovation in genetic technology like NGS and FISH over the traditional genetic technology
Population suffering from disorders related to the gene is expected to drive the preimplantation genetic testing market. Thus, awareness of people about genetic disorders helps to avoid the risk of having babies with certain genetic disorders.
March of Dimes, a voluntary health group of the US stated about 60%,34% and 6% of babies with serious birth defects were born in developing countries, middle-income countries and rich countries respectively.
Additionally,3.3 million children less than five years die each year from serious birth defects worldwide. But genetic medical services and effective interventions, especially in developing countries, could reduce disability and mortality by up to 70%.
Hence raising awareness of preimplantation genetic testing drive the global preimplantation genetic testing market.
Segmentation
The global preimplantation genetic testing market is segmented based on procedure, type, application, technology, product and service, end user, and region.
The global market for preimplantation genetic testing, by procedure, is segmented into preimplantation genetic diagnosis (PGD) and preimplantation genetic screening (PGS). By type, it is divided into chromosomal abnormalities, X-linked diseases, embryo testing, aneuploidy screening, LA typing, and others. By Application it is segmented into embryo HLA typing for stem cell therapy prognosis, late-onset genetic disorders, inherited the genetic disease and others. By technology, the market is divided into
next-generation sequencing, polymerase chain reaction, fluorescence in situ hybridization, comparative genomic hybridization, and single-nucleotide polymorphism. By product and service, it is divided into reagents and consumables, instruments and software and services and lastly by end user the market is divided into maternity centers & fertility clinics, hospitals, diagnostic labs and research laboratories & academic institutes
Preimplantation genetic diagnosis (PGD) segment is expected to hold the largest market share of the preimplantation genetic testing market owing to rising awareness patients as well as healthcare professionals about genetic testing. Also, preimplantation genetic screening (PGS) segment is anticipated profitable growth during the forecast period as it reduces the miscarriage risk, increase the possibility of a healthy pregnancy in all age groups
By technology, the next-generation sequencing segment also expected to hold a large share as its cost is reduced and its capability to detect mosaicism.
By product & service, the reagents and consumables segment expected to hold the largest market share as there is continuous declination infertility of female due to the increase in maternity age.
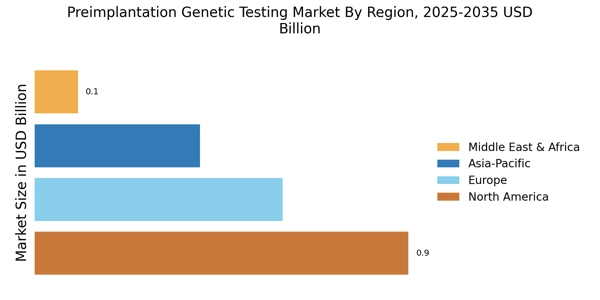
In the current scope of the study, the segments mentioned above are covered into four global regions, namely, the Americas, Europe, Asia-Pacific, and the Middle East and Africa.
The preimplantation genetic testing market in the Americas has further been segmented into North America and South America, with the North American market divided into the US and Canada.
The European preimplantation genetic testing market has been segmented into Western Europe and Eastern Europe. Western Europe has been classified as Germany, France, the UK, Italy, Spain, and the rest of Western Europe. The Preimplantation Genetic Testing market in Asia-Pacific has been segmented into Japan, China, India, South Korea, Australia, and the rest of Asia-Pacific. The Preimplantation Genetic Testing market in the Middle East and Africa has been segmented into the Middle East and Africa.
Key Players
Regional Market Summary
Global Preimplantation Genetic Testing Market Share (%), by Region, 2017
Sources: MRFR Analysis
March of Dimes, the US voluntary health group stated that 7.9 million children are born with a serious birth defect of genetic or partially genetic origin, that is, 6% of total births in a year worldwide. This estimation is drawn from a study of 193 countries. As the genetic defects are growing, there is an increase in awareness about preimplantation genetic testing in population worldwide.
US Department of Health & Human Services stated that Infertility is very common. Thus, out of 100 couples in the US, about 12 to 13 of them have trouble getting pregnant. About 10 in 100 (6.1 million) women in the US aged 15 to 44 have a problem in getting pregnant or staying pregnant. Hence the prevalence of infertility causes an increase in the number of IVF procedures in the US, which is expected to drive the market.
As the maternal age in Europe is increasing complications regarding childbirth along with the threat of abnormalities in chromosomes is also rising. This leads to an increase in preimplantation genetic testing for baby birth with normal genes.
The rising participation of market players is also strongly impacting the growth of the Asia-Pacific Preimplantation Genetic Testing market.
On the other hand, the Middle East and Africa held the least share in the global preimplantation genetic testing market due to the low economic development, especially within the African region.
Market Segmentation
Global Preimplantation Genetic Testing Market, by Procedure
Global Preimplantation Genetic Testing Market, by Type
Preimplantation Genetic Testing Market, by Application
Preimplantation Genetic Testing Market, by Technology
Preimplantation Genetic Testing Market, by Product and Service
Global Preimplantation Genetic Testing Market, by End User
Global Preimplantation Genetic Testing Market, by Region
Intended Audience
Report Attribute/Metric | Details |
---|---|
Market Size | 2025: Significant Value |
CAGR | 10.2% (2019-2025) |
Base Year | 2019 |
Forecast Period | 2027 |
Historical Data | 2018 |
Forecast Units | Value (USD Million) |
Report Coverage | Revenue Forecast, Competitive Landscape, Growth Factors, and Trends |
Segments Covered | Procedure, Type, Application, Technology, Product and Service |
Geographies Covered | North America, Europe, Asia-Pacific, and Rest of the World (RoW) |
Key Vendors | Natera, Inc.CooperSurgical, Inc., F. Hoffmann-La Roche AG, Illumina, Inc., IGENOMIX, Reprogenetics, LLC, Genea Limited, PerkinElmer, Inc., Genesis Genetics Ltd., Quest Diagnostics Incorporated, Thermo FisherScientific, Inc, Bioarrayn Genetics, Laboratory Corporation of America Holdings, California Pacific Medical Center and Reproductive Health Science Ltd |
Key Market Opportunities | New product launches and R&D Amongst major key Players |
Key Market Drivers | Rising awareness regarding its benefits |
Frequently Asked Questions (FAQ) :
The preimplantation genetic testing market would register a CAGR of 10.2% during the forecast period of 2019 to 2025.
The preimplantation genetic testing market valuation in 2018 was USD 375.8 million.
Rising awareness regarding its benefits would increase the preimplantation genetic testing market volume.
The Preimplantation genetic diagnosis (PGD) segment would lead to the preimplantation genetic testing market.
The next-generation sequencing has the upper hand in the preimplantation genetic testing market.
Table of Contents
Chapter 1. Report Prologue
Chapter 2. Market Introduction
2.1 Definition
2.2 Scope of the Study
2.2.1 Research Objective
2.2.2 Assumptions
2.2.3 Limitations
Chapter 3. Research Methodology
3.1 Introduction
3.2 Primary Research
3.3 Secondary Research
3.4 Market Size Estimation
Chapter 4. Market Dynamics
4.1 Drivers
4.2 Restraints
4.3 Opportunities
4.4 Macroeconomic Indicators
4.5 Trends & Assessment
Chapter 5. Market Factor Analysis
5.1 Porter’s Five Forces Analysis
5.1.1 Bargaining Power of Suppliers
5.1.2 Bargaining Power of Buyers
5.1.3 Threat of New Entrants
5.1.4 Threat of Substitutes
5.1.5 Intensity of Rivalry
5.2 Value Chain Analysis
5.3 Investment Opportunities
5.4 Pricing Analysis
Chapter 6. Global Preimplantation Genetic Testing Market, by Procedure
6.1 Introduction
6.2 Preimplantation Genetic Diagnosis (PGD)
Market Estimates & Forecast, by Region, 2020-2027
Market Estimates & Forecast, by Country, 2020-2027
6.3 Preimplantation Genetic Screening (PGS)
Market Estimates & Forecast, by Region, 2020-2027
Market Estimates & Forecast, by Country, 2020-2027
Chapter 7. Global Preimplantation Genetic Testing Market, by Type
7.1 Introduction
7.2 Chromosomal Abnormalities
Market Estimates & Forecast, by Region, 2020-2027
Market Estimates & Forecast, by Country, 2020-2027
7.3 X-linked Diseases
Market Estimates & Forecast, by Region, 2020-2027
Market Estimates & Forecast, by Country, 2020-2027
7.4 Embryo Testing
Market Estimates & Forecast, by Region, 2020-2027
Market Estimates & Forecast, by Country, 2020-2027
7.5 Aneuploidy Screening
Market Estimates & Forecast, by Region, 2020-2027
Market Estimates & Forecast, by Country, 2020-2027
7.6 HLA Typing
Market Estimates & Forecast, by Region, 2020-2027
Market Estimates & Forecast, by Country, 2020-2027
7.7 Others
Market Estimates & Forecast, by Region, 2020-2027
Market Estimates & Forecast, by Country, 2020-2027
Chapter 8. Global Preimplantation Genetic Testing Market, by Application
8.1 Introduction
8.2 Embryo HLA typing for stem cell therapy
Market Estimates & Forecast, by Region, 2020-2027
Market Estimates & Forecast, by Country, 2020-2027
8.3 IVF Prognosis
Market Estimates & Forecast, by Region, 2020-2027
Market Estimates & Forecast, by Country, 2020-2027
8.4 Late-Onset Genetic Disorders
Market Estimates & Forecast, by Region, 2020-2027
Market Estimates & Forecast, by Country, 2020-2027
8.5 Inherited Genetic Disease
Market Estimates & Forecast, by Region, 2020-2027
Market Estimates & Forecast, by Country, 2020-2027
8.6 Others
Market Estimates & Forecast, by Region, 2020-2027
Market Estimates & Forecast, by Country, 2020-2027
Chapter 8. Global Preimplantation Genetic Testing Market, by Technology
8.1 Introduction
8.2 Next-Generation Sequencing
Market Estimates & Forecast, by Region, 2020-2027
Market Estimates & Forecast, by Country, 2020-2027
8.3 Polymerase Chain Reaction
Market Estimates & Forecast, by Region, 2020-2027
Market Estimates & Forecast, by Country, 2020-2027
8.4 Fluorescence in Situ Hybridization
Market Estimates & Forecast, by Region, 2020-2027
Market Estimates & Forecast, by Country, 2020-2027
8.4 Comparative Genomic Hybridization
Market Estimates & Forecast, by Region, 2020-2027
Market Estimates & Forecast, by Country, 2020-2027
8.4 Single-Nucleotide Polymorphism
Market Estimates & Forecast, by Region, 2020-2027
Market Estimates & Forecast, by Country, 2020-2027
Chapter 8. Global Preimplantation Genetic Testing Market, by Product and Service
8.1 Introduction
8.2 Reagents and Consumables
Market Estimates & Forecast, by Region, 2020-2027
Market Estimates & Forecast, by Country, 2020-2027
8.3 Instruments
Market Estimates & Forecast, by Region, 2020-2027
Market Estimates & Forecast, by Country, 2020-2027
8.4 Software and Services
Market Estimates & Forecast, by Region, 2020-2027
Market Estimates & Forecast, by Country, 2020-2027
Chapter 9. Global Preimplantation Genetic Testing Market, by End User
9.1 Introduction
9.2 Maternity Centers & Fertility Clinics
Market Estimates & Forecast, by Region, 2020-2027
Market Estimates & Forecast, by Country, 2020-2027
9.3 Hospitals and Diagnostic Labs
Market Estimates & Forecast, by Region, 2020-2027
Market Estimates & Forecast, by Country, 2020-2027
9.4 Research Laboratories & Academic Institutes
Market Estimates & Forecast, by Region, 2020-2027
Market Estimates & Forecast, by Country, 2020-2027
Chapter 10. Global Preimplantation Genetic Testing Market, by Region
10.1 Introduction
10.2 Americas
10.2.1 North America
10.2.1.1 US
10.2.1.2 Canada
10.2.2 South America
10.3 Europe
10.3.1 Western Europe
10.3.1.1 Germany
10.3.1.2 France
10.3.1.3 Italy
10.3.1.4 Spain
10.3.1.5 UK
10.3.1.6 Rest of Western Europe
10.3.2 Eastern Europe
10.4 Asia-Pacific
10.4.1 Japan
10.4.2 China
10.4.3 India
10.4.4 Australia
10.4.5 South Korea
10.4.6 Rest of Asia-Pacific
10.5 Middle East & Africa
10.5.1 Middle East
10.5.2 Africa
Chapter 11. Company Landscape
11.1 Introduction
11.2 Market Share Analysis
11.3 Key Development & Strategies
Chapter 12. Company Profiles
12.1 Natera, Inc.
12.1.1 Company Overview
12.1.2 Product Overview
12.1.3 Financials Overview
12.1.4 Key Developments
12.1.5 SWOT Analysis
12.2 CooperSurgical, Inc.
12.2.1 Company Overview
12.2.2 Product Overview
12.2.3 Financial Overview
12.2.4 Key Developments
12.2.5 SWOT Analysis
12.3 F. Hoffmann-La Roche AG
12.3.1 Company Overview
12.3.2 Product Overview
12.3.3 Financial Overview
12.3.4 Key Development
12.3.5 SWOT Analysis
12.4 Illumina, Inc.
12.4.1 Company Overview
12.4.2 Product Overview
12.4.3 Financial Overview
12.4.4 Key Development
12.4.5 SWOT Analysis
12.5 IGENOMIX
12.5.1 Company Overview
12.5.2 Product Overview
12.5.3 Financial overview
12.5.4 Key Developments
12.5.5 SWOT Analysis
12.6 Reprogenetics, LLC
12.6.1 Company Overview
12.6.2 Product Overview
12.6.3 Financial Overview
12.6.4 Key Developments
12.6.5 SWOT Analysis
12.7 Genea Limited
12.7.1 Overview
12.7.2 Product Overview
12.7.3 Financials
12.7.4 Key Developments
12.7.5 SWOT Analysis
12.8 PerkinElmer, Inc.
12.8.1 Overview
12.8.2 Product Overview
12.8.3 Financials
12.8.4 Key Developments
12.8.5 SWOT Analysis
12.9 Genesis Genetics Ltd.
12.9.1 Overview
12.9.2 Product Overview
12.9.3 Financials
12.9.4 Key Developments
12.9.5 SWOT Analysis
12.10 Quest Diagnostics Incorporated
12.10.1 Overview
12.10.2 Product Overview
12.10.3 Financials
12.10.4 Key Developments
12.10.5 SWOT Analysis
12.11 Thermo Fisher Scientific, Inc
12.10.1 Overview
12.10.2 Product Overview
12.10.3 Financials
12.10.4 Key Developments
12.10.5 SWOT Analysis
12.12 Bioarrayn Genetics
12.10.1 Overview
12.10.2 Product Overview
12.10.3 Financials
12.10.4 Key Developments
12.10.5 SWOT Analysis
12.13 Laboratory Corporation of America Holdings
12.10.1 Overview
12.10.2 Product Overview
12.10.3 Financials
12.10.4 Key Developments
12.10.5 SWOT Analysis
12.14 California Pacific Medical Center
12.10.1 Overview
12.10.2 Product Overview
12.10.3 Financials
12.10.4 Key Developments
12.10.5 SWOT Analysis
12.15 Reproductive Health Science Ltd
12.10.1 Overview
12.10.2 Product Overview
12.10.3 Financials
12.10.4 Key Developments
12.10.5 SWOT Analysis
12.16 Others
Chapter 12 MRFR Conclusion
12.1 Key Findings
12.1.1 From CEO’s Viewpoint
12.1.2 Unmet Needs of the Market
12.2 Key Companies to Watch
12.3 Predictions for the Global Preimplantation Genetic Testing Market
Chapter 13 Appendix
LIST OF TABLES
Table 1 Preimplantation Genetic Testing Market Synopsis, 2020-2027
Table 2 Preimplantation Genetic Testing Market Estimates and Forecast, 2020-2027(US Million)
Table 3 Global Preimplantation Genetic Testing Market, by Region, 2020-2027(USD Million)
Table 4 Global Preimplantation Genetic Testing Market, by Procedure, 2020-2027(USD Million)
Table 5 Global Preimplantation Genetic Testing Market, by Type, 2020-2027(USD Million)
Table 6 Global Preimplantation Genetic Testing Market, by Application, 2020-2027(USD Million)
Table 7 Global Preimplantation Genetic Testing Market, by Technology, 2020-2027(USD Million)
Table 8 Global Preimplantation Genetic Testing Market, by Product and Service, 2020-2027(USD Million)
Table 9 Global Preimplantation Genetic Testing Market, End User, 2020-2027(USD Million)
Table 10 North America: Preimplantation Genetic Testing Market, by Procedure, 2020-2027(US Million)
Table 11 North America: Preimplantation Genetic Testing Market, by Type, 2020-2027(USD Million)
Table 12 North America: Preimplantation Genetic Testing Market, by Application, 2020-2027(USD Million)
Table 13 North America: Preimplantation Genetic Testing Market, by Technology, 2020-2027(USD Million)
Table 14 North America: Preimplantation Genetic Testing Market, by Product and Service, 2020-2027(USD Million)
Table 15 North America: Preimplantation Genetic Testing Market, End User, 2020-2027(USD Million)
Table 16 US: Preimplantation Genetic Testing Market, by Procedure, 2020-2027(USD Million)
Table 17 US: Preimplantation Genetic Testing Market, by Type, 2020-2027(USD Million)
Table 18 US: Preimplantation Genetic Testing Market, by Application, 2020-2027(USD Million)
Table 19 US: Preimplantation Genetic Testing Market, by Technology, 2020-2027(USD Million)
Table 20 US: Preimplantation Genetic Testing Market, by Product and Service, 2020-2027(USD Million)
Table 21 US: Preimplantation Genetic Testing Market, End User, 2020-2027(USD Million)
Table 22 Canada: Preimplantation Genetic Testing Market, by Procedure, 2020-2027(USD Million)
Table 23 Canada: Preimplantation Genetic Testing Market, by Type, 2020-2027(USD Million)
Table 24 Canada Preimplantation Genetic Testing Market, by Application, 2020-2027(USD Million)
Table 25 Canada Preimplantation Genetic Testing Market, by Technology, 2020-2027(USD Million)
Table 26 Canada Preimplantation Genetic Testing Market, by Product and Service, 2020-2027(USD Million)
Table 27 Canada: Preimplantation Genetic Testing Market, End User, 2020-2027(USD Million)
Table 28 South America: Preimplantation Genetic Testing Market, by Procedure, 2020-2027(USD Million)
Table 29 South America: Preimplantation Genetic Testing Market, by Type, 2020-2027(USD Million)
Table 30 South America: Preimplantation Genetic Testing Market, by Application, 2020-2027(USD Million)
Table 31 South America: Preimplantation Genetic Testing Market, by Technology, 2020-2027(USD Million)
Table 32 South America: Preimplantation Genetic Testing Market, by Product and Service, 2020-2027(USD Million)
Table 33 South America: Preimplantation Genetic Testing Market, End User, 2020-2027(USD Million)
Table 34 Europe: Preimplantation Genetic Testing Market, by Procedure, 2020-2027(USD Million)
Table 35 Europe: Preimplantation Genetic Testing Market, by Type, 2020-2027(USD Million)
Table 36 Europe Preimplantation Genetic Testing Market, by Application, 2020-2027(USD Million)
Table 37 Europe Preimplantation Genetic Testing Market, by Technology, 2020-2027(USD Million)
Million)
Table 38 Europe Preimplantation Genetic Testing Market, by Product and Service, 2020-2027(USD Million)
Table 39 Europe: Preimplantation Genetic Testing Market, End User, 2020-2027(USD Million)
Table 40 Western Europe: Preimplantation Genetic Testing Market, by Procedure, 2020-2027(USD Million)
Table 41 Western Europe: Preimplantation Genetic Testing Market, by Type, 2020-2027(USD Million)
Table 42 Western Europe: Preimplantation Genetic Testing Market, by Application, 2020-2027(USD Million)
Table 43 Western Europe: Preimplantation Genetic Testing Market, by Technology, 2020-2027(USD Million)
Table 44 Western Europe: Preimplantation Genetic Testing Market, by Product and Service, 2020-2027(USD Million)
Table 45 Western Europe: Preimplantation Genetic Testing Market, by End User, 2020-2027(USD Million)
Table 46 Eastern Europe: Preimplantation Genetic Testing Market, by Procedure, 2020-2027(USD Million)
Table 47 Eastern Europe: Preimplantation Genetic Testing Market, by Type, 2020-2027(USD Million)
Table 48 Eastern Europe Preimplantation Genetic Testing Market, by Application, 2020-2027(USD Million)
Table 49 Eastern Europe Preimplantation Genetic Testing Market, by Technology, 2020-2027(USD Million)
Table 50 Eastern Europe Preimplantation Genetic Testing Market, by Product and Service, 2020-2027(USD Million)
Table 51 Eastern Europe: Preimplantation Genetic Testing Market, End User, 2020-2027(USD Million)
Table 52 Asia-Pacific: Preimplantation Genetic Testing Market, by Procedure, 2020-2027(USD Million)
Table 53 Asia-Pacific: Preimplantation Genetic Testing Market, by Type, 2020-2027(USD Million)
Table 54 Asia-Pacific: Preimplantation Genetic Testing Market, by Application, 2020-2027(USD Million)
Table 55 Asia-Pacific: Preimplantation Genetic Testing Market, by Technology, 2020-2027(USD Million)
Table 56 Asia-Pacific: Preimplantation Genetic Testing Market, by Product and Service, 2020-2027(USD Million)
Table 57 Asia-Pacific: Preimplantation Genetic Testing Market, End User, 2020-2027(USD Million)
Table 58 Middle East & Africa: Preimplantation Genetic Testing Market, by Procedure, 2020-2027(USD Million)
Table 59 Middle East & Africa: Preimplantation Genetic Testing Market, by Type, 2020-2027(USD Million)
Table 60 Middle East & Africa: Preimplantation Genetic Testing Market, by Application, 2020-2027(USD Million)
Table 61 Middle East & Africa: Preimplantation Genetic Testing Market, by Technology, 2020-2027(USD Million)
Table 62 Middle East & Africa: Preimplantation Genetic Testing Market, by Product and Service, 2020-2027(USD Million)
Table 63 Middle East & Africa: Preimplantation Genetic Testing Market, End User, 2020-2027(UD Million)
LIST OF FIGURES
Figure 1 Research Process
Figure 2 Segmentation for Global Preimplantation Genetic Testing Market
Figure 3 Market Dynamics for Global Preimplantation Genetic Testing Market
Figure 4 Preimplantation Genetic Testing Market Share, by Type, 2020
Figure 5 Preimplantation Genetic Testing Market Share, by Treatment, 2020
Figure 6 Preimplantation Genetic Testing Market Share, End User, 2020
Figure 7 Preimplantation Genetic Testing Market Share, by Region, 2020
Figure 8 North America: Preimplantation Genetic Testing Market Share, by Country, 2020
Figure 9 Europe: Preimplantation Genetic Testing Market Share, by Country, 2020
Figure 10 Asia-Pacific: Preimplantation Genetic Testing Market Share, by Country, 2020
Figure 11 Middle East & Africa: Preimplantation Genetic Testing Market Share, by Region, 2020
Figure 12 Preimplantation Genetic Testing Market: Company Share Analysis, 2020 (%)
Figure 13 Natera, Inc.: Key Financials
Figure 14 Natera, Inc.: Segmental Revenue
Figure 15 Natera, Inc.: Geographical Revenue
Figure 16 CooperSurgical, Inc.: Key Financials
Figure 17 CooperSurgical, Inc.: Segmental Revenue
Figure 18 CooperSurgical, Inc.: Geographical Revenue
Figure 19 F. Hoffmann-La Roche AG: Key Financials
Figure 20 F. Hoffmann-La Roche AG: Segmental Revenue
Figure 21 F. Hoffmann-La Roche AG: Geographical Revenue
Figure 22 Illumina, Inc.: Key Financials
Figure 23 Illumina, Inc.: Segmental Revenue
Figure 24 Illumina, Inc.: Geographical Revenue
Figure 25 IGENOMIX: Key Financials
Figure 26 IGENOMIX: Segmental Revenue
Figure 27 IGENOMIX: Geographical Revenue
Figure 28 Reprogenetics, LLC: Key Financials
Figure 29 Reprogenetics, LLC: Segmental Revenue
Figure 30 Reprogenetics, LLC: Geographical Revenue
Figure 31 Genea Limited: Key Financials
Figure 32 Genea Limited: Segmental Revenue
Figure 33 Genea Limited: Geographical Revenue
Figure 34 PerkinElmer, Inc.: Key Financials
Figure 35 PerkinElmer, Inc.: Segmental Revenue
Figure 36 PerkinElmer, Inc.: Geographical Revenue
Figure 37 Genesis Genetics Ltd.: Key Financials
Figure 38 Genesis Genetics Ltd.: Segmental Revenue
Figure 39 Genesis Genetics Ltd.: Geographical Revenue
Figure 40 Quest Diagnostics Incorporated: Key Financials
Figure 41 Quest Diagnostics Incorporated: Segmental Revenue
Figure 42 Quest Diagnostics Incorporated: Geographical Revenue
Figure 43 Thermo Fisher Scientific, Inc: Key Financials
Figure 44 Thermo Fisher Scientific, Inc: Segmental Revenue
Figure 45 Thermo Fisher Scientific, Inc: Geographical Revenue
Figure 46 Bioarrayn Genetics: Key Financials
Figure 47 Bioarrayn Genetics: Segmental Revenue
Figure 48 Bioarrayn Genetics: Geographical Revenue
Figure 49 Laboratory Corporation of America Holdings: Key Financials
Figure 50 Laboratory Corporation of America Holdings: Segmental Revenue
Figure 51 Laboratory Corporation of America Holdings: Geographical Revenue
Figure 52 California Pacific Medical Center: Key Financials
Figure 53 California Pacific Medical Center: Segmental Revenue
Figure 54 California Pacific Medical Center: Geographical Revenue
Figure 55 Reproductive Health Science Ltd: Key Financials
Figure 56 Reproductive Health Science Ltd: Segmental Revenue
Figure 57 Reproductive Health Science Ltd: Geographical Revenue
This table of content is tentative and subject to change as the research progresses.
Please Note: Financial details of company cannot be provided if the information of the company is not available in public domain and or reliable source.