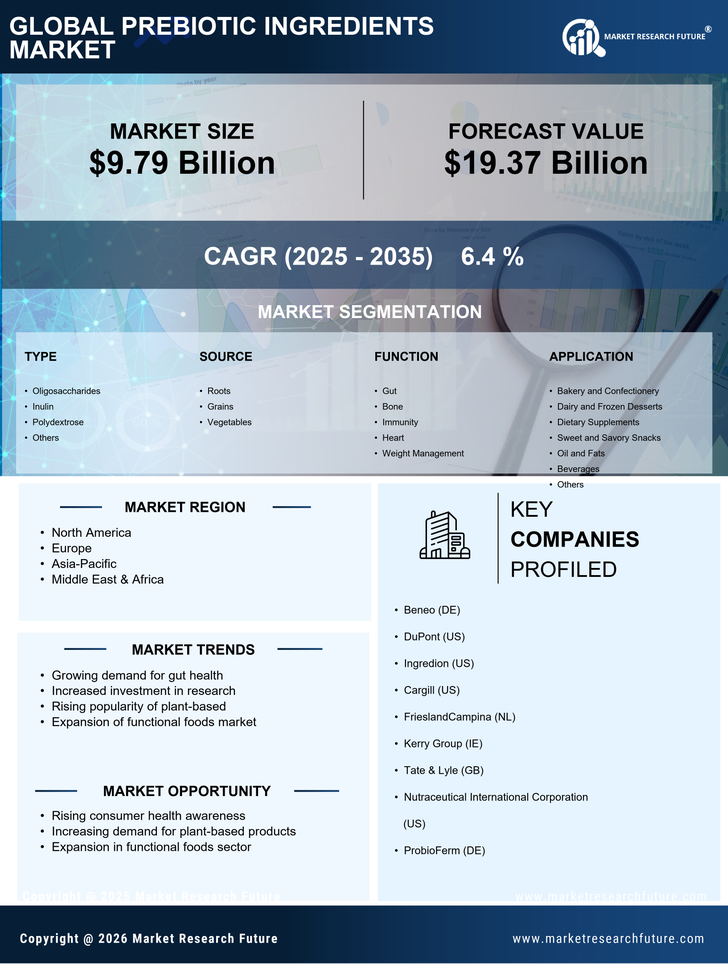
Certified Global Research Member
Isomar fd.webp Wcrc 57.webp
Key Questions Answered
  • Global Market Outlook
  • In-depth analysis of global and regional trends
  • Analyze and identify the major players in the market, their market share, key developments, etc.
  • To understand the capability of the major players based on products offered, financials, and strategies.
  • Identify disrupting products, companies, and trends.
  • To identify opportunities in the market.
  • Analyze the key challenges in the market.
  • Analyze the regional penetration of players, products, and services in the market.
  • Comparison of major players’ financial performance.
  • Evaluate strategies adopted by major players.
  • Recommendations
Why Choose Market Research Future?
  • Vigorous research methodologies for specific market.
  • Knowledge partners across the globe
  • Large network of partner consultants.
  • Ever-increasing/ Escalating data base with quarterly monitoring of various markets
  • Trusted by fortune 500 companies/startups/ universities/organizations
  • Large database of 5000+ markets reports.
  • Effective and prompt pre- and post-sales support.

Prebiotic Ingredients Market Research Report Information By Type (Oligosaccharides, Inulin, Polydextrose, and Others), By Source (Roots, Grains, and Vegetables), By Functions (Gut, Bone, Immunity, Heart, and Weight Management), By Applications (Bakery and Confectionery, Dairy and Frozen Desserts, Dietary Supplements, Sweet and Savory Snacks, Oil And Fats, Beverages, and Others) And By Region (North America, Europe, Asia-Pacific, And Rest Of The World) – Market Forecast Till 2030


ID: MRFR/F-B & N/3582-HCR | 110 Pages | Author: Tejas Chaudhary| April 2024
Leading companies partner with us for data-driven Insights
client_1 client_2 client_3 client_4 client_5 client_6 client_7 client_8 client_9 client_10
Please fill in Business Email for Quick Response

Table of Content

Chapter 1. Methodology and Scope

1.1. Research Methodology

1.1.1 Initial Data Exploration

1.1.2 Statistical Modelling and Forecast

1.1.3 Industry Insights and Validation

1.2. Data Sources

Chapter 2. Executive Summary

2.1. Prebiotic ingredients Industry Market Synopsis, 2022-2030

2.1.1 Business Trends

2.1.2 Product Type Trends

2.1.3 Product Source Trends

2.1.4 Product Function Trends

2.1.5 Product Application Trends

Chapter 3 Prebiotic ingredients market Industry Insights

3.1 Industry Segmentation

3.2 Industry Size and Forecast

3.3 Industry Ecosystem Analysis

3.4 Industry Impact forces

3.4.1 Growth Drivers

3.4.1.1 Increasing demand for functional foods

3.4.1.2 Growing health issues

3.4.2 Industry Pitfalls & Challenges

3.4.2.1 Larger market of probiotics

3.4.2.2 Stringent government regulations

3.5 Growth Potential Analysis

3.6 Company Market Share Analysis, 2022

3.7 Porter’s analysis

3.8 PESTEL analysis

Chapter 4 Prebiotic ingredients market by Type Insights

4.1 Global Prebiotic ingredients Market Volume Share by Type, 2022-2030

4.1.1 Oligosaccharides

4.1.1.1 Market Estimates & Forecast, 2022-2030

4.1.2 Inulin

4.1.2.1 Market Estimates & Forecast, 2022-2030

4.1.3 Polydextrose

4.1.3.1 Market Estimates & Forecast, 2022-2030

4.1.4 Others

4.1.4.1 Market Estimates & Forecast, 2022-2030

Chapter 5 Prebiotic ingredients market by Source Insights

5.1 Global Prebiotic ingredients Market Volume Share by Source, 2022-2030

5.1.1 Roots

5.1.1.1 Market Estimates & Forecast, 2022-2030

5.1.2 Grains

5.1.2.1 Market Estimates & Forecast, 2022-2030

5.1.3 Vegetables

5.1.3.1 Market Estimates & Forecast, 2022-2030

5.1.4 Others

5.1.4.1 Market Estimates & Forecast, 2022-2030

Chapter 6 Prebiotic ingredients market by Function Insights

6.1 Global Prebiotic ingredients Market Volume Share by Function, 2022-2030

6.1.1 Gut health

6.1.1.1 Market Estimates & Forecast, 2022-2030

6.1.2 Bone health

6.1.2.1 Market Estimates & Forecast, 2022-2030

6.1.3 Immunity

6.1.3.1 Market Estimates & Forecast, 2022-2030

6.1.4 Heart health

6.1.4.1 Market Estimates & Forecast, 2022-2030

6.1.5 Weight management

6.1.5.1 Market Estimates & Forecast, 2022-2030

Chapter 7 Prebiotic ingredients market by Application Insights

7.1 Global Prebiotic ingredients Market Volume Share by Application, 2022-2030

7.1.1 Bakery and Confectionery

7.1.1.1 Market Estimates & Forecast, 2022-2030

7.1.1.2 Market Estimates & Forecast by Region, 2022-2030

7.1.2 Dairy and frozen desserts

7.1.2.1 Market Estimates & Forecast, 2022-2030

7.1.2.2 Market Estimates & Forecast by Region, 2022-2030

7.1.3 Dietary supplements

7.1.3.1 Market Estimates & Forecast, 2022-2030

7.1.3.2 Market Estimates & Forecast by Region, 2022-2030

7.1.4 Beverages

7.1.4.1 Market Estimates & Forecast, 2022-2030

7.1.4.2 Market Estimates & Forecast by Region, 2022-2030

7.1.5 Oils and fats

7.1.5.1 Market Estimates & Forecast, 2022-2030

7.1.5.2 Market Estimates & Forecast by Region, 2022-2030

7.1.6 Sweet and savory snacks

7.1.6.1 Market Estimates & Forecast, 2022-2030

7.1.6.2 Market Estimates & Forecast by Region, 2022-2030

7.1.7 Others

7.1.7.1 Market Estimates & Forecast, 2022-2030

7.1.7.2 Market Estimates & Forecast by Region, 2022-2030

Chapter 8 Prebiotic ingredients market Regional Insights

8.1 Prebiotic ingredients Market Volume Share by Region, 2022-2030.

8.2 North America

8.2. A Market Estimates & Forecast, 2022-2030

8.2. B Market Estimates & Forecast, by Type, 2022-2030

8.2. C Market Estimates & Forecast, by Source, 2022-2030

8.2. D Market Estimates & Forecast, by Function, 2022-2030

8.2. E Market Estimates & Forecast, by Application, 2022-2030

8.2.1 U.S.

8.2.1.1 Market Estimates & Forecast, 2022-2030

8.2.1.2 Market Estimates & Forecast, by Type, 2022-2030

8.2.1.3 Market Estimates & Forecast, by Source, 2022-2030

8.2.1.4 Market Estimates & Forecast, by Function, 2022-2030

8.2.1.5 Market Estimates & Forecast, by Application, 2022-2030

8.2.2 Canada

8.2.2.1 Market Estimates & Forecast, 2022-2030

8.2.2.2 Market Estimates & Forecast, by Type, 2022-2030

8.2.2.3 Market Estimates & Forecast, by Source, 2022-2030

8.2.2.4 Market Estimates & Forecast, by Function, 2022-2030

8.2.2.5 Market Estimates & Forecast, by Application, 2022-2030

8.2.3 Mexico

8.2.3.1 Market Estimates & Forecast, 2022-2030

8.2.3.2 Market Estimates & Forecast, by Type, 2022-2030

8.2.3.3 Market Estimates & Forecast, by Source, 2022-2030

8.2.3.4 Market Estimates & Forecast, by Function, 2022-2030

8.2.3.5 Market Estimates & Forecast, by Application, 2022-2030

8.3 Europe

8.3. A Market Estimates & Forecast, 2022-2030

8.3. B Market Estimates & Forecast, by Type, 2022-2030

8.3. C Market Estimates & Forecast, by Source, 2022-2030

8.3. D Market Estimates & Forecast, by Function, 2022-2030

8.3. E Market Estimates & Forecast, by Application, 2022-2030

8.3.1 Germany

8.3.1.1 Market Estimates & Forecast, 2022-2030

8.3.1.2 Market Estimates & Forecast, by Type, 2022-2030

8.3.1.3 Market Estimates & Forecast, by Source, 2022-2030

8.3.1.4 Market Estimates & Forecast, by Function, 2022-2030

8.3.1.5 Market Estimates & Forecast, by Application, 2022-2030

8.3.2 UK

8.3.2.1 Market Estimates & Forecast, 2022-2030

8.3.2.2 Market Estimates & Forecast, by Type, 2022-2030

8.3.2.3 Market Estimates & Forecast, by Source, 2022-2030

8.3.2.4 Market Estimates & Forecast, by Function, 2022-2030

8.3.2.5 Market Estimates & Forecast, by Application, 2022-2030

8.3.3 France

8.3.3.1 Market Estimates & Forecast, 2022-2030

8.3.3.2 Market Estimates & Forecast, by Type, 2022-2030

8.3.3.3 Market Estimates & Forecast, by Source, 2022-2030

8.3.3.4 Market Estimates & Forecast, by Function, 2022-2030

8.3.3.5 Market Estimates & Forecast, by Application, 2022-2030

8.3.4 Italy

8.3.4.1 Market Estimates & Forecast, 2022-2030

8.3.4.2 Market Estimates & Forecast, by Type, 2022-2030

8.3.4.3 Market Estimates & Forecast, by Source, 2022-2030

8.3.4.4 Market Estimates & Forecast, by Function, 2022-2030

8.3.4.5 Market Estimates & Forecast, by Application, 2022-2030

8.4 Asia Pacific

8.4. A Market Estimates & Forecast, 2022-2030

8.4. B Market Estimates & Forecast, by Type, 2022-2030

8.4. C Market Estimates & Forecast, by Source, 2022-2030

8.4. D Market Estimates & Forecast, by Function, 2022-2030

8.4. E Market Estimates & Forecast, by Application, 2022-2030

8.4.1 China

8.4.1.1 Market Estimates & Forecast, 2022-2030

8.4.1.2 Market Estimates & Forecast, by Type, 2022-2030

8.4.1.3 Market Estimates & Forecast, by Source, 2022-2030

8.4.1.4 Market Estimates & Forecast, by Function, 2022-2030

8.4.1.5 Market Estimates & Forecast, by Application, 2022-2030

8.4.2 India

8.4.2.1 Market Estimates & Forecast, 2022-2030

8.4.2.2 Market Estimates & Forecast, by Type, 2022-2030

8.4.2.3 Market Estimates & Forecast, by Source, 2022-2030

8.4.2.4 Market Estimates & Forecast, by Function, 2022-2030

8.4.2.5 Market Estimates & Forecast, by Application, 2022-2030

8.4.3 Japan

8.4.3.1 Market Estimates & Forecast, 2022-2030

8.4.3.2 Market Estimates & Forecast, by Type, 2022-2030

8.4.3.3 Market Estimates & Forecast, by Source, 2022-2030

8.4.3.4 Market Estimates & Forecast, by Function, 2022-2030

8.4.3.5 Market Estimates & Forecast, by Application, 2022-2030

8.5 RoW

8.5. A Market Estimates & Forecast, 2022-2030

8.5. B Market Estimates & Forecast, by Type, 2022-2030

8.5. C Market Estimates & Forecast, by Source, 2022-2030

8.5. D Market Estimates & Forecast, by Function, 2022-2030

8.5. E Market Estimates & Forecast, by Application, 2022-2030

Chapter 8 Competitor Profile

8.1 Cargill, Incorporated (U.S.)

8.1.1 Business Overview

8.1.2 Financial Data

8.1.3 Product Landscape

8.1.4 Key Developments

8.1.5 Business Strategy

8.1.6 SWOT Analysis

8.2 DuPont (U.S.)

8.2.1 Business Overview

8.2.2 Financial Data

8.2.3 Product Landscape

8.2.4 Key Developments

8.2.5 Business Strategy

8.2.6 SWOT Analysis

8.3 BENEO GmbH (Germany)

8.3.1 Business Overview

8.3.2 Financial Data

8.3.3 Product Landscape

8.3.4 Key Developments

8.3.5 Business Strategy

8.3.6 SWOT Analysis

8.4 Friesland Campina (The Netherlands)

8.4.1 Business Overview

8.4.2 Financial Data

8.4.3 Product Landscape

8.4.4 Key Developments

8.4.5 Business Strategy

8.4.6 SWOT Analysis

8.5 Ingredion Incorporated (U.S.)

8.5.1 Business Overview

8.5.2 Financial Data

8.5.3 Product Landscape

8.5.4 Key Developments

8.5.5 Business Strategy

8.5.6 SWOT Analysis

8.6 Nexira (France)

8.6.1 Business Overview

8.6.2 Financial Data

8.6.3 Product Landscape

8.6.4 Key Developments

8.6.5 Business Strategy

8.6.6 SWOT Analysis

8.7 Samyang Genex (Korea)

8.7.1 Business Overview

8.7.2 Financial Data

8.7.3 Product Landscape

8.7.4 Key Developments

8.7.5 Business Strategy

8.7.6 SWOT Analysis

Data Tables

TABLE 1 PESTLE ANALYSIS – U.S.

TABLE 2 PESTLE ANALYSIS- JAPAN

TABLE 3 PESTLE ANALYSIS- CHINA

TABLE 4 PESTLE ANALYSIS- FRANCE

TABLE 5 PESTLE ANALYSIS- GERMANY

TABLE 6 KEY SUPPLIERS OF PREBIOTIC INGREDIENTS MARKET

TABLE 7 GLOBAL MARKET FOR PREBIOTIC INGREDIENTS MARKET, BY TYPE, (2022-2030), USD MILLION

TABLE 8 GLOBAL MARKET FOR PREBIOTIC INGREDIENTS MARKET, BY SOURCE, (2022-2030), USD MILLION

TABLE 9 GLOBAL MARKET FOR PREBIOTIC INGREDIENTS MARKET, BY FUNCTION, (2022-2030), USD MILLION

TABLE 10 GLOBAL MARKET FOR PREBIOTIC INGREDIENTS MARKET, BY APPLICATION, (2022-2030), USD MILLION

TABLE 11 GLOBAL PREBIOTIC INGREDIENTS MARKET SALES AND GROWTH RATE (2022-2030) USD MILLION

TABLE 12 GLOBAL MARKET FOR PREBIOTIC INGREDIENTS MARKET TOP 5 COUNTRIES

TABLE 13 GLOBAL MARKET FOR PREBIOTIC INGREDIENTS MARKET TOP COMPANIES-USD MILLION

TABLE 14 NORTH AMERICAN GLOBAL MARKET FOR PREBIOTIC INGREDIENTS MARKET, BY TYPE, (2022-2030) USD MILLION

TABLE 15 NORTH AMERICAN MARKET FOR PREBIOTIC INGREDIENTS MARKET, BY SOURCE, (2022-2030), USD MILLION

TABLE 16 NORTH AMERICAN MARKET FOR PREBIOTIC INGREDIENTS MARKET, BY FUNCTION, (2022-2030), USD MILLION

TABLE 17 NORTH AMERICAN MARKET FOR PREBIOTIC INGREDIENTS MARKET, BY APPLICATION, (2022-2030), USD MILLION

TABLE 18 EUROPEAN GLOBAL MARKET FOR PREBIOTIC INGREDIENTS MARKET, BY TYPE, (2022-2030) USD MILLION

TABLE 19 EUROPEAN MARKET FOR PREBIOTIC INGREDIENTS MARKET, BY SOURCE, (2022-2030), USD MILLION

TABLE 20 EUROPEAN MARKET FOR PREBIOTIC INGREDIENTS MARKET, BY FUNCTION, (2022-2030), USD MILLION

TABLE 21 EUROPEAN MARKET FOR PREBIOTIC INGREDIENTS MARKET, BY APPLICATION, (2022-2030), USD MILLION

TABLE 22 APAC GLOBAL MARKET FOR PREBIOTIC INGREDIENTS MARKET, BY TYPE, (2022-2030) USD MILLION

TABLE 23 APAC MARKET FOR PREBIOTIC INGREDIENTS MARKET, BY SOURCE, (2022-2030), USD MILLION

TABLE 24 APAC MARKET FOR PREBIOTIC INGREDIENTS MARKET, BY FUNCTION, (2022-2030), USD MILLION

TABLE 25 APAC MARKET FOR PREBIOTIC INGREDIENTS MARKET, BY APPLICATION, (2022-2030), USD MILLION

TABLE 26 REST OF THE WORLD MARKET FOR PREBIOTIC INGREDIENTS MARKET, BY TYPE, (2022-2030) USD MILLION

TABLE 27 REST OF THE WORLD MARKET FOR PREBIOTIC INGREDIENTS MARKET, BY SOURCE, (2022-2030), USD MILLION

TABLE 28 REST OF THE WORLD MARKET FOR PREBIOTIC INGREDIENTS MARKET, BY FUNCTION, (2022-2030), USD MILLION

TABLE 29 REST OF THE WORLD MARKET FOR PREBIOTIC INGREDIENTS MARKET, BY APPLICATION, (2022-2030), USD MILLION

TABLE 30 COMPETITIVE LANDSCAPING BASED ON FINACIALS DURING THE YEAR 2022 

Charts & Figures

LIST OF FIGURES

FIGURE 1 RESEARCH METHODOLOGY

FIGURE 2 PRIMARY DATA ANALYSIS APPROACH

FIGURE 3 SECONDARY DATA ANALYSIS APPROACH

FIGURE 4 TRENDS IN PREBIOTIC INGREDIENTS MARKET IMPORTS 2022

FIGURE 5 GROWTH RATE IN PREBIOTIC INGREDIENTS MARKET IMPORTS 2022

FIGURE 6 PREBIOTIC INGREDIENTS MARKET IMPORTS MARKET SHARE BY TOP 5 IMPORTERS (2022)

FIGURE 7 TRENDS IN PREBIOTIC INGREDIENTS MARKET EXPORTS 2022

FIGURE 8 GROWTH RATE PREBIOTIC INGREDIENTS MARKET EXPORTS 2022

FIGURE 9 PREBIOTIC INGREDIENTS MARKET EXPORTS MARKET SHARE BY TOP 5 EXPORTERS (2022)

FIGURE 10 VALUE CHAIN ANALYSIS

FIGURE 11 COST ANALYSIS: PREBIOTIC INGREDIENTS MARKET

FIGURE 12 PORTER’S FIVE FORCES ANALYSIS

FIGURE 13 GLOBAL MARKET FOR PREBIOTIC INGREDIENTS MARKET TRENDS BY TYPE

FIGURE 14 GLOBAL MARKET FOR PREBIOTIC INGREDIENTS MARKET TRENDS BY SOURCE

FIGURE 15 GLOBAL MARKET FOR PREBIOTIC INGREDIENTS MARKET TRENDS BY FUNCTION

FIGURE 16 GLOBAL MARKET FOR PREBIOTIC INGREDIENTS MARKET TRENDS BY APPLICATION

FIGURE 17 FINANCIALS

Purchase Option
Single User $ 4,950
Multiuser License $ 5,950
Enterprise User $ 7,250
Compare Licenses
Tailored for You
  • Dedicated Research on any specifics segment or region.
  • Focused Research on specific players in the market.
  • Custom Report based only on your requirements.
  • Flexibility to add or subtract any chapter in the study.
  • Historic data from 2014 and forecasts outlook till 2040.
  • Flexibility of providing data/insights in formats (PDF, PPT, Excel).
  • Provide cross segmentation in applicable scenario/markets.