ID: MRFR/E&P/9205-CR | September 2021 | Region: Global | 188 Pages
TABLE OF CONTENTS
1 EXECUTIVE SUMMARY 14
1.1 MARKET ATTRACTIVENESS ANALYSIS 16
1.1.1 GLOBAL POWER T&D EQUIPMENT MARKET, BY TYPE 17
1.1.2 GLOBAL POWER T&D EQUIPMENT MARKET, BY APPLICATION 18
1.1.3 GLOBAL POWER T&D EQUIPMENT MARKET, BY REGION 19
2 MARKET INTRODUCTION 20
2.1 DEFINITIONS 20
2.2 SCOPE OF THE STUDY 20
2.3 RESEARCH OBJECTIVE 20
2.4 MARKET STRUCTURE 21
2.5 KEY BUYING CRITERIA 21
3 RESEARCH METHODOLOGY 22
3.1 RESEARCH PROCESS 22
3.2 PRIMARY RESEARCH 23
3.3 SECONDARY RESEARCH 24
3.4 MARKET SIZE ESTIMATION 25
3.5 FORECAST MODEL 26
3.6 LIST OF ASSUMPTIONS 26
4 MARKET INSIGHTS 27
5 MARKET DYNAMICS 30
5.1 INTRODUCTION 30
5.2 DRIVERS 31
5.2.1 RISING DEMAND FOR ELECTRICITY 31
5.2.2 GROWING INVESTMENTS IN T&D INFRASTRUCTURE 31
5.3 RESTRAINT 32
5.3.1 HIGH INITIAL COST 32
5.4 OPPORTUNITY 32
5.4.1 AGING T&D INFRASTRUCTURE IN DEVELOPING COUNTRIES 32
5.5 IMPACT ANALYSIS OF COVID-19 33
5.5.1 IMPACT ON THE OVERALL ENERGY & POWER INDUSTRY 33
5.5.2 ECONOMIC IMPACT 33
5.5.3 IMPACT ON POWER TRANSMISSION & DISTRIBUTION (T&D) EQUIPMENT MARKET 33
5.5.4 IMPACT ON SUPPLY CHAIN OF POWER T&D EQUIPMENT 33
5.5.4.1 PRICE VARIATION OF KEY RAW MATERIALS 33
5.5.4.2 PRODUCTION SHUTDOWN 34
5.5.4.3 CASH FLOW CONSTRAINTS 34
5.5.4.4 IMPACT ON IMPORT/EXPORT 34
5.5.5 IMPACT ON MARKET DEMAND OF POWER T&D EQUIPMENT 34
5.5.5.1 IMPACT DUE TO LOCKDOWN 34
5.5.5.2 CONSUMER SENTIMENTS 34
5.5.5.3 IMPACT ON PRICING OF POWER T&D EQUIPMENT 34
6 MARKET FACTOR ANALYSIS 35
6.1 SUPPLY CHAIN ANALYSIS 35
6.1.1 RAW MATERIAL & COMPONENT SUPPLY 35
6.1.2 MANUFACTURE & ASSEMBLY 36
6.1.3 END USER 36
6.2 PORTER’S FIVE FORCES MODEL 36
6.2.1 THREAT OF NEW ENTRANTS 37
6.2.2 BARGAINING POWER OF SUPPLIERS 37
6.2.3 THREAT OF SUBSTITUTES 37
6.2.4 BARGAINING POWER OF BUYERS 37
6.2.5 INTENSITY OF RIVALRY 37
7 GLOBAL POWER T&D EQUIPMENT MARKET, BY TYPE 38
7.1 OVERVIEW 38
7.2 TRANSFORMER 40
7.3 SWITCHGEAR 40
7.4 CIRCUIT BREAKER 40
7.5 INDUCTOR & CAPACITORS 40
7.6 METERS 41
7.7 FUSES & EQUIPMENT 41
8 GLOBAL POWER T&DEQUIPMENT MARKET, BY APPLICATION 42
8.1 OVERVIEW 42
8.2 UTILITY 43
8.3 COMMERCIAL 43
8.4 RESIDENTIAL 44
8.5 INDUSTRIAL 44
8.6 OTHERS 44
9 GLOBAL POWER T&D EQUIPMENT MARKET, BY REGION 45
9.1 OVERVIEW 45
9.2 NORTH AMERICA 47
9.2.1 US 48
9.2.2 CANADA 49
9.2.3 MEXICO 50
9.3 EUROPE 52
9.3.1 GERMANY 53
9.3.2 UK 54
9.3.3 FRANCE 56
9.3.4 ITALY 57
9.3.5 REST OF EUROPE 58
9.4 ASIA-PACIFIC 60
9.4.1 CHINA 62
9.4.2 JAPAN 63
9.4.3 INDIA 64
9.4.4 SOUTH KOREA 66
9.4.5 REST OF ASIA-PACIFIC 67
9.5 MIDDLE EAST & AFRICA 69
9.5.1 SAUDI ARABIA 71
9.5.2 UAE 72
9.5.3 SOUTH AFRICA 73
9.5.4 REST OF MIDDLE EAST & AFRICA 74
9.6 SOUTH AMERICA 76
9.6.1 BRAZIL 77
9.6.2 ARGENTINA 79
9.6.3 REST OF SOUTH AMERICA 80
10 COMPETITIVE LANDSCAPE 82
10.1 COMPETITIVE OVERVIEW 82
10.2 COMPETITIVE BENCHMARKING 83
10.3 MARKET SHARE ANALYSIS 84
11 COMPANY PROFILES 85
11.1 HITACHI ABB POWER GRIDS. 85
11.1.1 COMPANY OVERVIEW 85
11.1.2 FINANCIAL OVERVIEW 86
11.1.3 PRODUCTS OFFERED 87
11.1.4 KEY DEVELOPMENTS 87
11.1.5 SWOT ANALYSIS 88
11.1.6 KEY STRATEGIES 89
11.2 SCHNEIDER ELECTRIC 90
11.2.1 COMPANY OVERVIEW 90
11.2.2 FINANCIAL OVERVIEW 91
11.2.3 PRODUCTS OFFERED 92
11.2.4 KEY DEVELOPMENTS 93
11.2.5 SWOT ANALYSIS 93
11.2.6 KEY STRATEGIES 93
11.3 SIEMENS 94
11.3.1 COMPANY OVERVIEW 94
11.3.2 FINANCIAL OVERVIEW 95
11.3.3 PRODUCTS OFFERED 95
11.3.4 KEY DEVELOPMENTS 96
11.3.5 SWOT ANALYSIS 97
11.3.6 KEY STRATEGIES 97
11.4 EATON CORPORATION 98
11.4.1 COMPANY OVERVIEW 98
11.4.2 FINANCIAL OVERVIEW 99
11.4.3 PRODUCTS OFFERED 99
11.4.4 KEY DEVELOPMENTS 100
11.4.5 SWOT ANALYSIS 101
11.4.6 KEY STRATEGIES 101
11.5 MITSUBISHI ELECTRIC CORPORATION 102
11.5.1 COMPANY OVERVIEW 102
11.5.2 FINANCIAL OVERVIEW 103
11.5.3 PRODUCTS OFFERED 103
11.5.4 KEY DEVELOPMENTS 104
11.5.5 SWOT ANALYSIS 104
11.5.6 KEY STRATEGIES 105
11.6 HAMMOND POWER SOLUTIONS 106
11.6.1 COMPANY OVERVIEW 106
11.6.2 FINANCIAL OVERVIEW 107
11.6.3 PRODUCTS OFFERED 108
11.6.4 KEY DEVELOPMENTS 108
11.6.5 KEY STRATEGIES 108
11.7 TOSHIBA CORPORATION 109
11.7.1 COMPANY OVERVIEW 109
11.7.2 FINANCIAL OVERVIEW 110
11.7.3 PRODUCTS/SERVICES OFFERED 111
11.7.4 KEY DEVELOPMENTS 112
11.7.5 SWOT ANALYSIS 112
11.7.6 KEY STRATEGIES 112
11.8 GENERAL ELECTRIC 113
11.8.1 COMPANY OVERVIEW 113
11.8.2 FINANCIAL OVERVIEW 114
11.8.3 PRODUCTS/SERVICES OFFERED 115
11.8.4 KEY DEVELOPMENTS 116
11.8.5 SWOT ANALYSIS 116
11.8.6 KEY STRATEGIES 116
11.9 TE CONNECTIVITY 117
11.9.1 COMPANY OVERVIEW 117
11.9.2 FINANCIAL OVERVIEW 118
11.9.3 PRODUCTS/SERVICES OFFERED 118
11.9.4 KEY DEVELOPMENTS 119
11.9.5 KEY STRATEGIES 119
11.10 POWELL INDUSTRIES INC. 120
11.10.1 COMPANY OVERVIEW 120
11.10.2 FINANCIAL OVERVIEW 120
11.10.3 PRODUCTS/SERVICES OFFERED 121
11.10.4 KEY DEVELOPMENTS 121
11.10.5 KEY STRATEGIES 122
11.11 FUJI ELECTRIC CO. LTD 123
11.11.1 COMPANY OVERVIEW 123
11.11.2 FINANCIAL OVERVIEW 124
11.11.3 PRODUCTS/SOLUTIONS/SERVICES OFFERED 125
11.11.4 KEY DEVELOPMENTS 126
11.12 BHARAT HEAVY ELECTRICALS LIMITED (BHEL) 127
11.12.1 COMPANY OVERVIEW 127
11.12.2 FINANCIAL OVERVIEW 127
11.12.3 PRODUCTS/SOLUTIONS/SERVICES OFFERED 128
11.12.4 KEY DEVELOPMENTS 130
11.13 CHINT GROUP 131
11.13.1 COMPANY OVERVIEW 131
11.13.2 FINANCIAL OVERVIEW 131
11.13.3 PRODUCTS/SOLUTIONS/SERVICES OFFERED 132
11.13.4 KEY DEVELOPMENTS 133
11.14 BASLER ELECTRIC COMPANY 134
11.14.1 COMPANY OVERVIEW 134
11.14.2 FINANCIAL OVERVIEW 134
11.14.3 PRODUCTS/SOLUTIONS/SERVICES OFFERED 134
11.14.4 KEY DEVELOPMENTS 135
11.15 CG POWER AND INDUSTRIAL SOLUTIONS LIMITED 136
11.15.1 COMPANY OVERVIEW 136
11.15.2 FINANCIAL OVERVIEW 136
11.15.3 PRODUCTS/SOLUTIONS/SERVICES OFFERED 137
11.15.4 KEY DEVELOPMENTS 137
11.16 G&W ELECTRIC 138
11.16.1 COMPANY OVERVIEW 138
11.16.2 FINANCIAL OVERVIEW 138
11.16.3 PRODUCTS/SOLUTIONS/SERVICES OFFERED 138
11.16.4 KEY DEVELOPMENTS 138
11.17 S&C ELECTRIC 139
11.17.1 COMPANY OVERVIEW 139
11.17.2 FINANCIAL OVERVIEW 139
11.17.3 PRODUCTS/SOLUTIONS/SERVICES OFFERED 139
11.17.4 KEY DEVELOPMENTS 141
11.18 ITRON 142
11.18.1 COMPANY OVERVIEW 142
11.18.2 FINANCIAL OVERVIEW 142
11.18.3 PRODUCTS/SOLUTIONS/SERVICES OFFERED 143
11.18.4 KEY DEVELOPMENTS 143
11.19 LANDIS+GYR 144
11.19.1 COMPANY OVERVIEW 144
11.19.2 FINANCIAL OVERVIEW 144
11.19.3 PRODUCTS/SOLUTIONS/SERVICES OFFERED 145
11.19.4 KEY DEVELOPMENTS 147
 
LIST OF TABLES
TABLE 1 LIST OF ASSUMPTIONS 26
TABLE 2 GLOBAL POWER T&D EQUIPMENT MARKET, BY TYPE, 2019-2027 (USD MILLION) 39
TABLE 3 GLOBAL POWER TRANSMISSION & DISTRIBUTION EQUIPMENT: MARKET ESTIMATES & FORECAST, BY APPLICATION, 2019–2027 (USD MILLION) 43
TABLE 4 GLOBAL POWER T&D EQUIPMENT MARKET, BY REGION, 2019-2027 (USD MILLION) 46
TABLE 5 NORTH AMERICA: POWER TRANSMISSION & DISTRIBUTION (T&D) EQUIPMENTMARKET, BY COUNTRY, 2019–2027 (USD MILLION) 47
TABLE 6 NORTH AMERICA: POWER TRANSMISSION & DISTRIBUTION (T&D) EQUIPMENTMARKET, BY APPLICATION, 2019–2027 (USD MILLION) 47
TABLE 7 NORTH AMERICA: POWER TRANSMISSION & DISTRIBUTION (T&D) EQUIPMENTMARKET, BY TYPE, 2019-2027 (USD MILLION) 48
TABLE 8 US: POWER TRANSMISSION & DISTRIBUTION (T&D) EQUIPMENTMARKET, BY TYPE , 2019–2027 (USD MILLION) 48
TABLE 9 US: POWER TRANSMISSION & DISTRIBUTION (T&D) EQUIPMENTMARKET, BY APPLICATION, 2019-2027 (USD MILLION) 49
TABLE 10 CANADA: POWER TRANSMISSION & DISTRIBUTION (T&D) EQUIPMENTMARKET, BY TYPE, 2019–2027 (USD MILLION) 49
TABLE 11 CANADA: POWER TRANSMISSION & DISTRIBUTION (T&D) EQUIPMENTMARKET, BY APPLICATION, 2019-2027 (USD MILLION) 50
TABLE 12 MEXICO: POWER TRANSMISSION & DISTRIBUTION (T&D) EQUIPMENTMARKET, BY TYPE, 2019–2027 (USD MILLION) 51
TABLE 13 MEXICO: POWER TRANSMISSION & DISTRIBUTION (T&D) EQUIPMENTMARKET, BY APPLICATION, 2019-2027 (USD MILLION) 51
TABLE 14 EUROPE: POWER TRANSMISSION & DISTRIBUTION (T&D) EQUIPMENTMARKET, BY COUNTRY, 2019–2027 (USD MILLION) 52
TABLE 15 EUROPE: POWER TRANSMISSION & DISTRIBUTION (T&D) EQUIPMENTMARKET, BY TYPE, 2019–2027 (USD MILLION) 52
TABLE 16 EUROPE: POWER TRANSMISSION & DISTRIBUTION (T&D) EQUIPMENTMARKET, BY APPLICATION, 2019-2027 (USD MILLION) 53
TABLE 17 GERMANY: POWER TRANSMISSION & DISTRIBUTION (T&D) EQUIPMENTMARKET, BY TYPE, 2019–2027 (USD MILLION) 53
TABLE 18 GERMANY: POWER TRANSMISSION & DISTRIBUTION (T&D) EQUIPMENTMARKET, BY APPLICATION, 2019-2027 (USD MILLION) 54
TABLE 19 UK: POWER TRANSMISSION & DISTRIBUTION (T&D) EQUIPMENTMARKET, BY TYPE, 2019–2027 (USD MILLION) 55
TABLE 20 UK: POWER TRANSMISSION & DISTRIBUTION (T&D) EQUIPMENTMARKET, BY APPLICATION, 2019-2027 (USD MILLION) 55
TABLE 21 FRANCE: POWER TRANSMISSION & DISTRIBUTION (T&D) EQUIPMENTMARKET, BY TYPE, 2019–2027 (USD MILLION) 56
TABLE 22 FRANCE: POWER TRANSMISSION & DISTRIBUTION (T&D) EQUIPMENTMARKET, BY APPLICATION, 2019-2027 (USD MILLION) 56
TABLE 23 ITALY: POWER TRANSMISSION & DISTRIBUTION (T&D) EQUIPMENTMARKET, BY TYPE, 2019–2027 (USD MILLION) 57
TABLE 24 ITALY: POWER TRANSMISSION & DISTRIBUTION (T&D) EQUIPMENTMARKET, BY APPLICATION, 2019-2027 (USD MILLION) 57
TABLE 25 REST OF EUROPE: POWER TRANSMISSION & DISTRIBUTION (T&D) EQUIPMENTMARKET, BY TYPE, 2019–2027 (USD MILLION) 58
TABLE 26 REST OF EUROPE: POWER TRANSMISSION & DISTRIBUTION (T&D) EQUIPMENTMARKET, BY APPLICATION, 2019-2027 (USD MILLION) 59
TABLE 27 ASIA-PACIFIC: POWER TRANSMISSION & DISTRIBUTION (T&D) EQUIPMENTMARKET, BY COUNTRY, 2019–2027 (USD MILLION) 60
TABLE 28 ASIA-PACIFIC: POWER TRANSMISSION & DISTRIBUTION (T&D) EQUIPMENTMARKET, BY TYPE, 2019–2027 (USD MILLION) 61
TABLE 29 ASIA PACIFIC: POWER TRANSMISSION & DISTRIBUTION (T&D) EQUIPMENTMARKET, BY APPLICATION, 2019-2027 (USD MILLION) 61
TABLE 30 CHINA: POWER TRANSMISSION & DISTRIBUTION (T&D) EQUIPMENTMARKET, BY TYPE, 2019–2027 (USD MILLION) 62
TABLE 31 CHINA: POWER TRANSMISSION & DISTRIBUTION (T&D) EQUIPMENTMARKET, BY APPLICATION, 2019-2027 (USD MILLION) 62
TABLE 32 JAPAN: POWER TRANSMISSION & DISTRIBUTION (T&D) EQUIPMENTMARKET, BY TYPE, 2019–2027 (USD MILLION) 63
TABLE 33 JAPAN: POWER TRANSMISSION & DISTRIBUTION (T&D) EQUIPMENTMARKET, BY APPLICATION, 2019-2027 (USD MILLION) 64
TABLE 34 INDIA: POWER TRANSMISSION & DISTRIBUTION (T&D) EQUIPMENTMARKET, BY TYPE, 2019–2027 (USD MILLION) 65
TABLE 35 INDIA: POWER TRANSMISSION & DISTRIBUTION (T&D) EQUIPMENTMARKET, BY APPLICATION, 2019-2027 (USD MILLION) 65
TABLE 36 SOUTH KOREA: POWER TRANSMISSION & DISTRIBUTION (T&D) EQUIPMENTMARKET, BY TYPE, 2019–2027 (USD MILLION) 66
TABLE 37 SOUTH KOREA: POWER TRANSMISSION & DISTRIBUTION (T&D) EQUIPMENTMARKET, BY APPLICATION, 2019-2027 (USD MILLION) 66
TABLE 38 REST OF ASIA-PACIFIC: POWER TRANSMISSION & DISTRIBUTION (T&D) EQUIPMENTMARKET, BY TYPE, 2019–2027 (USD MILLION) 67
TABLE 39 REST OF ASIA-PACIFIC: POWER TRANSMISSION & DISTRIBUTION (T&D) EQUIPMENTMARKET, BY APPLICATION, 2019-2027 (USD MILLION) 68
TABLE 40 MIDDLE EAST & AFRICA: POWER TRANSMISSION & DISTRIBUTION (T&D) EQUIPMENTMARKET, BY COUNTRY, 2019–2027 (USD MILLION) 69
TABLE 41 MIDDLE EAST & AFRICA: POWER TRANSMISSION & DISTRIBUTION (T&D) EQUIPMENTMARKET, BY TYPE, 2019–2027 (USD MILLION) 70
TABLE 42 MIDDLE EAST & AFRICA: POWER TRANSMISSION & DISTRIBUTION (T&D) EQUIPMENTMARKET, BY APPLICATION, 2019-2027 (USD MILLION) 70
TABLE 43 SAUDI ARABIA: POWER TRANSMISSION & DISTRIBUTION (T&D) EQUIPMENTMARKET, BY TYPE, 2019–2027 (USD MILLION) 71
TABLE 44 SAUDI ARABIA: POWER TRANSMISSION & DISTRIBUTION (T&D) EQUIPMENTMARKET, BY APPLICATION, 2019-2027 (USD MILLION) 71
TABLE 45 UAE: POWER TRANSMISSION & DISTRIBUTION (T&D) EQUIPMENTMARKET, BY TYPE, 2019–2027 (USD MILLION) 72
TABLE 46 UAE: POWER TRANSMISSION & DISTRIBUTION (T&D) EQUIPMENTMARKET, BY APPLICATION, 2019-2027 (USD MILLION) 72
TABLE 47 SOUTH AFRICA: POWER TRANSMISSION & DISTRIBUTION (T&D) EQUIPMENTMARKET, BY TYPE, 2019–2027 (USD MILLION) 73
TABLE 48 SOUTH AFRICA: POWER TRANSMISSION & DISTRIBUTION (T&D) EQUIPMENTMARKET, BY APPLICATION, 2019-2027 (USD MILLION) 74
TABLE 49 REST OF MIDDLE EAST & AFRICA: POWER TRANSMISSION & DISTRIBUTION (T&D) EQUIPMENTMARKET, BY TYPE, 2019–2027 (USD MILLION) 74
TABLE 50 REST OF MIDDLE EAST & AFRICA: POWER TRANSMISSION & DISTRIBUTION (T&D) EQUIPMENTMARKET, BY APPLICATION, 2019-2027 (USD MILLION) 75
TABLE 51 SOUTH AMERICA: POWER TRANSMISSION & DISTRIBUTION (T&D) EQUIPMENTMARKET, BY COUNTRY, 2018–2026 (USD MILLION) 76
TABLE 52 SOUTH AMERICA: POWER TRANSMISSION & DISTRIBUTION (T&D) EQUIPMENTMARKET, BY TYPE, 2019–2027 (USD MILLION) 76
TABLE 53 SOUTH AMERICA: POWER TRANSMISSION & DISTRIBUTION (T&D) EQUIPMENTMARKET, BY APPLICATION, 2019-2027 (USD MILLION) 77
TABLE 54 BRAZIL: POWER TRANSMISSION & DISTRIBUTION (T&D) EQUIPMENTMARKET, BY TYPE, 2019–2027 (USD MILLION) 78
TABLE 55 BRAZIL: POWER TRANSMISSION & DISTRIBUTION (T&D) EQUIPMENTMARKET, BY APPLICATION, 2019-2027 (USD MILLION) 78
TABLE 56 ARGENTINA: POWER TRANSMISSION & DISTRIBUTION (T&D) EQUIPMENTMARKET, BY TYPE, 2019–2027 (USD MILLION) 79
TABLE 57 ARGENTINA: POWER TRANSMISSION & DISTRIBUTION (T&D) EQUIPMENTMARKET, BY APPLICATION, 2019-2027 (USD MILLION) 79
TABLE 58 REST OF SOUTH AMERICA: POWER TRANSMISSION & DISTRIBUTION (T&D) EQUIPMENTMARKET, BY TYPE, 2019–2027 (USD MILLION) 80
TABLE 59 REST OF SOUTH AMERICA: POWER TRANSMISSION & DISTRIBUTION (T&D) EQUIPMENTMARKET, BY APPLICATION, 2019-2027 (USD MILLION) 80
TABLE 60 HITACHI ABB POWER GRIDS: PRODUCTS OFFERED 87
TABLE 61 HITACHI ABB POWER GRIDS: KEY DEVELOPMENTS 87
TABLE 62 SCHNEIDER ELECTRIC: PRODUCTS OFFERED 92
TABLE 63 SCHNEIDER ELECTRIC: KEY DEVELOPMENTS 93
TABLE 64 SIEMENS: PRODUCTS OFFERED 95
TABLE 65 EATON CORPORATION: PRODUCTS OFFERED 99
TABLE 66 MITSUBISHI ELECTRIC CORPORATION: PRODUCTS OFFERED 103
TABLE 67 HAMMOND POWER SOLUTIONS: PRODUCTS OFFERED 108
TABLE 68 TOSHIBA CORPORATION: PRODUCT OFFERED 111
TABLE 69 TOSHIBA CORPORATION: KEY DEVELOPMENTS 112
TABLE 70 GENERAL ELECTRIC: PRODUCT OFFERED 115
TABLE 71 GENERAL ELECTRIC: KEY DEVELOPMENTS 116
TABLE 72 TE CONNECTIVITY: PRODUCT OFFERED 118
TABLE 73 TE CONNECTIVITY: KEY DEVELOPMENTS 119
TABLE 74 POWELL INDUSTRIES INC.: PRODUCT OFFERED 121
TABLE 75 POWELL INDUSTRIES INC.: KEY DEVELOPMENTS 121
TABLE 76 FUJI ELECTRIC COMPANY LTD: PRODUCTS/SOLUTION/SERVICES OFFERED 125
TABLE 77 FUJI ELECTRIC: KEY DEVELOPMENTS 126
TABLE 78 BHEL: PRODUCTS/SOLUTION/SERVICES OFFERED 128
TABLE 79 BHEL: KEY DEVELOPMENTS 130
TABLE 80 CHINT GROUP: PRODUCTS/SOLUTION/SERVICES OFFERED 132
TABLE 81 CHINT GROUP: KEY DEVELOPMENTS 133
TABLE 82 BASLER ELECTRIC COMPANY: PRODUCTS/SOLUTION/SERVICES OFFERED 134
TABLE 83 BASLER ELECTRIC COMPANY: KEY DEVELOPMENTS 135
TABLE 84 CG POWER AND INDUSTRIAL SOLUTIONS LIMITED.: PRODUCTS/SOLUTION/SERVICES OFFERED 137
TABLE 85 G&W ELECTRIC: PRODUCTS OFFERED 138
TABLE 86 G&W ELECTRIC: KEY DEVELOPMENTS 138
TABLE 87 S&C ELECTRIC: PRODUCTS OFFERED 139
TABLE 88 S&C ELECTRIC: KEY DEVELOPMENTS 141
TABLE 89 ITRON: PRODUCTS OFFERED 143
TABLE 90 ITRON: KEY DEVELOPMENTS 143
TABLE 91 LANDIS+GYR: PRODUCTS OFFERED 145
TABLE 92 LANDIS+GYR: KEY DEVELOPMENTS 147
 
LIST OF FIGURES
FIGURE 1 MARKET SYNOPSIS 15
FIGURE 2 MARKET ATTRACTIVENESS ANALYSIS: GLOBAL POWER T&D EQUIPMENT 16
FIGURE 3 GLOBAL POWER T&D EQUIPMENT MARKET ANALYSIS, BY TYPE 17
FIGURE 4 GLOBAL POWER T&D EQUIPMENT MARKET ANALYSIS, BY APPLICATION 18
FIGURE 5 GLOBAL POWER T&D EQUIPMENT MARKET ANALYSIS, BY REGION 19
FIGURE 6 GLOBAL POWER T&D EQUIPMENT MARKET: STRUCTURE 21
FIGURE 7 KEY BUYING CRITERIA FOR GLOBAL POWER T&D EQUIPMENT MARKET 21
FIGURE 8 RESEARCH PROCESS 22
FIGURE 9 TOP-DOWN AND BOTTOM-UP APPROACHES 25
FIGURE 10 GLOBAL POWER T&D EQUIPMENT MARKET SIZE & MARKET SHARE, BY NORTH AMERICA (2019 VS 2026) 27
FIGURE 11 GLOBAL POWER T&D EQUIPMENT MARKET SIZE & MARKET SHARE, BY EUROPE (2019 VS 2026) 27
FIGURE 12 GLOBAL POWER T&D EQUIPMENT MARKET SIZE & MARKET SHARE, BY ASIA-PACIFIC (2019 VS 2026) 28
FIGURE 13 GLOBAL POWER T&D EQUIPMENT MARKET SIZE & MARKET SHARE, BY MIDDLE EAST & AFRICA (2019 VS 2026) 28
FIGURE 14 GLOBAL POWER T&D EQUIPMENT MARKET SIZE & MARKET SHARE, BY SOUTH AMERICA (2019 VS 2026) 29
FIGURE 15 DRO ANALYSIS: GLOBAL POWER T&D EQUIPMENT MARKET 30
FIGURE 16 SUPPLY CHAIN ANALYSIS: GLOBAL POWER T&D EQUIPMENT MARKET 35
FIGURE 17 PORTER'S FIVE FORCES ANALYSIS: GLOBAL POWER T&D EQUIPMENT MARKET 36
FIGURE 18 GLOBAL POWER T&D EQUIPMENT MARKET, BY TYPE, 2020 (% SHARE) 38
FIGURE 19 GLOBAL POWER T&D EQUIPMENT MARKET, BY TYPE2019 TO 2027 (USD MILLION) 39
FIGURE 20 GLOBAL POWER T&D EQUIPMENT MARKET , BY APPLICATION, 2019 (% SHARE) 42
FIGURE 21 GLOBAL POWER T&D EQUIPMENT: MARKET ESTIMATES & FORECAST, BY APPLICATION, 2019–2027 (USD MILLION) 42
FIGURE 22 GLOBAL POWER T&D EQUIPMENT MARKET, BY REGION, 2020 (% SHARE) 45
FIGURE 23 GLOBAL POWER T&D EQUIPMENT MARKET, BY REGION, 2019–2027 (USD MILLION) 45
FIGURE 24 BENCHMARKING OF MAJOR COMPETITORS 83
FIGURE 25 MAJOR PLAYERS MARKET SHARE ANALYSIS, 2019 (%) 84
FIGURE 26 HITACHI ABB POWER GRIDS: TOTAL REVENUE VS RESEARCH AND DEVELOPMENT AND GEOGRAPHIC REVENUE (2017–2020) 86
FIGURE 27 SCHNEIDER ELECTRIC: TOTAL REVENUE VS RESEARCH AND DEVELOPMENT AND GEOGRAPHIC REVENUE (2017–2020) 91
FIGURE 28 SIEMENS: TOTAL REVENUE VS RESEARCH & DEVELOPMENT AND REGIONAL REVENUE (2015–2018) 95
FIGURE 29 EATON CORPORATION: TOTAL REVENUE VS RESEARCH AND DEVELOPMENT AND GEOGRAPHIC REVENUE (2015–2018) 99
FIGURE 30 MITSUBISHI ELECTRIC CORPORATION: TOTAL REVENUE VS RESEARCH AND DEVELOPMENT AND GEOGRAPHIC REVENUE (2017–2020) 103
FIGURE 31 HAMMOND POWER SOLUTIONS: TOTAL REVENUE VS RESEARCH AND DEVELOPMENT AND GEOGRAPHIC REVENUE (2015–2018) 107
FIGURE 32 TOSHIBA CORPORATION: FINANCIAL OVERVIEW SNAPSHOT 110
FIGURE 33 GENERAL ELECTRIC: FINANCIAL OVERVIEW SNAPSHOT 114
FIGURE 34 TE CONNECTIVITY: FINANCIAL OVERVIEW SNAPSHOT 118
FIGURE 35 POWELL INDUSTRIES INC.: FINANCIAL OVERVIEW SNAPSHOT 120
FIGURE 36 FUJI ELECTRIC CO LTD: FINANCIAL OVERVIEW SNAPSHOT 124
FIGURE 37 BHEL: FINANCIAL OVERVIEW SNAPSHOT 127
FIGURE 38 CG POWER AND INDUSTRIAL SOLUTIONS LIMITED: FINANCIAL OVERVIEW SNAPSHOT 136
FIGURE 39 ITRON: FINANCIAL OVERVIEW SNAPSHOT 142
FIGURE 40 LANDIS+GYR: FINANCIAL OVERVIEW SNAPSHOT 144
$312.8 Billion
7.35%
North America
2022-2027
Market Synopsis:
Power relates to the electrical supply of electricity and energy. It includes the supply to various operation and energy measures, including smart meters, smart appliances, renewable energy resources, and energy-efficient resources. Electronic power conditioning and control of the production and distribution of electricity are essential aspects of the smart grid. Technological limitations on metering no longer force peak power prices to be averaged out and passed on to all consumers without any biasedness.
Dominant forms such as wind power and solar power are highly variable, so the need for more sophisticated control systems became apparent to facilitate the connection of sources to the otherwise highly controllable grid. Power from photovoltaic cells has also significantly called into question the imperative for large, centralized power stations. The rapidly falling costs point to a significant change from the centralized grid topology to one that is highly distributed, with power being generated and consumed right at the limits of the grid.
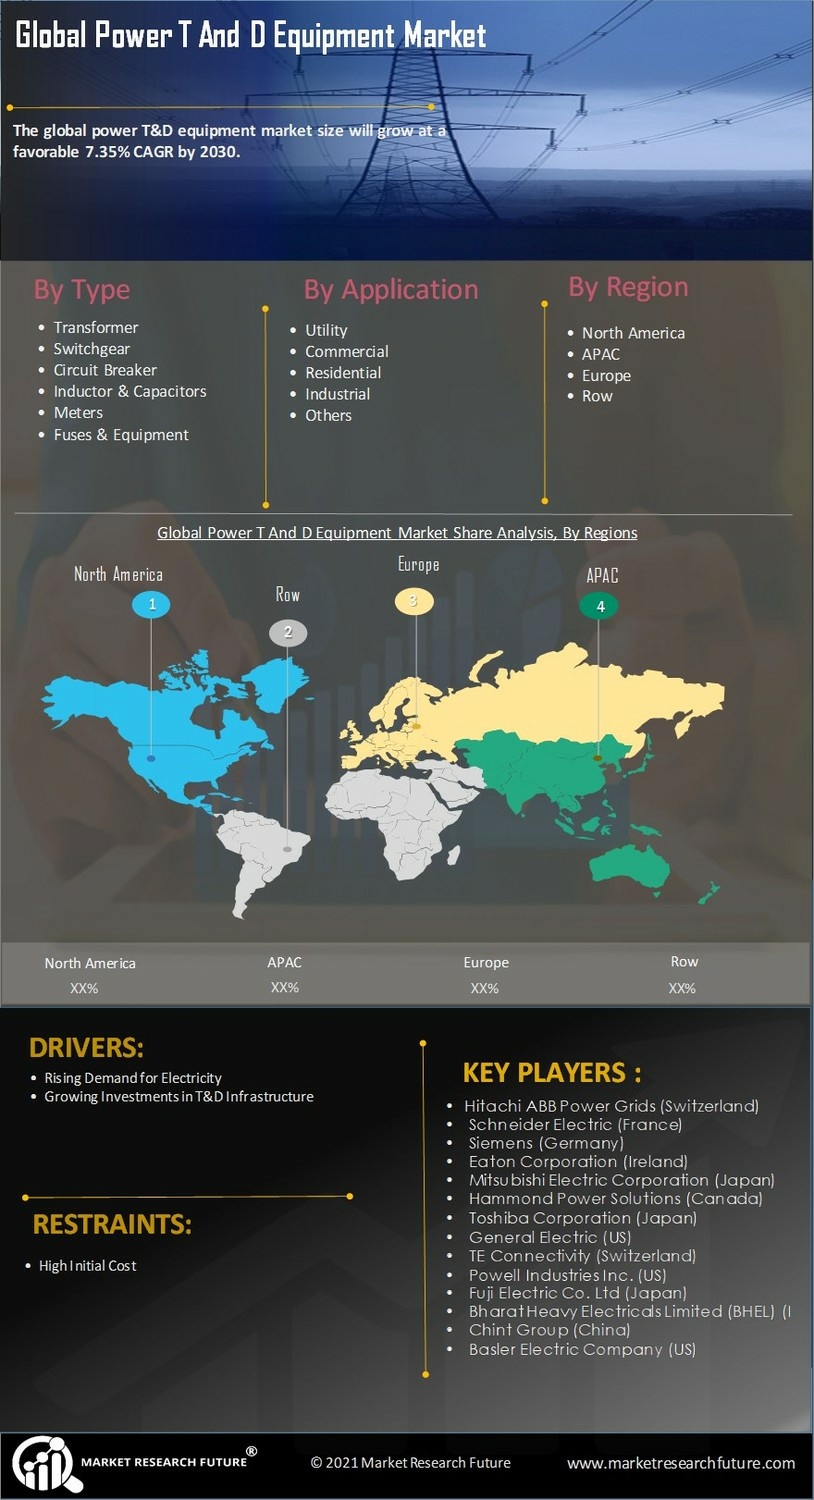
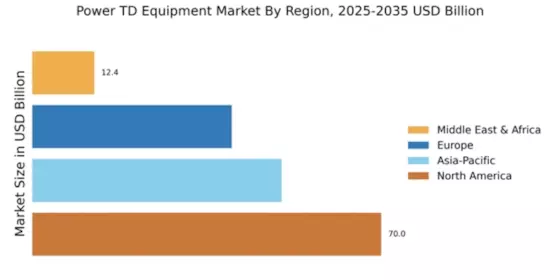
Based on type, the global power T&D equipment market has been segmented intotransformers, switchgear, circuit breaker, inductors & capacitors, meters, fuses & equipment, and others. The switchgear segment held a share of 37.9% of the global power T&D equipment market. Based on region, the global power T&D Equipment market has been segmented into North America, Europe, Asia-Pacific, the Middle East & Africa, and South America. Asia-Pacific held a 40.5% share of the global power T&D equipmentmarket.
COVID-19 Analysis:
COVID-19 has led to severe impact across all the industries around the world. The rapid spread has led governments across the globe to take stricter actions for the operations of industrial plants and offices, leading to stricter lockdowns. The lockdown had a notable impact on the power sector overall as power demand had decreased majorly from commercial and industrial sectors.The pandemic has induced a steep decline in the global demand for power T&D equipment, especially in economies with complete lockdowns. As T&D equipment is used in utilities, commercial, water & wastewater treatment, and many other essential industries, manufacturers face supply chain disruption in the supply of global T&D equipment. However, the market has witnessed a steep decline from the utility, industrial, residential, and commercial sectors due to the decline in global energy demand. Furthermore,key global companies in the global power T&D equipment are facing a slowdown due to COVID-19 and are unable to initiate projects and execute product developments.
Market Dynamics:
As per the International Energy Agency (IEA), as per the stated policies scenario, the global electricity demand is projected to grow at a rate of 2.1% per annum by 2040. Additionally, the share of electricity in the final energy consumption is estimated to rise from 19% in 2018 to 24% in 2040. The growing population, rapid industrialization & urbanization, and increasing infrastructure development are a few factors that are expected to increase the global electricity demand. Additionally, as per the United Nations, the global population is expected to reach approximately 8.5 billion and 9.7 billion by 2030 and 2050. The growth in the world’s population results in increased electricity demand and consumption. Hence, it can be interpreted that with the increasing demand for electricity, the need for T&D infrastructure is also expected to increase.
The investments in electric T&D for the infrastructure are subject to constant transformation owing to the developing infrastructure. According to World Energy Investment Outlook Special Report, Total energy investment was USD 1.7 trillion in 2016. Electricity sector investment overtook oil and gas for the first time, while energy efficiency was the biggest growth sector. OECD countries have invested heavily to achieve this, spending USD 3 trillion on new renewable and conventional power plants, T&D infrastructure, and energy efficiency measures. Out of this, the investment in T&D networks accounted for USD 240 billion in 2019. Over the next decade, electric utilities are expected to invest about USD 3.2 trillion globally in new and replacement T&D infrastructure. Large T&D investments are expected to replace aging infrastructure, maintain reliability, enable market efficiencies, and aid in global policy objectives, such as greenhouse gas reduction, in the next two decades.
Restraints:
Power T&D equipment are major components in the electrical infrastructure and contribute to around to half of the total cost of the T&D network. For instance, the total cost of installing a power Power T&D equipment for the owner is the summation of the initial purchase price and the cost of running it for its life of 30 - 40 years. The major issue related to the power transformers is the cost feasibility that does not compliment the operational life of the transformers. Similarly, other power T&D equipment such as circuit breakers, switchgear, and other components have a relative life span to their cost.
Opportunities:
The electrical grid infrastructure for the supply of electricity to consumers across the globe, especially in developing countries, was constructed a long time ago. Thus, there is a need to upgrade and replace the aging infrastructure to ensure an uninterrupted power supply. Although the replacement of aging electrical infrastructure entails high capital investments, the need to replace and upgrade equipment such as transformers, circuit breakers, and switchgear in grid infrastructure plays an important role in reducing T&D losses and improving power efficiency. Unequal load distribution, lack of maintenance, and aging substations are some of the reasons that contribute to T&D losses and power failure in the power grid infrastructure.
Segment Overview:
By Type:
A transformer is a passive electrical device that transfers electrical energy from one circuit to another through the process of electromagnetic induction. It is most commonly used to increase (step-up) or decrease (step down) voltage levels between circuits. Transformers are used in various fields like the distribution sector, power generation grid, electric energy consumption, and transmission. Transformers can be integrated into installations including free standing, substations, ground, pole-mounted, pad, platform, and should exhibit high performance thermally, electrically, and magnetically. Transformers need to be designed in such a way that they are easy to handle, install, lift, and transport.
Switchgear is used for controlling, regulating, and switching on or off the electrical circuit in the electrical power system. Switchgear in substations are located on both the high- and low-voltage sides of large power transformers. The switchgear on the low-voltage side of the transformers may be located in a building, with medium-voltage circuit breakers for distribution circuits, along with metering, control, and protection equipment. For industrial applications, a transformer and switchgear line-up may be combined in one housing, called a unitized substation (USS).
A circuit breaker is a switching device that interrupts the abnormal or faults current. It’s a mechanical device that disturbs the flow of high magnitude current and performs the function of the switch. It’s mainly designed to close or open an electrical circuit and protect the electrical system from damage. Circuit breakers are classified on the basis of rated voltages. Circuit breakers below 1000V are known as low voltage circuit breakers, and above 1000V are knowns as high voltage circuit breakers.
An inductor is used in the power electric circuit to store energy in the form of magnetic energy when electricity is applied. An inductor is opposing any change in the amount of current flowing through it. When current across the inductor changes, it either acquires charge or loses the charge in order to equalize the current passing through it. The inductor is also called reactor, coil, or choke.
A meter is a device used to measure the amount of electric energy consumed by a residence, commercial, utility, and industrial. Electric utilities use electric meters installed at customer premises to measure electric energy delivered to the customer for billing purposes.
Fuses are the protectors and safety devices that are used to protect the home appliances such as televisions, refrigerators, and computers from damage caused by high voltage. The fuse is made up of a thin strip or strand of metal. Whenever there is heavy current flow in an electrical circuit, the fuse melts, and it opens the circuit and disconnects it from the power supply. Also, it works as a circuit breaker or stabilizer, which protects the device from damage. Fuses strips are made up of aluminum, copper, or zinc, and it is always connected in series with the circuit to protect from overcurrent in the running cables.
By Application:
Utility refers to those company stocks that provide basic services, including electricity, natural gas, and water. The utility segment has its own generating plants and T&D equipment that generates its own power system. T&D equipment are used to transport power generated at power plants to substation then to electric utility transformers. The electric utility delivers electricity to commercial, residential, and others sectors.
Commercial buildings are used for commercial purposes such as education facilities, government & office buildings, hospitals & medical centers, and hotels. Widespread installation of electrical appliances such as lighting systems, ventilators, and air conditioners in commercial spaces and increasing the demand for electric power T&D equipment will boost the demand for T&D equipment in the commercial sector. Moreover, the launch of various smart cities has led to the modernization of electrical grids, another crucial factor contributing to market growth. Additionally, increasing investments in renewable energy facilities and awareness regarding the need to reduce energy losses encourage the adoption of technologically improved T&D equipment across the globe.
The residential segment includes infrastructure that is dependent on power T&D equipment for electricity and thermal energy. However, the sale of residential properties has declined due to the ongoing COVID-19 pandemic, resulting in the lesser installation of power T&D equipment being deployed across the globe. Such factors indicate a steady growth in the residential sector in the world. However, the improving pandemic situation is likely to result in more installation of these systems in the coming months.
The industrial segment includes industries that are dependent on T&D systems to supply electrical equipment. The growing energy demand from industrial sectors is driving the growth of the market. The advent of smart cities has led to the modernization of electrical grids, contributing to market growth. The increasing investments in renewable energy facilities and awareness regarding the need to reduce energy losses encourage the adoption of technologically improved equipment across the globe. And market players are emphasizing providing equipment at competitive prices.
The others segment includes military and agriculture industry. Global power T&D equipment supplying power and thermal loads are required for barracks, training facilities, buildings, medical centers, and other staff supporting buildings. T&D equipment are expected to witness high demand in the coming days. Due to lockdown, there is a decline in supply. Increased investments in renewable energy and technological advancements propel the market for T&D equipment across the globe.
Regional Analysis:
North America is one of the prominent regional markets for power T&D equipment, owing to an increase in the share of renewable energy sources and a growing need for upgrading the T&D networks in the region. The region is experiencing high investment in energy efficiency due to decreasing technology prices and third-party energy efficiency programs. As per North American Utility Energy Efficiency Program Implementation, the annual spending on energy efficiency is projected to reach USD 11.3 billion by 2028, thus driving the market for power T&D equipment. Moreover, data centers require a continuous and reliable power supply for the effective and uninterrupted functioning of computing and networking equipment of the data center, which leads to an increase in the demand for Power T&D equipment in data centers. Hence, the significant increase in power demand and the increasing number of data centers lead to the demand for Power T&D equipment in this region during the forecast period.
The Europe Power T&D equipment market is expected to witness significant growth during the forecast period due to the market's expansion through a rise in industrial growth, aging infrastructure, which leads to investment in smart grids, rising production of electricity, and growing demand for green energy. Besides, the region is expanding its T&D network due to new electricity addition in the grid. The region generated 3901.3 TWh in 2017, which accounted for around a 2% increase in total energy generation from the previous year. These factors are driving towards increasing demand for Power T&D equipment from Europe
The continuous need to update and upgrade existing transmission and distribution infrastructure to serve the growing demand for electricity will lead to a growth of the Power T&D equipment market over the forecast period. In the emerging economies of Asia-Pacific, extensive power plant capacity additions, economic growth, and the need to improve access to electricity are driving grid expansion and the Power T&D equipment market.
Middle East countries are currently focusing on increasing their power generating capacity through investments in renewable energy resources. Countries like Israel, Jordan, UAE, and Saudi Arabia are increasingly investing in solar energy to ensure energy security and potentially become electricity exporters. All the major Middle Eastern economies are also primarily focusing on grid expansion to withstand the growing demand for energy in the region.Most African nations are currently witnessing economic growth due to huge foreign investments in the developing industrialization sector and expanding energy generation capacity through renewable resources.
The region includes potential power transmission countries such as Brazil, Argentina, Chile, Mexico, and Peru. The electricity sector in Brazil is the largest in South America. The currently installed capacity is about 150 GW. Since 1970, the electricity sector in Brazil grew with an average yearly growth of 5.8% per year. The current investment in the renewable sector is creating a wide scope for the development of the Power T&D equipment market in Brazil.
Competitive Landscape:
The global Power T&D Equipment market is characterized by the presence of many local, regional, and global vendors. The market is highly competitive, with all the players continually competing to gain a larger market share. High competition, rapid technological advancements, frequent changes in government policies, and stringent environmental regulations are critical factors that could restrain the market growth. The vendors compete in terms of cost, product quality, reliability, and aftermarket services. Vendors must provide cost-effective and efficient products to survive and succeed in a competitive market environment.
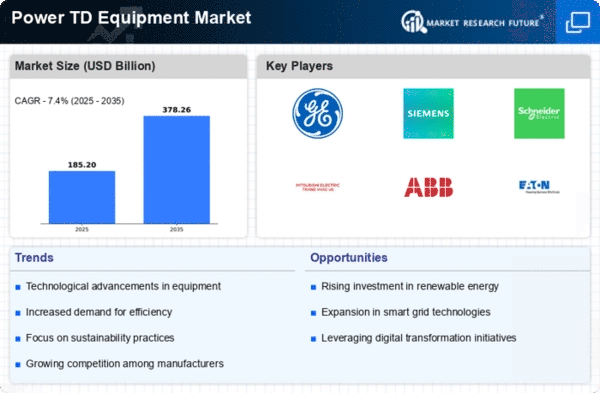
The growth of the vendors is dependent on market conditions, government support, and industrial development. Thus, the vendors should focus on expanding their presence and improving their service. Hitachi ABB Power Grids (Switzerland), Schneider Electric (France), Siemens (Germany), Eaton Corporation (Ireland), Mitsubishi Electric Corporation (Japan), Hammond Power Solutions (Canada), Toshiba Corporation (Japan), General Electric (US), TE Connectivity (Switzerland), Powell Industries Inc. (US), Fuji Electric Co. Ltd (Japan), Bharat Heavy Electricals Limited (BHEL) (India), Chint Group (China), Basler Electric Company (US), CG Power and Industrial Solutions Limited (India), G&W Electric (US), S&C Electric (US), Itron (US), Landis+GYR (Switzerland) are some of the key players operating in the global market.
Recent Developments
Report Overview:
The report for the global Power T&D Equipment marketof MRFRresearch covers extensive primary research. This is accompanied bya detailed analysis of qualitative and quantitative aspects by various industry experts.
Segmentation Table:
By Type
Report Attribute/Metric | Details |
---|---|
Market Size | 2030: Significant Value |
CAGR | 7.35% CAGR (2022-2030) |
Base Year | 2021 |
Forecast Period | 2022-2030 |
Historical Data | 2019Â &Â 2020 |
Forecast Units | Value (USD Million) |
Report Coverage | Revenue Forecast, Competitive Landscape, Growth Factors, and Trends |
Segments Covered | Type, Application |
Geographies Covered | North America, Europe, Asia-Pacific, and Rest of the World (RoW) |
Key Vendors | Hitachi ABB Power Grids (Switzerland), Schneider Electric (France), Siemens (Germany), Eaton Corporation (Ireland), Mitsubishi Electric Corporation (Japan), Hammond Power Solutions (Canada), Toshiba Corporation (Japan), General Electric (US), TE Connectivity (Switzerland), Powell Industries Inc. (US), Fuji Electric Co. Ltd (Japan), Bharat Heavy Electricals Limited (BHEL) (India), Chint Group (China), Basler Electric Company (US), CG Power and Industrial Solutions Limited (India), G&W Electric (US), S&C Electric (US), Itron (US), Landis+GYR (Switzerland) |
Key Market Opportunities | Aging T&D Infrastructure in Developing Countries |
Key Market Drivers |
|
Frequently Asked Questions (FAQ) :
The global power T&D equipment market size will grow at a favorable 7.35% CAGR by 2030
The forecast period for Power T&D Equipment market research report is 2022-2030.
Global Power T&D Equipment market is dominated by APAC region.