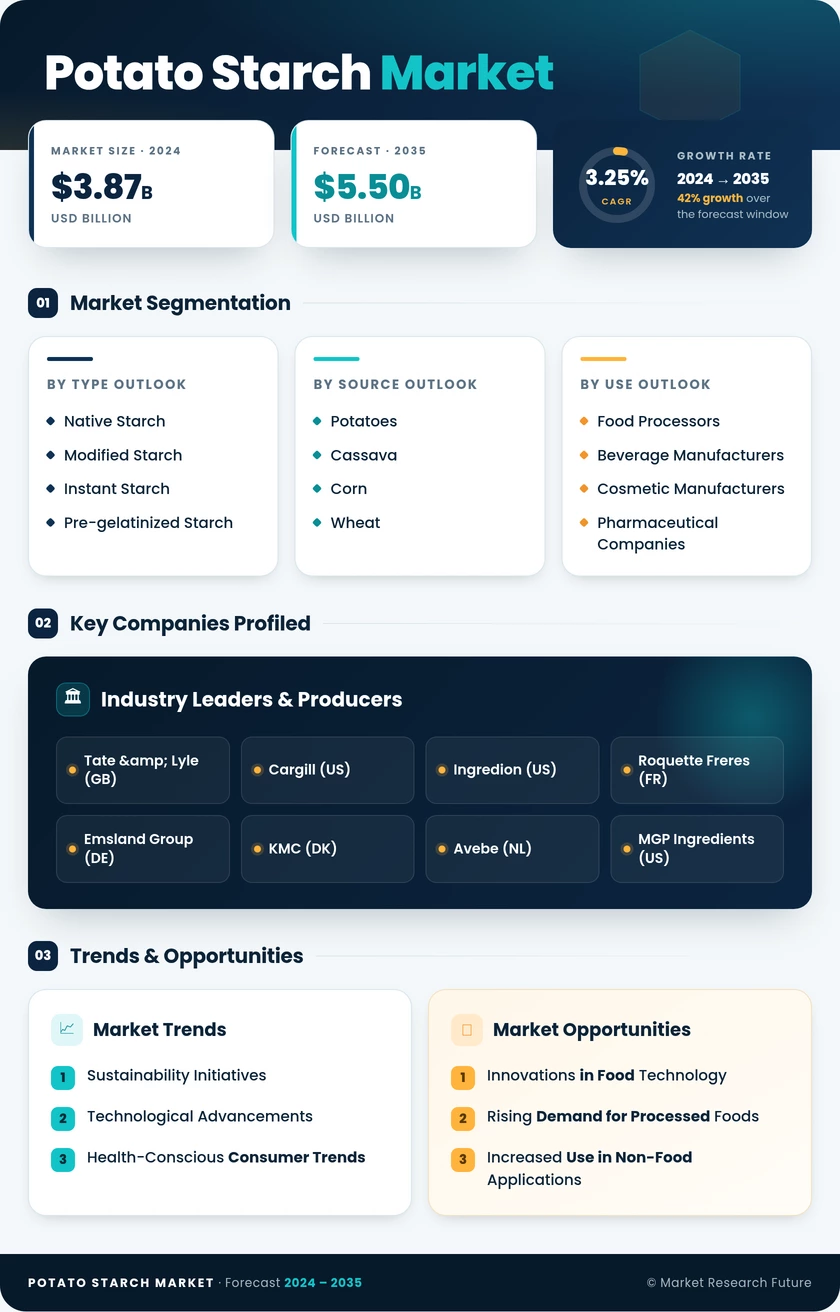
Potato Starch Market (2026 - 2035)

ID: MRFR/FnB/10306-CR 200 Pages Snehal Singh Last Updated: October 13, 2026
Potato Starch Market Size, Share, Industry Trend & Analysis Research Report By Product Type (Native Potato Starch, Modified), By Nature (Conventional, Organic), By Application (Food and Beverages, Animal Feed and Pet Nutrition, Pharmaceuticals, Cosmetics), By Region (North America, Europe, Asia-Pacific, South America, Middle East and Africa) - Forecast to 2035
Potato Starch Market
Market Size
Forecast Period2026-2035
CAGR (2026-2035)5.84%
2025 Market SizeUSD 4.01 Billion
2035 Market SizeUSD 7.08 Billion
Key Players
Royal Avebe U.A.
Emsland Group
KMC
Roquette Frères
Tereos
AGRANA Beteiligungs-AG
Opportunities
  • Resistant Starch for Gut Health and Pet Nutrition
  • Processing Capacity in India and Southeast Asia
  • Side-Stream Valorisation as a New Business Model
  1. 1 Market Summary | |
  2. 2 Key Report Takeaways | |
    1. 2.1 By Product Type | |
    2. 2.2 By Nature | |
    3. 2.3 By Application | |
    4. 2.4 By Region | |
  3. 3 Market Size and Forecast (2021–2035) | |
    1. 3.1 Historical Market Size (2021–2025) | |
    2. 3.2 Forecast Market Size (2026–2035) | |
    3. 3.3 Year-over-Year Growth Analysis | |
  4. 4 Driver Impact Analysis | |
    1. 4.1 Clean-Label and Gluten-Free Reformulation | |
    2. 4.2 Plant-Based Dairy and Meat Alternatives | |
    3. 4.3 Process-Stable Grades for Convenience Foods | |
    4. 4.4 Talc and Microplastic Substitution in Cosmetics | |
    5. 4.5 Pharmaceutical Excipient Demand | |
    6. 4.6 Asia-Pacific Food Processing Capacity | |
    7. 4.7 CAP Support for Cooperative Supply | |
  5. 5 Restraints Impact Analysis | |
    1. 5.1 Weather-Driven Potato Yield Volatility | |
    2. 5.2 Energy Cost Intensity of Processing | |
    3. 5.3 Substitution by Maize and Cassava Starches | |
    4. 5.4 Regulatory Scrutiny of Chemically Modified Grades | |
    5. 5.5 Limited Organic Feedstock | |
  6. 6 Opportunities | |
    1. 6.1 Resistant Starch for Gut Health and Pet Nutrition | |
    2. 6.2 Processing Capacity in India and Southeast Asia | |
    3. 6.3 Side-Stream Valorisation as a New Business Model | |
    4. 6.4 Talc-Free Personal Care Formulations | |
    5. 6.5 Traceability and Carbon Data as a Premium Service | |
  7. 7 Regional Market Share and Country-Level Analysis | |
    1. 7.1 North America | | |
      1. 7.1.1 US | | |
      2. 7.1.2 Canada | | |
      3. 7.1.3 Mexico | |
    2. 7.2 Europe | | |
      1. 7.2.1 Germany | | |
      2. 7.2.2 UK | | |
      3. 7.2.3 France | | |
      4. 7.2.4 Italy | | |
      5. 7.2.5 Spain | | |
      6. 7.2.6 Nordic Countries | | |
      7. 7.2.7 Russia | | |
      8. 7.2.8 Rest of Europe | |
    3. 7.3 Asia-Pacific | | |
      1. 7.3.1 China | | |
      2. 7.3.2 India | | |
      3. 7.3.3 Japan | | |
      4. 7.3.4 South Korea | | |
      5. 7.3.5 ASEAN | | |
      6. 7.3.6 Rest of Asia-Pacific | |
    4. 7.4 South America | | |
      1. 7.4.1 Brazil | | |
      2. 7.4.2 Argentina | | |
      3. 7.4.3 Rest of South America | |
    5. 7.5 Middle East and Africa | | |
      1. 7.5.1 Saudi Arabia | | |
      2. 7.5.2 UAE | | |
      3. 7.5.3 South Africa | | |
      4. 7.5.4 Egypt | | |
      5. 7.5.5 Rest of Middle East and Africa | |
  8. 8 Future Outlook (2026–2035) | |
    1. 8.1 Automation and Data-Driven Process Control | |
    2. 8.2 Convergence on Clean-Label Functionality | |
    3. 8.3 Decarbonisation of Starch Processing | |
    4. 8.4 Sustainability Reporting and Packaging Rules | |
  9. 9 Segmentation Analysis | |
    1. 9.1 By Product Type | | |
      1. 9.1.1 Native Potato Starch | | |
      2. 9.1.2 Modified | |
    2. 9.2 By Nature | | |
      1. 9.2.1 Conventional | | |
      2. 9.2.2 Organic | |
    3. 9.3 By Application | | |
      1. 9.3.1 Food and Beverages | | |
      2. 9.3.2 Animal Feed and Pet Nutrition | | |
      3. 9.3.3 Pharmaceuticals | | |
      4. 9.3.4 Cosmetics and Personal Care | |
  10. 10 Competitive Landscape | |
    1. 10.1 Market Concentration Analysis | |
    2. 10.2 Competitive Benchmarking Matrix | |
    3. 10.3 Company Profiles | | |
      1. 10.3.1 Royal Avebe U.A. | | |
      2. 10.3.2 Emsland Group | | |
      3. 10.3.3 KMC (Kartoffelmelcentralen) | | |
      4. 10.3.4 Roquette Frères | | |
      5. 10.3.5 Tereos | | |
      6. 10.3.6 AGRANA Beteiligungs-AG | | |
      7. 10.3.7 Südstärke GmbH | | |
      8. 10.3.8 Ingredion Incorporated | | |
      9. 10.3.9 Lyckeby Starch AB | | |
      10. 10.3.10 PEPEES S.A. | | |
      11. 10.3.11 Finnamyl Oy | |
  11. 11 Recent News & Developments | |
  12. 12 Report Scope and Methodology | |
  13. 13 Detailed Sources and Citations | |
  14. 14 Frequently Asked Questions (FAQs) | | LIST OF TABLES | |
  15. TABLE 1 Global Market Size and Forecast, by Revenue (USD Billion), 2021–2035 | |
  16. TABLE 2 Driver Impact Analysis, 2026–2035 | |
  17. TABLE 3 Restraints Impact Analysis, 2026–2035 | |
  18. TABLE 4 Regional Summary, by Region, 2025 | |
  19. TABLE 5 North America Market, by Country, 2025 | |
  20. TABLE 6 Europe Market, by Country, 2025 | |
  21. TABLE 7 Asia-Pacific Market, by Country, 2025 | |
  22. TABLE 8 South America Market, by Country, 2025 | |
  23. TABLE 9 Middle East and Africa Market, by Country, 2025 | |
  24. TABLE 10 Market Segmentation, by Product Type, 2025–2035 | |
  25. TABLE 11 Market Segmentation, by Nature, 2025–2035 | |
  26. TABLE 12 Market Segmentation, by Application, 2025–2035 | |
  27. TABLE 13 Competitive Benchmarking Matrix, 2025 | |
  28. TABLE 14 Report Scope and Methodology | |
  29. TABLE 15 Detailed Sources and Citations | | LIST OF FIGURES | |
  30. FIGURE 1 Market Dynamics Overview – Drivers, Restraints and Opportunities | |
  31. FIGURE 2 Industry Value Chain Analysis | |
  32. FIGURE 3 Porter's Five Forces Analysis | |
  33. FIGURE 4 Global Market Size Trend (USD Billion), 2021–2035 | |
  34. FIGURE 5 Market Share, by Product Type, 2025 | |
  35. FIGURE 6 Market Share, by Nature, 2025 | |
  36. FIGURE 7 Market Share, by Application, 2025 | |
  37. FIGURE 8 Regional Market Share, 2025 | |
  38. FIGURE 9 Regional Growth Comparison (CAGR), 2026–2035 | |
  39. FIGURE 10 Competitive Landscape – Estimated Revenue Share Ranges, 2025 | |
  40. FIGURE 11 Competitive Positioning Matrix

Segmentation Quick Reference

DimensionSub-SegmentsDominant SegmentFastest Growing Segment
By Product TypeNative Potato Starch; ModifiedNative Potato Starch (69.3% share)Modified (8.4% CAGR)
By NatureConventional; OrganicConventional (92.8% share)Organic (7.4% CAGR)
By ApplicationFood and Beverages; Animal Feed and Pet Nutrition; Pharmaceuticals; CosmeticsFood and Beverages (65.2% share)Cosmetics (7.3% CAGR)
By RegionNorth America; Europe; Asia-Pacific; South America; Middle East and AfricaEurope (41.8% share)Asia-Pacific (7.1% CAGR)

Market Segmentation Overview

By Product Type

Sub-SegmentKey Trend
Native Potato StarchPreferred for E-number-free labels in gluten-free bakery and infant food
ModifiedEnzyme-treated and oxidised grades gain in retorted and frozen foods

Native Potato Starch leads with a 69.3% share because its high viscosity and additive-free status suit clean-label bakery and infant nutrition. Modified grades grow fastest at an 8.4% CAGR, since retorted soups and frozen meals need starches that resist retrogradation and shear. Buyers increasingly pair the two, keeping native grades where labels matter and modified grades where process stress is high.

By Nature

Sub-SegmentKey Trend
ConventionalScale-driven supply under cooperative cultivation contracts
OrganicPremium non-GMO demand from baby food and plant-based dairy

Conventional starch holds a 92.8% share because cooperative campaigns deliver large volumes at low unit cost. Organic grows faster at a 7.4% CAGR as baby food and premium bakery brands pay for verified non-GMO supply. Growth in Organic is capped less by demand than by the slow conversion of certified starch-potato acreage.

By Application

Sub-SegmentKey Trend
Food and BeveragesBakery, sauces, meat processing and dairy alternatives sustain volume
Animal Feed and Pet NutritionResistant starch enters premium pet food.
PharmaceuticalsExcipient consolidation lifts pharma-grade demand.
CosmeticsTalc-free powders replace mineral fillers.

Food and Beverages leads with a 65.2% share, drawing on bakery, sauces, meat processing and vegan cheese. Cosmetics grows fastest at a 7.3% CAGR because the IARC talc classification and EU microplastic restrictions push brands toward biodegradable starch powders. Pharmaceuticals and Animal Feed and Pet Nutrition add steadier, higher-margin demand through excipients and resistant starch.


Download PDF ×

We do not share your information with anyone. However, we may send you emails based on your report interest from time to time. You may contact us at any time to opt-out.