ID: MRFR/AGR/4088-HCR | February 2021 | Region: Global | 110 Pages
TABLE OF CONTENTS
1. 1 EXECUTIVE SUMMARY
1.1. Market Attractiveness Analysis
1.1.1. Global Potash Fertilizers Market, by Type
1.1.2. Global Potash Fertilizers Market, by Form
1.1.3. Global Potash Fertilizers Market, by Mode of Application
1.1.4. Global Potash Fertilizers Market, by Crop Type
1.1.5. Global Potash Fertilizers Market, by Region
2. MARKET INTRODUCTION
2.1. Definition
2.2. Scope of the Study
2.3. Market Structure
2.4. Key Buying Criteria
2.5. Macro Factor Indicator Analysis
3. RESEARCH METHODOLOGY
3.1. Research Process
3.2. Primary Research
3.3. Secondary Research
3.4. Market Size Estimation
3.5. Forecast Model
3.6. List of Assumptions
4. MARKET DYNAMICS
4.1. Introduction
4.2. Drivers
4.2.1. Driver 1
4.2.2. Driver 2
4.3. Restraints
4.3.1. Restraint 1
4.3.2. Restraint 2
4.4. Opportunities
4.4.1. Opportunity 1
4.4.2. Opportunity 2
4.5. Challenges
4.5.1. Challenge 1
4.5.2. Challenge 2
5. MARKET FACTOR ANALYSIS
5.1. Value Chain Analysis
5.2. Supply Chain Analysis
5.3. Porterβs Five Forces Model
5.3.1. Bargaining Power of Suppliers
5.3.2. Bargaining Power of Buyers
5.3.3. Threat of New Entrants
5.3.4. Threat of Substitutes
5.3.5. Intensity of Rivalry
6. GLOBAL POTASH FERTILIZERS MARKET, BY TYPE
6.1. Introduction
6.2. Potassium Nitrates
6.2.1. Potassium Nitrates: Market Estimates & Forecast, by Region/Country, 2020β2027
6.3. Potassium Sulfates
6.3.1. Potassium Sulfates: Market Estimates & Forecast, by Region/Country, 2020β2027
6.4. Potassium Chlorides
6.4.1. Potassium Chlorides: Market Estimates & Forecast, by Region/Country, 2020β2027
6.5. Others
6.5.1. Potassium Chlorides: Market Estimates & Forecast, by Region/Country, 2020β2027
7. GLOBAL POTASH FERTILIZERS MARKET, BY FORM
7.1. Introduction
7.2. Solid
7.2.1. Solid: Market Estimates & Forecast, by Region/Country, 2020β2027
7.3. Liquid
7.3.1. Liquid: Market Estimates & Forecast, by Region/Country, 2020β2027
8. GLOBAL POTASH FERTILIZERS MARKET, BY MODE OF APPLICATION
8.1. Introduction
8.2. Foliar
8.2.1. Foliar: Market Estimates & Forecast, by Region/Country, 2020β2027
8.3. Fertigation
8.3.1. Fertigation: Market Estimates & Forecast, by Region/Country, 2020β2027
8.4. Broadcasting
8.4.1. Broadcasting: Market Estimates & Forecast, by Region/Country, 2020β2027
9. GLOBAL POTASH FERTILIZERS MARKET, BY CROP TYPE
9.1. Introduction
9.2. Oilseeds & Pulses
9.2.1. Oilseeds & Pulses: Market Estimates & Forecast, by Region/Country, 2020β2027
9.3. Cereals & Grains
9.3.1. Cereals & Grains: Market Estimates & Forecast, by Region/Country, 2020β2027
9.4. Fruits & Vegetables
9.4.1. Fruits & Vegetables: Market Estimates & Forecast, by Region/Country, 2020β2027
9.5. Others
9.5.1. Others: Market Estimates & Forecast, by Region/Country, 2020β2027
10. GLOBAL POTASH FERTILIZERS MARKET, BY REGION
10.1. Introduction
10.2. North America
10.2.1. Market Estimates & Forecast, by Type, 2020β2027
10.2.2. Market Estimates & Forecast, by Form, 2020β2027
10.2.3. Market Estimates & Forecast, by Mode of Application, 2020β2027
10.2.4. Market Estimates & Forecast, by Crop Type, 2020β2027
10.2.5. Market Estimates & Forecast, by Country, 2020β2027
10.2.6. US
10.2.6.1. Market Estimates & Forecast, by Type, 2020β2027
10.2.6.2. Market Estimates & Forecast, by Form, 2020β2027
10.2.6.3. Market Estimates & Forecast, by Mode of Application, 2020β2027
10.2.6.4. Market Estimates & Forecast, by Crop Type, 2020β2027
10.2.7. Canada
10.2.7.1. Market Estimates & Forecast, by Type, 2020β2027
10.2.7.2. Market Estimates & Forecast, by Form, 2020β2027
10.2.7.3. Market Estimates & Forecast, by Mode of Application, 2020β2027
10.2.7.4. Market Estimates & Forecast, by Crop Type, 2020β2027
10.2.8. Mexico
10.2.8.1. Market Estimates & Forecast, by Type, 2020β2027
10.2.8.2. Market Estimates & Forecast, by Form, 2020β2027
10.2.8.3. Market Estimates & Forecast, by Mode of Application, 2020β2027
10.2.8.4. Market Estimates & Forecast, by Crop Type, 2020β2027
10.3. Europe
10.3.1. Market Estimates & Forecast, by Type, 2020β2027
10.3.2. Market Estimates & Forecast, by Form, 2020β2027
10.3.3. Market Estimates & Forecast, by Mode of Application, 2020β2027
10.3.4. Market Estimates & Forecast, by Crop Type, 2020β2027
10.3.5. Market Estimates & Forecast, by Country, 2020β2027
10.3.6. Germany
10.3.6.1. Market Estimates & Forecast, by Type, 2020β2027
10.3.6.2. Market Estimates & Forecast, by Form, 2020β2027
10.3.6.3. Market Estimates & Forecast, by Mode of Application, 2020β2027
10.3.6.4. Market Estimates & Forecast, by Crop Type, 2020β2027
10.3.7. UK
10.3.7.1. Market Estimates & Forecast, by Type, 2020β2027
10.3.7.2. Market Estimates & Forecast, by Form, 2020β2027
10.3.7.3. Market Estimates & Forecast, by Mode of Application, 2020β2027
10.3.7.4. Market Estimates & Forecast, by Crop Type, 2020β2027
10.3.8. France
10.3.8.1. Market Estimates & Forecast, by Type, 2020β2027
10.3.8.2. Market Estimates & Forecast, by Form, 2020β2027
10.3.8.3. Market Estimates & Forecast, by Mode of Application, 2020β2027
10.3.8.4. Market Estimates & Forecast, by Crop Type, 2020β2027
10.3.9. Spain
10.3.9.1. Market Estimates & Forecast, by Type, 2020β2027
10.3.9.2. Market Estimates & Forecast, by Form, 2020β2027
10.3.9.3. Market Estimates & Forecast, by Mode of Application, 2020β2027
10.3.9.4. Market Estimates & Forecast, by Crop Type, 2020β2027
10.3.10. Italy
10.3.10.1. Market Estimates & Forecast, by Type, 2020β2027
10.3.10.2. Market Estimates & Forecast, by Form, 2020β2027
10.3.10.3. Market Estimates & Forecast, by Mode of Application, 2020β2027
10.3.10.4. Market Estimates & Forecast, by Crop Type, 2020β2027
10.3.11. Rest of Europe
10.3.11.1. Market Estimates & Forecast, by Type, 2020β2027
10.3.11.2. Market Estimates & Forecast, by Form, 2020β2027
10.3.11.3. Market Estimates & Forecast, by Mode of Application, 2020β2027
10.3.11.4. Market Estimates & Forecast, by Crop Type, 2020β2027
10.4. Asia-Pacific
10.4.1. Market Estimates & Forecast, by Type, 2020β2027
10.4.2. Market Estimates & Forecast, by Form, 2020β2027
10.4.3. Market Estimates & Forecast, by Mode of Application, 2020β2027
10.4.4. Market Estimates & Forecast, by Crop Type, 2020β2027
10.4.5. Market Estimates & Forecast, by Country, 2020β2027
10.4.6. China
10.4.6.1. Market Estimates & Forecast, by Type, 2020β2027
10.4.6.2. Market Estimates & Forecast, by Form, 2020β2027
10.4.6.3. Market Estimates & Forecast, by Mode of Application, 2020β2027
10.4.6.4. Market Estimates & Forecast, by Crop Type, 2020β2027
10.4.7. Japan
10.4.7.1. Market Estimates & Forecast, by Type, 2020β2027
10.4.7.2. Market Estimates & Forecast, by Form, 2020β2027
10.4.7.3. Market Estimates & Forecast, by Mode of Application, 2020β2027
10.4.7.4. Market Estimates & Forecast, by Crop Type, 2020β2027
10.4.8. India
10.4.8.1. Market Estimates & Forecast, by Type, 2020β2027
10.4.8.2. Market Estimates & Forecast, by Form, 2020β2027
10.4.8.3. Market Estimates & Forecast, by Mode of Application, 2020β2027
10.4.8.4. Market Estimates & Forecast, by Crop Type, 2020β2027
10.4.9. Australia & New Zealand
10.4.9.1. Market Estimates & Forecast, by Type, 2020β2027
10.4.9.2. Market Estimates & Forecast, by Form, 2020β2027
10.4.9.3. Market Estimates & Forecast, by Mode of Application, 2020β2027
10.4.9.4. Market Estimates & Forecast, by Crop Type, 2020β2027
10.4.10. Rest of Asia-Pacific
10.4.10.1. Market Estimates & Forecast, by Type, 2020β2027
10.4.10.2. Market Estimates & Forecast, by Form, 2020β2027
10.4.10.3. Market Estimates & Forecast, by Mode of Application, 2020β2027
10.4.10.4. Market Estimates & Forecast, by Crop Type, 2020β2027
10.5. Rest of the World
10.5.1. Market Estimates & Forecast, by Type, 2020β2027
10.5.2. Market Estimates & Forecast, by Form, 2020β2027
10.5.3. Market Estimates & Forecast, by Mode of Application, 2020β2027
10.5.4. Market Estimates & Forecast, by Crop Type, 2020β2027
10.5.5. Market Estimates & Forecast, by Region, 2020β2027
10.5.6. South America
10.5.6.1. Market Estimates & Forecast, by Type, 2020β2027
10.5.6.2. Market Estimates & Forecast, by Form, 2020β2027
10.5.6.3. Market Estimates & Forecast, by Mode of Application, 2020β2027
10.5.6.4. Market Estimates & Forecast, by Crop Type, 2020β2027
10.5.7. Middle East
10.5.7.1. Market Estimates & Forecast, by Type, 2020β2027
10.5.7.2. Market Estimates & Forecast, by Form, 2020β2027
10.5.7.3. Market Estimates & Forecast, by Mode of Application, 2020β2027
10.5.7.4. Market Estimates & Forecast, by Crop Type, 2020β2027
10.5.8. Africa
10.5.8.1. Market Estimates & Forecast, by Type, 2020β2027
10.5.8.2. Market Estimates & Forecast, by Form, 2020β2027
10.5.8.3. Market Estimates & Forecast, by Mode of Application, 2020β2027
10.5.8.4. Market Estimates & Forecast, by Crop Type, 2020β2027
11. COMPETITIVE LANDSCAPE
11.1. Introduction
11.2. Competitive Benchmarking
11.3. Development Share Analysis
11.4. Key Developments & Growth Strategies
12. COMPANY PROFILES
12.1. Agrium Inc.
12.1.1. Company Overview
12.1.2. Financial Overview
12.1.3. Products Offered
12.1.4. Key Developments
12.1.5. SWOT Analysis
12.1.6. Key Strategies
12.2. Yara International ASA
12.2.1. Company Overview
12.2.2. Financial Overview
12.2.3. Products Offered
12.2.4. Key Developments
12.2.5. SWOT Analysis
12.2.6. Key Strategies
12.3. The Mosaic Company
12.3.1. Company Overview
12.3.2. Financial Overview
12.3.3. Products Offered
12.3.4. Key Developments
12.3.5. SWOT Analysis
12.3.6. Key Strategies
12.4. JSC Belaruskali
12.4.1. Company Overview
12.4.2. Financial Overview
12.4.3. Products Offered
12.4.4. Key Developments
12.4.5. SWOT Analysis
12.4.6. Key Strategies
12.5. Eurochem Group AG
12.5.1. Company Overview
12.5.2. Financial Overview
12.5.3. Products Offered
12.5.4. Key Developments
12.5.5. SWOT Analysis
12.5.6. Key Strategies
12.6. Borealis AG
12.6.1. Company Overview
12.6.2. Financial Overview
12.6.3. Products Offered
12.6.4. Key Developments
12.6.5. SWOT Analysis
12.6.6. Key Strategies
12.7. HELM AG
12.7.1. Company Overview
12.7.2. Financial Overview
12.7.3. Products Offered
12.7.4. Key Developments
12.7.5. SWOT Analysis
12.7.6. Key Strategies
12.8. Sinofert Holdings Limited
12.8.1. Company Overview
12.8.2. Financial Overview
12.8.3. Products Offered
12.8.4. Key Developments
12.8.5. SWOT Analysis
12.8.6. Key Strategies
12.9. Israel Chemicals Ltd.
12.9.1. Company Overview
12.9.2. Financial Overview
12.9.3. Products Offered
12.9.4. Key Developments
12.9.5. SWOT Analysis
12.9.6. Key Strategies
12.10. Nutrien
12.10.1. Company Overview
12.10.2. Financial Overview
12.10.3. Products Offered
12.10.4. Key Developments
12.10.5. SWOT Analysis
12.10.6. Key Strategies
12.11. K+S Aktiengesellschaft
12.11.1. Company Overview
12.11.2. Financial Overview
12.11.3. Products Offered
12.11.4. Key Developments
12.11.5. SWOT Analysis
12.11.6. Key Strategies
12.12. SQM S.A.
12.12.1. Company Overview
12.12.2. Financial Overview
12.12.3. Products Offered
12.12.4. Key Developments
12.12.5. SWOT Analysis
12.12.6. Key Strategies
13. APPENDIX
13.1. General Sources & References
13.2. List of Abbreviation
β
LIST OF TABLES
Table 1 Global Potash Fertilizers, by Region, 2020β2027 (USD Million)
Table 2 Global Potash Fertilizers, by Type, 2020β2027 (USD Million)
Table 3 Global Potash Fertilizers, by Form,2020β2027 (USD Million)
Table 4 Global Potash Fertilizers, by Mode of Application, 2020β2027 (USD Million)
Table 5 Global Potash Fertilizers, by Crop Type, 2020β2027 (USD Million)
Table 6 North America: Potash Fertilizers, by Country, 2020β2027 (USD Million)
Table 7 North America: Potash Fertilizers, by Type, 2020β2027 (USD Million)
Table 8 North America: Potash Fertilizers, by Form,2020β2027 (USD Million)
Table 9 North America: Potash Fertilizers, by Mode of Application, 2020β2027 (USD Million)
Table 10 North America: Potash Fertilizers, by Crop Type, 2020β2027 (USD Million)
Table 11 US: Potash Fertilizers, by Type, 2020β2027 (USD Million)
Table 12 US: Potash Fertilizers, by Form,2020β2027 (USD Million)
Table 13 US: Potash Fertilizers, by Mode of Application, 2020β2027 (USD Million)
Table 14 US: Potash Fertilizers, by Crop Type, 2020β2027 (USD Million)
Table 15 Canada: Potash Fertilizers, by Type, 2020β2027 (USD Million)
Table 16 Canada: Potash Fertilizers, by Form,2020β2027 (USD Million)
Table 17 Canada: Potash Fertilizers, by Mode of Application, 2020β2027 (USD Million)
Table 18 Canada: Potash Fertilizers, by Crop Type, 2020β2027 (USD Million)
Table 19 Mexico: Potash Fertilizers, by Type, 2020β2027 (USD Million)
Table 20 Mexico: Potash Fertilizers, by Form,2020β2027 (USD Million)
Table 21 Mexico: Potash Fertilizers, by Mode of Application, 2020β2027 (USD Million)
Table 22 Mexico: Potash Fertilizers, by Crop Type, 2020β2027 (USD Million)
Table 23 Europe: Potash Fertilizers, by Country, 2020β2027 (USD Million)
Table 24 Europe: Potash Fertilizers, by Type, 2020β2027 (USD Million)
Table 25 Europe: Potash Fertilizers, by Form,2020β2027 (USD Million)
Table 26 Europe: Potash Fertilizers, by Mode of Application, 2020β2027 (USD Million)
Table 27 Europe: Potash Fertilizers, by Crop Type, 2020β2027 (USD Million)
Table 28 Germany: Potash Fertilizers, by Type, 2020β2027 (USD Million)
Table 29 Germany: Potash Fertilizers, by Form,2020β2027 (USD Million)
Table 30 Germany: Potash Fertilizers, by Mode of Application, 2020β2027 (USD Million)
Table 31 Germany: Potash Fertilizers, by Crop Type, 2020β2027 (USD Million)
Table 32 France: Potash Fertilizers, by Type, 2020β2027 (USD Million)
Table 33 France: Potash Fertilizers, by Form,2020β2027 (USD Million)
Table 34 France: Potash Fertilizers, by Mode of Application, 2020β2027 (USD Million)
Table 35 France: Potash Fertilizers, by Crop Type, 2020β2027 (USD Million)
Table 36 Italy: Potash Fertilizers, by Type, 2020β2027 (USD Million)
Table 37 Italy: Potash Fertilizers, by Form,2020β2027 (USD Million)
Table 38 Italy: Potash Fertilizers, by Mode of Application, 2020β2027 (USD Million)
Table 39 Italy: Potash Fertilizers, by Crop Type, 2020β2027 (USD Million)
Table 40 Spain: Potash Fertilizers, by Type, 2020β2027 (USD Million)
Table 41 Spain: Potash Fertilizers, by Form,2020β2027 (USD Million)
Table 42 Spain: Potash Fertilizers, by Mode of Application, 2020β2027 (USD Million)
Table 43 Spain: Potash Fertilizers, by Crop Type, 2020β2027 (USD Million)
Table 44 UK: Potash Fertilizers, by Type, 2020β2027 (USD Million)
Table 45 UK: Potash Fertilizers, by Form,2020β2027 (USD Million)
Table 46 UK: Potash Fertilizers, by Mode of Application, 2020β2027 (USD Million)
Table 47 UK: Potash Fertilizers, by Crop Type, 2020β2027 (USD Million)
Table 48 Rest of Europe: Potash Fertilizers, by Type, 2020β2027 (USD Million)
Table 49 Rest of Europe: Potash Fertilizers, by Form,2020β2027 (USD Million)
Table 50 Rest of Europe: Potash Fertilizers, by Mode of Application, 2020β2027 (USD Million)
Table 51 Rest of Europe: Potash Fertilizers, by Crop Type, 2020β2027 (USD Million)
Table 52 Asia-Pacific: Potash Fertilizers, by Country, 2020β2027 (USD Million)
Table 53 Asia-Pacific: Potash Fertilizers, by Type, 2020β2027 (USD Million)
Table 54 Asia-Pacific: Potash Fertilizers, by Form,2020β2027 (USD Million)
Table 55 Asia-Pacific: Potash Fertilizers, by Mode of Application, 2020β2027 (USD Million)
Table 56 Asia-Pacific: Potash Fertilizers, by Crop Type, 2020β2027 (USD Million)
Table 57 China: Potash Fertilizers, by Type, 2020β2027 (USD Million)
Table 58 China: Potash Fertilizers, by Form,2020β2027 (USD Million)
Table 59 China: Potash Fertilizers, by Mode of Application, 2020β2027 (USD Million)
Table 60 China: Potash Fertilizers, by Crop Type, 2020β2027 (USD Million)
Table 61 India: Potash Fertilizers, by Type, 2020β2027 (USD Million)
Table 62 India: Potash Fertilizers, by Form,2020β2027 (USD Million)
Table 63 India: Potash Fertilizers, by Mode of Application, 2020β2027 (USD Million)
Table 64 India: Potash Fertilizers, by Crop Type, 2020β2027 (USD Million)
Table 65 Japan: Potash Fertilizers, by Type, 2020β2027 (USD Million)
Table 66 Japan: Potash Fertilizers, by Form,2020β2027 (USD Million)
Table 67 Japan: Potash Fertilizers, by Mode of Application, 2020β2027 (USD Million)
Table 68 Japan: Potash Fertilizers, by Crop Type, 2020β2027 (USD Million)
Table 69 Australia & New Zealand: Potash Fertilizers, by Type, 2020β2027 (USD Million)
Table 70 Australia & New Zealand: Potash Fertilizers, by Form,2020β2027 (USD Million)
Table 71 Australia & New Zealand: Potash Fertilizers, by Mode of Application, 2020β2027 (USD Million)
Table 72 Australia & New Zealand: Potash Fertilizers, by Crop Type, 2020β2027 (USD Million)
Table 73 Rest of Asia-Pacific: Potash Fertilizers, by Type, 2020β2027 (USD Million)
Table 74 Rest of Asia-Pacific: Potash Fertilizers, by Form,2020β2027 (USD Million)
Table 75 Rest of Asia-Pacific: Potash Fertilizers, by Mode of Application, 2020β2027 (USD Million)
Table 76 Rest of Asia-Pacific: Potash Fertilizers, by Crop Type, 2020β2027 (USD Million)
Table 77 Rest of the World (RoW): Potash Fertilizers, by Country, 2020β2027 (USD Million)
Table 78 Rest of the World (RoW): Potash Fertilizers, by Type, 2020β2027 (USD Million)
Table 79 Rest of the World (RoW): Potash Fertilizers, by Form,2020β2027 (USD Million)
Table 80 Rest of the World (RoW): Potash Fertilizers, by Mode of Application, 2020β2027 (USD Million)
Table 81 Rest of the World (RoW): Potash Fertilizers, by Crop Type, 2020β2027 (USD Million)
Table 82 South America: Potash Fertilizers, by Type, 2020β2027 (USD Million)
Table 83 South America: Potash Fertilizers, by Form,2020β2027 (USD Million)
Table 84 South America: Potash Fertilizers, by Mode of Application, 2020β2027 (USD Million)
Table 85 South America: Potash Fertilizers, by Crop Type, 2020β2027 (USD Million)
Table 86 Middle East: Potash Fertilizers, by Type, 2020β2027 (USD Million)
Table 87 Middle East: Potash Fertilizers, by Form,2020β2027 (USD Million)
Table 88 Middle East: Potash Fertilizers, by Mode of Application, 2020β2027 (USD Million)
Table 89 Middle East: Potash Fertilizers, by Crop Type, 2020β2027 (USD Million)
Table 90 Africa: Potash Fertilizers, by Type, 2020β2027 (USD Million)
Table 91 Africa: Potash Fertilizers, by Form,2020β2027 (USD Million)
Table 92 Africa: Potash Fertilizers, by Mode of Application, 2020β2027 (USD Million)
Table 93 Africa: Potash Fertilizers, by Crop Type, 2020β2027 (USD Million)
β
LIST OF FIGURES
FIGURE 1 Global Potash Fertilizers Market Segmentation
FIGURE 2 Forecast Research Methodology
FIGURE 3 Five Forces Analysis of the Global Potash Fertilizers Market
FIGURE 4 Value Chain of the Global Potash Fertilizers Market
FIGURE 5 Share of the Global Potash Fertilizers Market in 2020, by Country (%)
FIGURE 6 Global Potash Fertilizers Market, by Region, 2020β2027,
FIGURE 7 Global Potash Fertilizers Market Size, by Type, 2020
FIGURE 8 Share of the Global Potash Fertilizers Market, by Type, 2020β2027 (%)
FIGURE 9 Global Potash Fertilizers Market Size, by Form, 2020
FIGURE 10 Share of the Global Potash Fertilizers Market, by Form, 2020β2027 (%)
FIGURE 9 Global Potash Fertilizers Market Size, by Mode of Application, 2020
FIGURE 10 Share of the Global Potash Fertilizers Market, by Mode of Application, 2020β2027 (%)
FIGURE 9 Global Potash Fertilizers Market Size, by Crop Type, 2020
FIGURE 10 Share of the Global Potash Fertilizers Market, by Crop Type, 2020β2027 (%)
$28 billion
4.56%
Asia-Pacific
2020- 2030
Market Scenario
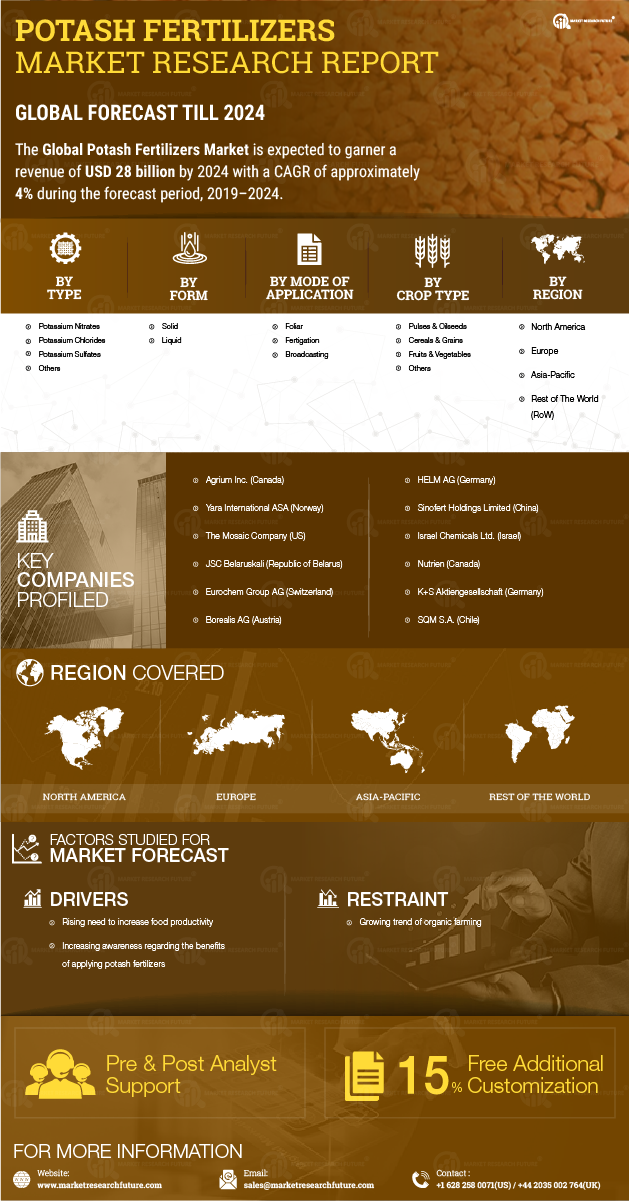
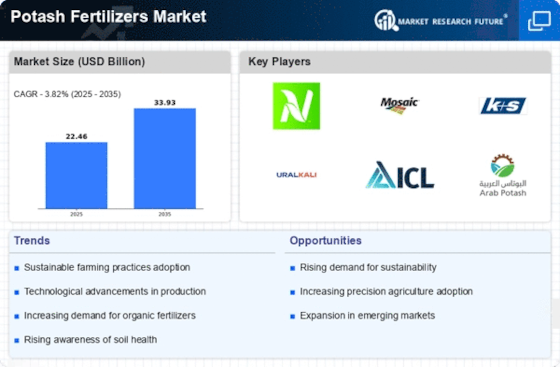
Global Potash Fertilizers Market is expected to garner a revenue of USD 28 billion by 2024 with a CAGR of approximately 4% during the forecast period, 2019–2024. Potash fertilizers are used in the form of salts by mixing potassium with different salts such as nitrates, sulfates, or chlorides. The major determinants driving the growth of global potash fertilizer market are the rising need to increase food productivity in limited land area and increasing awareness regarding the benefits of applying potash fertilizers during different growth stages of a crop. Potash fertilizers help in improving the overall crop health, ensures proper maturity, and increases crop yield. Thus, there is a rise in the use of potash fertilizers in various crops, especially fruits & vegetables. However, the market is witnessing hurdles in its growth, owing to the growing trend of organic farming. Consumers, especially in developed nations such as the US, are increasingly opting for natural food products. Thus, there is a decline in the demand for synthetic potash fertilizers among organic farmers. The market players are expected to witness lucrative opportunities in the global potash fertilizers market during the upcoming years owing to the increasing need to improve pasture production and quality, along with increasing government initiatives to promote agriculture and allied activities.
Segmentation
The global potash fertilizers market has been segmented based on type, form, mode of application, crop type, and region.
By type, the global potash fertilizers market has been classified as potassium nitrates, potassium chlorides, and potassium sulfates
The global potash fertilizers market has also been divided, based on form, into solid and liquid.
Based on mode of application, the global market is segregated into foliar, fertigation, and broadcasting.
By crop type, the global potash fertilizers market has been classified as pulses & oilseeds, cereals & grains, fruits & vegetables, and others.
The global potash fertilizers market has been studied with regard to four key regions—North America, Europe, Asia-Pacific, and the rest of the world.
The North American potash fertilizers market has further been segmented into the US, Canada, and Mexico. The European potash fertilizers market has been classified as the UK, Germany, France, Italy, Spain, and the rest of Europe. The potash fertilizers market in Asia-Pacific has been segmented into China, India, Japan, Australia and New Zealand, and the rest of Asia-Pacific. The potash fertilizers market in the rest of the world has been segmented into South America, the Middle East, and Africa.
Key Players
Agrium Inc. (Canada), Yara International ASA (Norway), The Mosaic Company (US), JSC Belaruskali (Republic of Belarus), Eurochem Group AG (Switzerland), Borealis AG (Austria), HELM AG (Germany), Sinofert Holdings Limited (China), Israel Chemicals Ltd. (Israel), Nutrien (Canada), K+S Aktiengesellschaft (Germany), and SQM S.A. (Chile) are some of the key players in the global potash fertilizers market.
Regional Market Summary
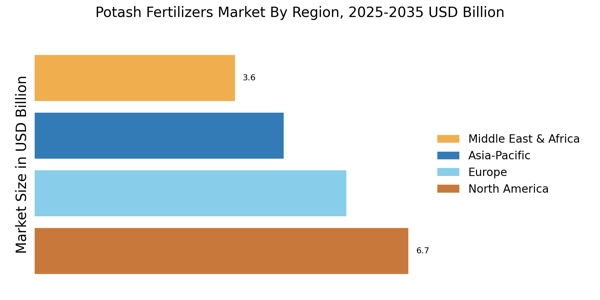
Asia-Pacific is expected to dominate the global potash fertilizers market throughout the review period due to the importance of agriculture in the region, along with the high dependence on the region’s agricultural produce to meet the growing food demand. India, China, and Japan are the amongst the prominent country-level markets contributing to the growth of the regional potash fertilizers market. Additionally, increasing vegetable production in the region is also fuelling the regional market growth as potash fertilizers are increasingly being used during vegetable cultivation to maintain the potassium content in the vegetables. Thus, due to these factors, the region is also expected to register the highest CAGR during the forecast period, 2019–2024.
Frequently Asked Questions (FAQ) :
potash fertilizers market is projected to grow at a 4% CAGR between 2019-2024.
potash fertilizers market is predicted to touch USD 28 billion by 2024.
The APAC region is projected to spearhead the potash fertilizers market.
Fruits and vegetables will lead the potash fertilizers market.
Rising trend of organic farming may limit the potash fertilizers market growth.