ID: MRFR/CR/7102-HCR | February 2021 | Region: Global | 110 Pages
Table of Contents
1. EXECUTIVE SUMMARY
2. MARKET INTRODUCTION
2.1. Market Definition
2.2. Scope of the Study
2.2.1. Research Objectives
2.2.2. Assumptions & Limitations
2.3. Market Structure
3. MARKET RESEARCH METHODOLOGY
3.1. Research Process
3.2. Secondary Research
3.3. Primary Research
3.4. Forecast Model
4. MARKET LANDSCAPE
4.1. Supply Chain Analysis
4.1.1. Raw Material Suppliers
4.1.2. Manufacturers/Producers
4.1.3. Distributors/Retailers/Wholesalers/E-Commerce
4.1.4. End Users
4.2. Porterβs Five Forces Analysis
4.2.1. Threat of New Entrants
4.2.2. Bargaining Power of Buyers
4.2.3. Bargaining Power of Suppliers
4.2.4. Threat of Substitutes
4.2.5. Internal Rivalry
5. MARKET DYNAMICS OF THE GLOBAL POOL TABLES MARKET
5.1. Introduction
5.2. Drivers
5.3. Restraints
5.4. Opportunities
5.5. Challenges
6. GLOBAL POOL TABLES MARKET, BY TYPE
6.1. Introduction
6.1.1. Market Estimates & Forecast, by Type, 2019β2025
6.1.2. Market Estimates & Forecast, by Region, 2019β2025
6.2. American Pool Tables
6.2.1. American Pool Tables: Market Estimates & Forecast, 2019β2025
6.2.2. American Pool Tables: Market Estimates & Forecast, by Region, 2019β2025
6.3. English Pool Tables
6.3.1. English Pool Tables: Market Estimates & Forecast, 2019β2025
6.3.2. English Pool Tables: Market Estimates & Forecast, by Region, 2019β2025
6.4. Others
6.4.1. Others: Market Estimates & Forecast, 2019β2025
6.4.2. Others: Market Estimates & Forecast, by Region, 2019β2025
7. GLOBAL POOL TABLES MARKET, BY SIZE
7.1. Introduction
7.1.1. Market Estimates & Forecast, by Size, 2019β2025
7.1.2. Market Estimates & Forecast, by Region, 2019β2025
7.2. 7 ft
7.2.1. 7 ft: Market Estimates & Forecast, 2019β2025
7.2.2. 7 ft: Market Estimates & Forecast, by Region, 2019β2025
7.3. 8 ft
7.3.1. 8 ft: Market Estimates & Forecast, 2019β2025
7.3.2. 8 ft: Market Estimates & Forecast, by Region, 2019β2025
7.4. 9 ft
7.4.1. 9 ft: Market Estimates & Forecast, 2019β2025
7.4.2. 9 ft: Market Estimates & Forecast, by Region, 2019β2025
7.5. Others
7.5.1. Others: Market Estimates & Forecast, 2019β2025
7.5.2. Others: Market Estimates & Forecast, by Region, 2019β2025
8. GLOBAL POOL TABLES MARKET, BY END USE
8.1. Introduction
8.1.1. Market Estimates & Forecast, by Type, 2019β2025
8.1.2. Market Estimates & Forecast, by Region, 2019β2025
8.2. Household
8.2.1. Household: Market Estimates & Forecast, 2019β2025
8.2.2. Household: Market Estimates & Forecast, by Region, 2019β2025
8.3. Commercial
8.3.1. Commercial: Market Estimates & Forecast, 2019β2025
8.3.2. Commercial: Market Estimates & Forecast, by Region, 2019β2025
8.4. Professional
8.4.1. Professional: Market Estimates & Forecast, 2019β2025
8.4.2. Professional: Market Estimates & Forecast, by Region, 2019β2025
9. GLOBAL POOL TABLES MARKET, BY REGION
9.1. Introduction
9.2. North America
9.2.1. Market Estimates & Forecast, 2019β2025
9.2.2. Market Estimates & Forecast, by Type, 2019β2025
9.2.3. Market Estimates & Forecast, by Size, 2019β2025
9.2.4. Market Estimates & Forecast, by End Use, 2019β2025
9.2.5. Market Estimates & Forecast, by Country, 2019β2025
9.2.6. US
9.2.6.1. Market Estimates & Forecast, by Type, 2019β2025
9.2.6.2. Market Estimates & Forecast, by Size, 2019β2025
9.2.6.3. Market Estimates & Forecast, by End Use, 2019β2025
9.2.7. Canada
9.2.7.1. Market Estimates & Forecast, by Type, 2019β2025
9.2.7.2. Market Estimates & Forecast, by Size, 2019β2025
9.2.7.3. Market Estimates & Forecast, by End Use, 2019β2025
9.2.8. Mexico
9.2.8.1. Market Estimates & Forecast, by Type, 2019β2025
9.2.8.2. Market Estimates & Forecast, by Size, 2019β2025
9.2.8.3. Market Estimates & Forecast, by End Use, 2019β2025
9.3. Europe
9.3.1. Market Estimates & Forecast, 2019β2025
9.3.2. Market Estimates & Forecast, by Type, 2019β2025
9.3.3. Market Estimates & Forecast, by Size, 2019β2025
9.3.4. Market Estimates & Forecast, by End Use, 2019β2025
9.3.5. Market Estimates & Forecast, by Country, 2019β2025
9.3.6. Germany
9.3.6.1. Market Estimates & Forecast, by Type, 2019β2025
9.3.6.2. Market Estimates & Forecast, by Size, 2019β2025
9.3.6.3. Market Estimates & Forecast, by End Use, 2019β2025
9.3.7. UK
9.3.7.1. Market Estimates & Forecast, by Type, 2019β2025
9.3.7.2. Market Estimates & Forecast, by Size, 2019β2025
9.3.7.3. Market Estimates & Forecast, by End Use, 2019β2025
9.3.8. France
9.3.8.1. Market Estimates & Forecast, by Type, 2019β2025
9.3.8.2. Market Estimates & Forecast, by Size, 2019β2025
9.3.8.3. Market Estimates & Forecast, by End Use, 2019β2025
9.3.9. Spain
9.3.9.1. Market Estimates & Forecast, by Type, 2019β2025
9.3.9.2. Market Estimates & Forecast, by Size, 2019β2025
9.3.9.3. Market Estimates & Forecast, by End Use, 2019β2025
9.3.10. Italy
9.3.10.1. Market Estimates & Forecast, by Type, 2019β2025
9.3.10.2. Market Estimates & Forecast, by Size, 2019β2025
9.3.10.3. Market Estimates & Forecast, by End Use, 2019β2025
9.3.11. Rest of Europe
9.3.11.1. Market Estimates & Forecast, by Type, 2019β2025
9.3.11.2. Market Estimates & Forecast, by Size, 2019β2025
9.3.11.3. Market Estimates & Forecast, by End Use, 2019β2025
9.4. Asia-Pacific
9.4.1. Market Estimates & Forecast, 2019β2025
9.4.2. Market Estimates & Forecast, by Type, 2019β2025
9.4.3. Market Estimates & Forecast, by Size, 2019β2025
9.4.4. Market Estimates & Forecast, by End Use, 2019β2025
9.4.5. Market Estimates & Forecast, by Country, 2019β2025
9.4.6. China
9.4.6.1. Market Estimates & Forecast, by Type, 2019β2025
9.4.6.2. Market Estimates & Forecast, by Size, 2019β2025
9.4.6.3. Market Estimates & Forecast, by End Use, 2019β2025
9.4.7. Japan
9.4.7.1. Market Estimates & Forecast, by Type, 2019β2025
9.4.7.2. Market Estimates & Forecast, by Size, 2019β2025
9.4.7.3. Market Estimates & Forecast, by End Use, 2019β2025
9.4.8. India
9.4.8.1. Market Estimates & Forecast, by Type, 2019β2025
9.4.8.2. Market Estimates & Forecast, by Size, 2019β2025
9.4.8.3. Market Estimates & Forecast, by End Use, 2019β2025
9.4.9. Australia & New Zealand
9.4.9.1. Market Estimates & Forecast, by Type, 2019β2025
9.4.9.2. Market Estimates & Forecast, by Size, 2019β2025
9.4.9.3. Market Estimates & Forecast, by End Use, 2019β2025
9.4.10. Rest of Asia-Pacific
9.4.10.1. Market Estimates & Forecast, by Type, 2019β2025
9.4.10.2. Market Estimates & Forecast, by Size, 2019β2025
9.4.10.3. Market Estimates & Forecast, by End Use, 2019β2025
9.5. Rest of the World
9.5.1. Market Estimates & Forecast, 2019β2025
9.5.2. Market Estimates & Forecast, by Type, 2019β2025
9.5.3. Market Estimates & Forecast, by Size, 2019β2025
9.5.4. Market Estimates & Forecast, by End Use, 2019β2025
9.5.5. Market Estimates & Forecast, by Region, 2019β2025
9.5.6. South America
9.5.6.1. Market Estimates & Forecast, by Type, 2019β2025
9.5.6.2. Market Estimates & Forecast, by Size, 2019β2025
9.5.6.3. Market Estimates & Forecast, by End Use, 2019β2025
9.5.7. Middle East
9.5.7.1. Market Estimates & Forecast, by Type, 2019β2025
9.5.7.2. Market Estimates & Forecast, by Size, 2019β2025
9.5.7.3. Market Estimates & Forecast, by End Use, 2019β2025
9.5.8. Africa
9.5.8.1. Market Estimates & Forecast, by Type, 2019β2025
9.5.8.2. Market Estimates & Forecast, by Size, 2019β2025
9.5.8.3. Market Estimates & Forecast, by End Use, 2019β2025
10. COMPETITIVE LANDSCAPE
10.1. Introduction
10.2. Market Strategy
10.3. Key Development Analysis
(Expansions/Mergers & Acquisitions/Joint Ventures/New Product Developments/Agreements/Investments)
11. COMPANY PROFILES
11.1. Olhausen Billiard MFG, Inc.
11.1.1. Company Overview
11.1.2. Financial Updates
11.1.3. Product/Business Segment Overview
11.1.4. Strategies
11.1.5. Key Developments
11.1.6. SWOT Analysis
11.2. Diamond Billiard Products Inc.
11.2.1. Company Overview
11.2.2. Financial Updates
11.2.3. Product/Business Segment Overview
11.2.4. Strategies
11.2.5. Key Developments
11.2.6. SWOT Analysis
11.3. Rene Pierre
11.3.1. Company Overview
11.3.2. Financial Updates
11.3.3. Product/Business Segment Overview
11.3.4. Strategies
11.3.5. Key Developments
11.3.6. SWOT Analysis
11.4. Chevillotte
11.4.1. Company Overview
11.4.2. Financial Updates
11.4.3. Product/Business Segment Overview
11.4.4. Strategies
11.4.5. Key Developments
11.4.6. SWOT Analysis
11.5. Brunswick Billiards
11.5.1. Company Overview
11.5.2. Financial Updates
11.5.3. Product/Business Segment Overview
11.5.4. Strategies
11.5.5. Key Developments
11.5.6. SWOT Analysis
11.6. R.S. Billiard & Pool Table
11.6.1. Company Overview
11.6.2. Financial Updates
11.6.3. Product/Business Segment Overview
11.6.4. Strategies
11.6.5. Key Developments
11.6.6. SWOT Analysis
11.7. Legacy Billiards
11.7.1. Company Overview
11.7.2. Financial Updates
11.7.3. Product/Business Segment Overview
11.7.4. Strategies
11.7.5. Key Developments
11.7.6. SWOT Analysis
11.8. Valley-Dynamo, Inc.
11.8.1. Company Overview
11.8.2. Financial Updates
11.8.3. Product/Business Segment Overview
11.8.4. Strategies
11.8.5. Key Developments
11.8.6. SWOT Analysis
11.9. Blatt Billiards Corp.
11.9.1. Company Overview
11.9.2. Financial Updates
11.9.3. Product/Business Segment Overview
11.9.4. Strategies
11.9.5. Key Developments
11.9.6. SWOT Analysis
11.10. Imperial International
11.10.1. Company Overview
11.10.2. Financial Updates
11.10.3. Product/Business Segment Overview
11.10.4. Strategies
11.10.5. Key Developments
11.10.6. SWOT Analysis
11.11. Gabriels Billiards
11.11.1. Company Overview
11.11.2. Financial Updates
11.11.3. Product/Business Segment Overview
11.11.4. Strategies
11.11.5. Key Developments
11.11.6. SWOT Analysis
11.12. Riley England
11.12.1. Company Overview
11.12.2. Financial Updates
11.12.3. Product/Business Segment Overview
11.12.4. Strategies
11.12.5. Key Developments
11.12.6. SWOT Analysis
11.13. American Heritage Billiards
11.13.1. Company Overview
11.13.2. Financial Updates
11.13.3. Product/Business Segment Overview
11.13.4. Strategies
11.13.5. Key Developments
11.13.6. SWOT Analysis
11.14. Maestato Nitschke Kozakiewicz General Partnership
11.14.1. Company Overview
11.14.2. Financial Updates
11.14.3. Product/Business Segment Overview
11.14.4. Strategies
11.14.5. Key Developments
11.14.6. SWOT Analysis
11.15. Beijing Xingpai Weiye Sporting Goods Co., Ltd.
11.15.1. Company Overview
11.15.2. Financial Updates
11.15.3. Product/Business Segment Overview
11.15.4. Strategies
11.15.5. Key Developments
11.15.6. SWOT Analysis
12. APPENDIX
12.1. General Sources & References
12.2. List of Abbreviations
LIST OF TABLES
Table 1 Global Pool Tables Market, by Region, 2020β2027 (USD Million)
Table 2 Global Pool Tables Market, by Type, 2020β2027 (USD Million)
Table 3 Global Pool Tables Market, by Size, 2020β2027 (USD Million)
Table 4 Global Pool Tables Market, by End Use, 2020β2027 (USD Million)
Table 5 North America: Pool Tables Market, by Country, 2020β2027 (USD Million)
Table 6 North America: Pool Tables Market, by Type, 2020β2027 (USD Million)
Table 7 North America: Pool Tables Market, by Size, 2020β2027 (USD Million)
Table 8 North America: Pool Tables Market, by End Use, 2020β2027 (USD Million)
Table 9 US: Pool Tables Market, by Type, 2020β2027 (USD Million)
Table 10 US: Pool Tables Market, by Size, 2020β2027 (USD Million)
Table 11 US: Pool Tables Market, by End Use, 2020β2027 (USD Million)
Table 12 Canada: Pool Tables Market, by Type, 2020β2027 (USD Million)
Table 13 Canada: Pool Tables Market, by Size, 2020β2027 (USD Million)
Table 14 Canada: Pool Tables Market, by End Use, 2020β2027 (USD Million)
Table 15 Mexico: Pool Tables Market, by Type, 2020β2027 (USD Million)
Table 16 Mexico: Pool Tables Market, by Size, 2020β2027 (USD Million)
Table 17 Mexico: Pool Tables Market, by End Use, 2020β2027 (USD Million)
Table 18 Europe: Pool Tables Market, by Country, 2020β2027 (USD Million)
Table 19 Europe: Pool Tables Market, by Type, 2020β2027 (USD Million)
Table 20 Europe: Pool Tables Market, by Size, 2020β2027 (USD Million)
Table 21 Europe: Pool Tables Market, by End Use, 2020β2027 (USD Million)
Table 22 Germany: Pool Tables Market, by Type, 2020β2027 (USD Million)
Table 23 Germany: Pool Tables Market, by Size, 2020β2027 (USD Million)
Table 24 Germany: Pool Tables Market, by End Use, 2020β2027 (USD Million)
Table 25 France: Pool Tables Market, by Type, 2020β2027 (USD Million)
Table 26 France: Pool Tables Market, by Size, 2020β2027 (USD Million)
Table 27 France: Pool Tables Market, by End Use, 2020β2027 (USD Million)
Table 28 Italy: Pool Tables Market, by Type, 2020β2027 (USD Million)
Table 29 Italy: Pool Tables Market, by Size, 2020β2027 (USD Million)
Table 30 Italy: Pool Tables Market, by End Use, 2020β2027 (USD Million)
Table 31 Spain: Pool Tables Market, by Type, 2020β2027 (USD Million)
Table 32 Spain: Pool Tables Market, by Size, 2020β2027 (USD Million)
Table 33 Spain: Pool Tables Market, by End Use, 2020β2027 (USD Million)
Table 34 UK: Pool Tables Market, by Type, 2020β2027 (USD Million)
Table 35 UK: Pool Tables Market, by Size, 2020β2027 (USD Million)
Table 36 UK: Pool Tables Market, by End Use, 2020β2027 (USD Million)
Table 37 Rest of Europe: Pool Tables Market, by Type, 2020β2027 (USD Million)
Table 38 Rest of Europe: Pool Tables Market, by Size, 2020β2027 (USD Million)
Table 39 Rest of Europe: Pool Tables Market, by End Use, 2020β2027 (USD Million)
Table 40 Asia-Pacific: Pool Tables Market, by Country, 2020β2027 (USD Million)
Table 41 Asia-Pacific: Pool Tables Market, by Type, 2020β2027 (USD Million)
Table 42 Asia-Pacific: Pool Tables Market, by Size, 2020β2027 (USD Million)
Table 43 Asia-Pacific: Pool Tables Market, by End Use, 2020β2027 (USD Million)
Table 44 China: Pool Tables Market, by Type, 2020β2027 (USD Million)
Table 45 China: Pool Tables Market, by Size, 2020β2027 (USD Million)
Table 46 China: Pool Tables Market, by End Use, 2020β2027 (USD Million)
Table 47 India: Pool Tables Market, by Type, 2020β2027 (USD Million)
Table 48 India: Pool Tables Market, by Size, 2020β2027 (USD Million)
Table 49 India: Pool Tables Market, by End Use, 2020β2027 (USD Million)
Table 50 Japan: Pool Tables Market, by Type, 2020β2027 (USD Million)
Table 51 Japan: Pool Tables Market, by Size, 2020β2027 (USD Million)
Table 52 Japan: Pool Tables Market, by End Use, 2020β2027 (USD Million)
Table 53 Australia & New Zealand: Pool Tables Market, by Type, 2020β2027 (USD Million)
Table 54 Australia & New Zealand: Pool Tables Market, by Size, 2020β2027 (USD Million)
Table 55 Australia & New Zealand: Pool Tables Market, by End Use, 2020β2027 (USD Million)
Table 56 Rest of Asia-Pacific: Pool Tables Market, by Type, 2020β2027 (USD Million)
Table 57 Rest of Asia-Pacific: Pool Tables Market, by Size, 2020β2027 (USD Million)
Table 58 Rest of Asia-Pacific: Pool Tables Market, by End Use, 2020β2027 (USD Million)
Table 59 Rest of the World (RoW): Pool Tables Market, by Region, 2020β2027 (USD Million)
Table 60 Rest of the World (RoW): Pool Tables Market, by Type, 2020β2027 (USD Million)
Table 61 Rest of the World (RoW): Pool Tables Market, by Size, 2020β2027 (USD Million)
Table 62 Rest of the World (RoW): Pool Tables Market, by End Use, 2020β2027 (USD Million)
Table 63 South America: Pool Tables Market, by Type, 2020β2027 (USD Million)
Table 64 South America: Pool Tables Market, by Size, 2020β2027 (USD Million)
Table 65 South America: Pool Tables Market, by End Use, 2020β2027 (USD Million)
Table 66 Middle East: Pool Tables Market, by Type, 2020β2027 (USD Million)
Table 67 Middle East: Pool Tables Market, by Size, 2020β2027 (USD Million)
Table 68 Middle East: Pool Tables Market, by End Use, 2020β2027 (USD Million)
Table 69 Africa: Pool Tables Market, by Type, 2020β2027 (USD Million)
Table 70 Africa: Pool Tables Market, by Size, 2020β2027 (USD Million)
Table 71 Africa: Pool Tables Market, by End Use, 2020β2027 (USD Million)
LIST OF FIGURES
FIGURE 1 Global Pool Tables Market Segmentation
FIGURE 2 Forecast Research Methodology
FIGURE 3 Five Forces Analysis of the Global Pool Tables Market
FIGURE 4 Value Chain of the Global Pool Tables Market
FIGURE 5 Share of the Global Pool Tables Market in 2019, by Country (%)
FIGURE 6 Global Pool Tables Market, by Region, 2019β2025
FIGURE 7 Global Pool Tables Market Size, by Type, 2019β2025
FIGURE 8 Share of the Pool Tables Market, by Type, 2019β2025 (%)
FIGURE 9 Global Pool Tables Market Size, by Size, 2019β2025
FIGURE 10 Share of the Pool Tables Market, by Size, 2019β2025 (%)
FIGURE 11 Global Pool Tables Market Size, by End Use, 2019β2025
FIGURE 12 Share of the Pool Tables Market, by End Use, 2019β2025 (%)
$299.7 million
5.8%
Asia Pacific
2020-2030
Pool Tables Market Scenario
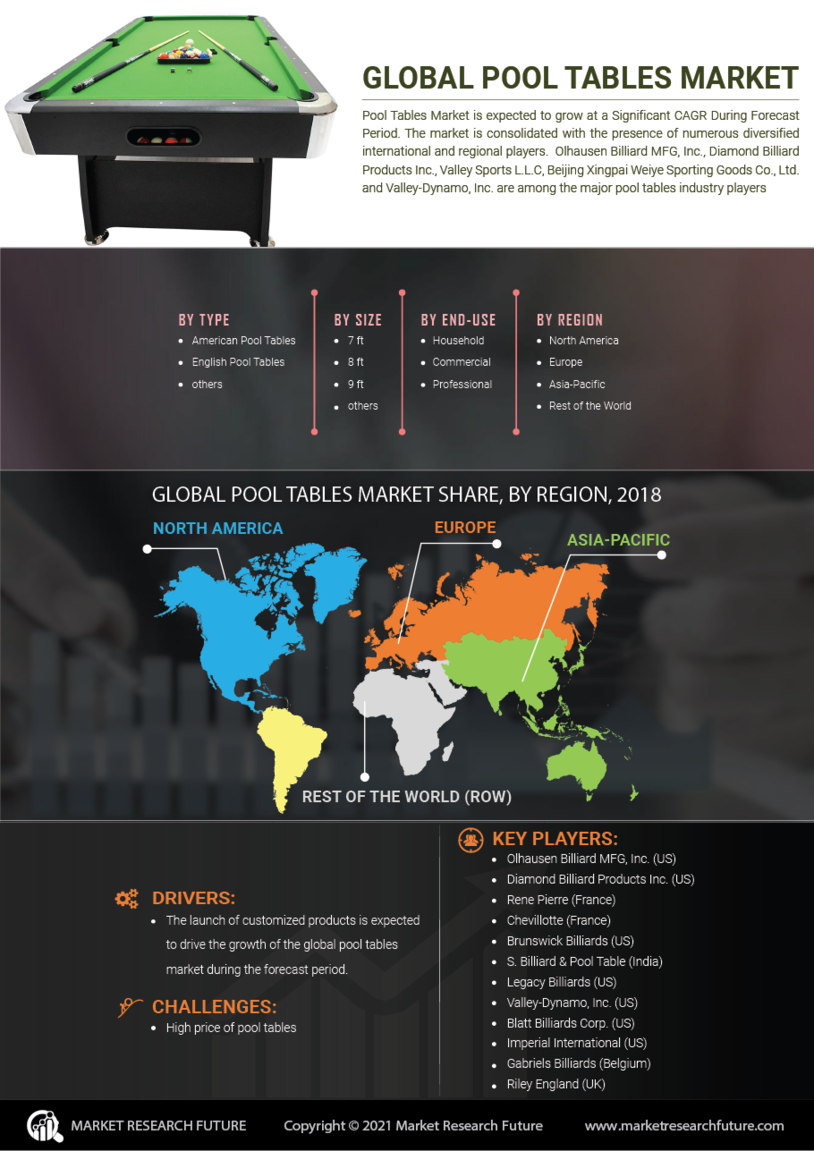
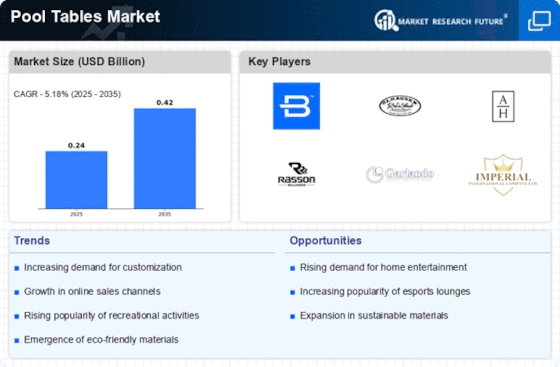
Pool Tables Market is projected to reach USD 258.8 Million by 2025 at a CAGR of 3.6% from 2019 to 2025. The market is consolidated with the presence of numerous diversified international and regional players. Olhausen Billiard MFG, Inc., Diamond Billiard Products Inc., Valley Sports L.L.C, Beijing Xingpai Weiye Sporting Goods Co., Ltd. and Valley-Dynamo, Inc. are among the major pool tables industry players. These international players control the market due to their extensive product portfolios, high quality, competitive pricing, and wide market reach. Few manufacturers, such as the US-based Blatt Billiards Corp., offer special handcrafted and custom-made pool tables for household and commercial use. The launch of customized products is expected to drive the growth of the global pool tables market during the forecast period.
Market Synopsis
Pool tables come in different sizes, such as 9 ft, 8 ft, and 7 ft, depending on the use. For instance, the 9×4.5 ft and 8×4 ft pool tables are approved for tournament play by the World Pool-Billiard Association, which is recognized by the International Olympic Committee. The 7 ft pool tables are widely used in homes and bars. Manufacturers such as Olhausen Billiard MFG, Inc. also offer tailor-made pool tables customized as per the buyers’ needs. The increasing adoption of cue sports and recreational activities are driving pool tables market trends. However, the high prices of pool tables are affecting the pool tables' market growth.
Market USP
Availability of customized and handcrafted pool tables
Market Drivers
Market Restraints
Segmentation
By Type
By Size
By End-Use
By Region
Key Players
Frequently Asked Questions (FAQ) :
Pool tables market is projected to grow at a 3.6% CAGR between 2020-2027.
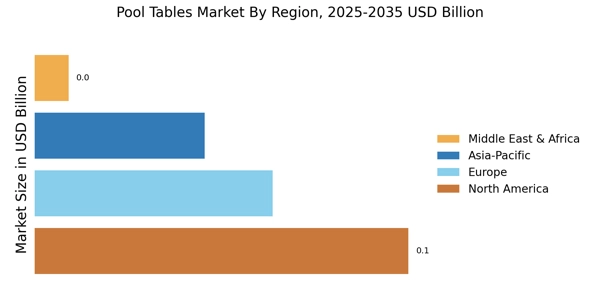
The Asia Pacific is expected to lead the pool tables market.
Pool tables market is predicted to touch USD 258.8 million by 2025.
Commercial segment will lead the pool tables market.
American pool tables will dominate the pool tables market.