ID: MRFR/CnM/4294-CR | August 2019 | Region: Global | 134 Pages
1 Executive Summary
1.1 Market Attractiveness Analysis 17
1.1.1 Global Polyglycolic Acid (PGA) Market, By Form 18
1.1.2 Global Polyglycolic Acid (PGA) Market, By Application 19
2 Market Introduction
2.1 Definition 20
2.2 Scope of the Study 20
2.3 Market Structure 20
3 Market Insights
4 Research Methodology
4.1 Research Process 24
4.2 Primary Research 25
4.3 Secondary Research 26
4.4 Market Size Estimation 26
4.5 Forecast Model 27
4.6 List of Assumptions 28
5 Market Dynamics
5.1 Introduction 29
5.2 Drivers 30
5.2.1 Increasing Shale Gas Exploration Activities in the US 30
5.2.2 Increasing Demand in the Healthcare Industry 30
5.3 Restraints 32
5.3.1 Availability of Substitutes and High-Cost of Production 32
5.4 Opportunities 33
5.4.1 Development of New Technologies for PGA Production 33
5.4.2 Robust Outlook of Shale Gas Extraction in Asia 33
5.4.3 Increasing Adoption in the Packaging Industry 33
5.5 Trends 35
5.5.1 Growing Emphasis on Capacity Expansion 35
6 Market Factor Analysis
6.1 Supply Chain Analysis 36
6.1.1 Raw Material Suppliers 36
6.1.2 Polyglycolic Acid Producers 36
6.1.3 Distribution Channel 37
6.1.4 End-Use Industry 37
6.2 Porterβs Five Forces Model 37
6.2.1 Threat of New Entrants 38
6.2.2 Threat of Rivalry 38
6.2.3 Threat of Substitutes 38
6.2.4 Bargaining Power of Suppliers 38
6.2.5 Bargaining Power of Buyers 38
6.3 Pricing Analysis (2010β2018) 39
7 Global Polyglycolic Acid (PGA) Market, by Form
7.1 Introduction 40
7.2 Fiber 42
7.3 Film 43
7.4 Others 44
8 Global Polyglycolic Acid (PGA) Market, by Application
8.1 Introduction 46
8.2 Oil & Gas Extraction 48
8.3 Medical 49
8.4 Packaging 51
8.5 Others 52
9 Global Polyglycolic Acid (PGA) Market, by Region
9.1 Introduction 53
9.2 North America 58
9.2.1 US 60
9.2.2 Canada 63
9.3 Europe 65
9.3.1 Germany 68
9.3.2 UK 70
9.3.3 Russia 71
9.3.4 France 73
9.3.5 Spain 75
9.3.6 Italy 76
9.3.7 Poland 78
9.3.8 Rest of Europe 80
9.4 Asia-Pacific 81
9.4.1 China 85
9.4.2 Japan 87
9.4.3 India 88
9.4.4 Australia and New Zealand 90
9.4.5 Indonesia 92
9.4.6 South Korea 93
9.4.7 Rest of Asia-Pacific 95
9.5 Latin America 97
9.5.1 Mexico 99
9.5.2 Brazil 101
9.5.3 Argentina 102
9.5.4 Rest of Latin America 104
9.6 Middle East and Africa 106
9.6.1 Saudi Arabia 108
9.6.2 Israel 110
9.6.3 UAE 112
9.6.4 Turkey 113
9.6.5 Egypt 115
9.6.6 Rest of Middle East and Africa 117
10 Competitive Landscape
10.1 Introduction 119
10.2 Market Evolution 119
10.3 Global Market Strategy Analysis 119
10.4 Global Market Share Analysis 119
11 Company Profiles
11.1 KUREHA CORPORATION 121
11.1.1 Company Overview 121
11.1.2 Financial Overview 121
11.1.3 Products Offered 122
11.1.4 Key Developments 122
11.1.5 SWOT Analysis 122
11.1.6 Key Strategies 122
11.2 BMG Incorporated 123
11.2.1 Company Overview 123
11.2.2 Financial Overview 123
11.2.3 Products Offered 123
11.2.4 Key Developments 123
11.2.5 SWOT Analysis 124
11.2.6 Key Strategies 124
11.3 Teleflex, Inc 125
11.3.1 Company Overview 125
11.3.2 Financial Overview 125
11.3.3 Products Offered 126
11.3.4 Key Developments 126
11.3.5 SWOT Analysis 126
11.3.6 Key Strategies 126
11.4 Huizhou Foryou Medical Devices Co., Ltd 127
11.4.1 Company Overview 127
11.4.2 Financial Overview 127
11.4.3 Products Offered 127
11.4.4 Key Developments 127
11.4.5 SWOT Analysis 128
11.4.6 Key Strategies 128
11.5 Shenzhen Polymtek Biomaterial Co., Ltd 129
11.5.1 Company Overview 129
11.5.2 Financial Overview 129
11.5.3 Products Offered 129
11.5.4 Key Developments 129
11.5.5 SWOT Analysis 130
11.5.6 Key Strategy 130
11.6 Corbion N.V. 131
11.6.1 Company Overview 131
11.6.2 Financial Overview 131
11.6.3 Products Offered 132
11.6.4 Key Developments 132
11.6.5 SWOT Analysis 132
11.6.6 Key Strategies 132
12 Conclusion
12.1 Key Findings 133
13 List of Tables
TABLE 1 LIST OF ASSUMPTIONS 28
TABLE 2 GLOBAL POLYGLYCOLIC ACID MARKET PRICING (HISTORICAL) (USD/KG) (2010-2018) 39
TABLE 3 GLOBAL POLYGLYCOLIC ACID MARKET PRICING (FORECASTED) (USD/KG) (2019-2030) 39
TABLE 4 GLOBAL POLYGLYCOLIC ACID (PGA) MARKET, BY FORM, 2017β2030 (USD THOUSAND) 40
TABLE 5 GLOBAL POLYGLYCOLIC ACID (PGA) MARKET, BY FORM, 2017β2030 (TONS) 41
TABLE 6 FIBER: GLOBAL POLYGLYCOLIC ACID (PGA) MARKET, BY REGION, 2017β2030 (USD THOUSAND) 42
TABLE 7 FIBER: GLOBAL POLYGLYCOLIC ACID (PGA) MARKET, BY REGION, 2017β2030 (TONS) 42
TABLE 8 FILM: GLOBAL POLYGLYCOLIC ACID (PGA) MARKET, BY REGION, 2017β2030 (USD THOUSAND) 43
TABLE 9 FILM: GLOBAL POLYGLYCOLIC ACID (PGA) MARKET, BY REGION, 2017β2030 (TONS) 43
TABLE 10 OTHERS: GLOBAL POLYGLYCOLIC ACID (PGA) MARKET, BY REGION, 2017β2030 (USD THOUSAND) 44
TABLE 11 OTHERS: GLOBAL POLYGLYCOLIC ACID (PGA) MARKET, BY REGION, 2017β2030 (TONS) 45
TABLE 12 GLOBAL POLYGLYCOLIC ACID (PGA) MARKET, BY APPLICATION, 2017β2030 (USD THOUSAND) 47
TABLE 13 GLOBAL POLYGLYCOLIC ACID (PGA) MARKET, BY APPLICATION, 2017β2030 (TONS) 48
TABLE 14 OIL & GAS EXTRACTION: GLOBAL POLYGLYCOLIC ACID (PGA) MARKET, BY REGION, 2017β2030 (USD THOUSAND) 48
TABLE 15 OIL & GAS EXTRACTION: GLOBAL POLYGLYCOLIC ACID (PGA) MARKET, BY REGION, 2017β2030 (TONS) 49
TABLE 16 MEDICAL: GLOBAL POLYGLYCOLIC ACID (PGA) MARKET, BY REGION, 2017β2030 (USD THOUSAND) 50
TABLE 17 MEDICAL: GLOBAL POLYGLYCOLIC ACID (PGA) MARKET, BY REGION, 2017β2030 (TONS) 50
TABLE 18 PACKAGING: GLOBAL POLYGLYCOLIC ACID (PGA) MARKET, BY REGION, 2017β2030 (USD THOUSAND) 51
TABLE 19 PACKAGING: GLOBAL POLYGLYCOLIC ACID (PGA) MARKET, BY REGION, 2017β2030 (TONS) 51
TABLE 20 OTHERS: GLOBAL POLYGLYCOLIC ACID (PGA) MARKET, BY REGION, 2017β2030 (USD THOUSAND) 52
TABLE 21 OTHERS: GLOBAL POLYGLYCOLIC ACID (PGA) MARKET, BY REGION, 2017β2030 (TONS) 52
TABLE 22 GLOBAL POLYGLYCOLIC ACID (PGA) MARKET, BY REGION, 2017β2030 (USD THOUSAND) 54
TABLE 23 GLOBAL POLYGLYCOLIC ACID (PGA) MARKET, BY REGION, 2017β2030 (TONS) 55
TABLE 24 GLOBAL POLYGLYCOLIC ACID (PGA) MARKET, BY FORM, 2017β2030 (USD THOUSAND) 56
TABLE 25 GLOBAL POLYGLYCOLIC ACID (PGA) MARKET, BY FORM, 2017β2030 (TONS) 56
TABLE 26 GLOBAL POLYGLYCOLIC ACID (PGA) MARKET, BY APPLICATION, 2017β2030 (USD THOUSAND) 56
TABLE 27 GLOBAL POLYGLYCOLIC ACID (PGA) MARKET, BY APPLICATION, 2017β2030 (TONS) 58
TABLE 28 NORTH AMERICA: POLYGLYCOLIC ACID (PGA) MARKET, BY COUNTRY, 2017β2030 (USD THOUSAND) 58
TABLE 29 NORTH AMERICA: POLYGLYCOLIC ACID (PGA) MARKET, BY COUNTRY, 2017β2030 (TONS) 58
TABLE 30 NORTH AMERICA: POLYGLYCOLIC ACID (PGA) MARKET, BY FORM, 2017β2030 (USD THOUSAND) 59
TABLE 31 NORTH AMERICA: POLYGLYCOLIC ACID (PGA) MARKET, BY FORM, 2017β2030 (TONS) 59
TABLE 32 NORTH AMERICA: POLYGLYCOLIC ACID (PGA) MARKET, BY APPLICATION, 2017β2030 (USD THOUSAND) 59
TABLE 33 NORTH AMERICA: POLYGLYCOLIC ACID (PGA) MARKET, BY APPLICATION, 2017β2030 (TONS) 60
TABLE 34 US: POLYGLYCOLIC ACID (PGA) MARKET, BY FORM, 2017β2030 (USD THOUSAND) 60
TABLE 35 US: POLYGLYCOLIC ACID (PGA) MARKET, BY FORM, 2017β2030 (TONS) 62
TABLE 36 US: POLYGLYCOLIC ACID (PGA) MARKET, BY APPLICATION, 2017β2030 (USD THOUSAND) 62
TABLE 37 US: POLYGLYCOLIC ACID (PGA) MARKET, BY APPLICATION, 2017β2030 (TONS) 62
TABLE 38 CANADA: POLYGLYCOLIC ACID (PGA) MARKET, BY FORM, 2017β2030 (USD THOUSAND) 63
TABLE 39 CANADA: POLYGLYCOLIC ACID (PGA) MARKET, BY FORM, 2017β2030 (TONS) 63
TABLE 40 CANADA: POLYGLYCOLIC ACID (PGA) MARKET, BY APPLICATION, 2017β2030 (USD THOUSAND) 64
TABLE 41 CANADA: POLYGLYCOLIC ACID (PGA) MARKET, BY APPLICATION, 2017β2030 (TONS) 64
TABLE 42 EUROPE: POLYGLYCOLIC ACID (PGA) MARKET, BY COUNTRY, 2017β2030 (USD THOUSAND) 65
TABLE 43 EUROPE: POLYGLYCOLIC ACID (PGA) MARKET, BY COUNTRY, 2017β2030 (TONS) 65
TABLE 44 EUROPE: POLYGLYCOLIC ACID (PGA) MARKET, BY FORM, 2017β2030 (USD THOUSAND) 66
TABLE 45 EUROPE: POLYGLYCOLIC ACID (PGA) MARKET, BY FORM, 2017β2030 (TONS) 66
TABLE 46 EUROPE: POLYGLYCOLIC ACID (PGA) MARKET, BY APPLICATION, 2017β2030 (USD THOUSAND) 67
TABLE 47 EUROPE: POLYGLYCOLIC ACID (PGA) MARKET, BY APPLICATION, 2017β2030 (TONS) 67
TABLE 48 GERMANY: POLYGLYCOLIC ACID (PGA) MARKET, BY FORM, 2017β2030 (USD THOUSAND) 68
TABLE 49 GERMANY: POLYGLYCOLIC ACID (PGA) MARKET, BY FORM, 2017β2030 (TONS) 68
TABLE 50 GERMANY: POLYGLYCOLIC ACID (PGA) MARKET, BY APPLICATION, 2017β2030 (USD THOUSAND) 69
TABLE 51 GERMANY: POLYGLYCOLIC ACID (PGA) MARKET, BY APPLICATION, 2017β2030 (TONS) 69
TABLE 52 UK: POLYGLYCOLIC ACID (PGA) MARKET, BY FORM, 2017β2030 (USD THOUSAND) 70
TABLE 53 UK: POLYGLYCOLIC ACID (PGA) MARKET, BY FORM, 2017β2030 (TONS) 70
TABLE 54 UK: POLYGLYCOLIC ACID (PGA) MARKET, BY APPLICATION, 2017β2030 (USD THOUSAND) 70
TABLE 55 UK: POLYGLYCOLIC ACID (PGA) MARKET, BY APPLICATION, 2017β2030 (TONS) 71
TABLE 56 RUSSIA: POLYGLYCOLIC ACID (PGA) MARKET, BY FORM, 2017β2030 (USD THOUSAND) 71
TABLE 57 RUSSIA: POLYGLYCOLIC ACID (PGA) MARKET, BY FORM, 2017β2030 (TONS) 72
TABLE 58 RUSSIA: POLYGLYCOLIC ACID (PGA) MARKET, BY APPLICATION, 2017β2030 (USD THOUSAND) 72
TABLE 59 RUSSIA: POLYGLYCOLIC ACID (PGA) MARKET, BY APPLICATION, 2017β2030 (TONS) 72
TABLE 60 FRANCE: POLYGLYCOLIC ACID (PGA) MARKET, BY FORM, 2017β2030 (USD THOUSAND) 73
TABLE 61 FRANCE: POLYGLYCOLIC ACID (PGA) MARKET, BY FORM, 2017β2030 (TONS) 73
TABLE 62 FRANCE: POLYGLYCOLIC ACID (PGA) MARKET, BY APPLICATION, 2017β2030 (USD THOUSAND) 74
TABLE 63 FRANCE: POLYGLYCOLIC ACID (PGA) MARKET, BY APPLICATION, 2017β2030 (TONS) 74
TABLE 64 SPAIN: POLYGLYCOLIC ACID (PGA) MARKET, BY FORM, 2017β2030 (USD THOUSAND) 75
TABLE 65 SPAIN: POLYGLYCOLIC ACID (PGA) MARKET, BY FORM, 2017β2030 (TONS) 75
TABLE 66 SPAIN: POLYGLYCOLIC ACID (PGA) MARKET, BY APPLICATION, 2017β2030 (USD THOUSAND) 75
TABLE 67 SPAIN: POLYGLYCOLIC ACID (PGA) MARKET, BY APPLICATION, 2017β2030 (TONS) 76
TABLE 68 ITALY: POLYGLYCOLIC ACID (PGA) MARKET, BY FORM, 2017β2030 (USD THOUSAND) 76
TABLE 69 ITALY: POLYGLYCOLIC ACID (PGA) MARKET, BY FORM, 2017β2030 (TONS) 77
TABLE 70 ITALY: POLYGLYCOLIC ACID (PGA) MARKET, BY APPLICATION, 2017β2030 (USD THOUSAND) 77
TABLE 71 ITALY: POLYGLYCOLIC ACID (PGA) MARKET, BY APPLICATION, 2017β2030 (TONS) 77
TABLE 72 POLAND: POLYGLYCOLIC ACID (PGA) MARKET, BY FORM, 2017β2030 (USD THOUSAND) 78
TABLE 73 POLAND: POLYGLYCOLIC ACID (PGA) MARKET, BY FORM, 2017β2030 (TONS) 78
TABLE 74 POLAND: POLYGLYCOLIC ACID (PGA) MARKET, BY APPLICATION, 2017β2030 (USD THOUSAND) 79
TABLE 75 POLAND: POLYGLYCOLIC ACID (PGA) MARKET, BY APPLICATION, 2017β2030 (TONS) 79
TABLE 76 REST OF EUROPE: POLYGLYCOLIC ACID (PGA) MARKET, BY FORM, 2017β2030 (USD THOUSAND) 80
TABLE 77 REST OF EUROPE: POLYGLYCOLIC ACID (PGA) MARKET, BY FORM, 2017β2030 (TONS) 80
TABLE 78 REST OF EUROPE: POLYGLYCOLIC ACID (PGA) MARKET, BY APPLICATION, 2017β2030 (USD THOUSAND) 80
TABLE 79 REST OF EUROPE: POLYGLYCOLIC ACID (PGA) MARKET, BY APPLICATION, 2017β2030 (TONS) 81
TABLE 80 ASIA-PACIFIC: POLYGLYCOLIC ACID (PGA) MARKET, BY COUNTRY, 2017β2030 (USD THOUSAND) 81
TABLE 81 ASIA-PACIFIC: POLYGLYCOLIC ACID (PGA) MARKET, BY COUNTRY, 2017β2030 (TONS) 83
TABLE 82 ASIA-PACIFIC: POLYGLYCOLIC ACID (PGA) MARKET, BY FORM, 2017β2030 (USD THOUSAND) 83
TABLE 83 ASIA-PACIFIC: POLYGLYCOLIC ACID (PGA) MARKET, BY FORM, 2017β2030 (TONS) 84
TABLE 84 ASIA-PACIFIC: POLYGLYCOLIC ACID (PGA) MARKET, BY APPLICATION, 2017β2030 (USD THOUSAND) 84
TABLE 85 ASIA-PACIFIC: POLYGLYCOLIC ACID (PGA) MARKET, BY APPLICATION, 2017β2030 (TONS) 84
TABLE 86 CHINA: POLYGLYCOLIC ACID (PGA) MARKET, BY FORM, 2017β2030 (USD THOUSAND) 85
TABLE 87 CHINA: POLYGLYCOLIC ACID (PGA) MARKET, BY FORM, 2017β2030 (TONS) 85
TABLE 88 CHINA: POLYGLYCOLIC ACID (PGA) MARKET, BY APPLICATION, 2017β2030 (USD THOUSAND) 86
TABLE 89 CHINA: POLYGLYCOLIC ACID (PGA) MARKET, BY APPLICATION, 2017β2030 (TONS) 86
TABLE 90 JAPAN: POLYGLYCOLIC ACID (PGA) MARKET, BY FORM, 2017β2030 (USD THOUSAND) 87
TABLE 91 JAPAN: POLYGLYCOLIC ACID (PGA) MARKET, BY FORM, 2017β2030 (TONS) 87
TABLE 92 JAPAN: POLYGLYCOLIC ACID (PGA) MARKET, BY APPLICATION, 2017β2030 (USD THOUSAND) 87
TABLE 93 JAPAN: POLYGLYCOLIC ACID (PGA) MARKET, BY APPLICATION, 2017β2030 (TONS) 88
TABLE 94 INDIA: POLYGLYCOLIC ACID (PGA) MARKET, BY FORM, 2017β2030 (USD THOUSAND) 88
TABLE 95 INDIA: POLYGLYCOLIC ACID (PGA) MARKET, BY FORM, 2017β2030 (TONS) 89
TABLE 96 INDIA: POLYGLYCOLIC ACID (PGA) MARKET, BY APPLICATION, 2017β2030 (USD THOUSAND) 89
TABLE 97 INDIA: POLYGLYCOLIC ACID (PGA) MARKET, BY APPLICATION, 2017β2030 (TONS) 89
TABLE 98 AUSTRALIA AND NEW ZEALAND: POLYGLYCOLIC ACID (PGA) MARKET, BY FORM, 2017β2030 (USD THOUSAND) 90
TABLE 99 AUSTRALIA AND NEW ZEALAND: POLYGLYCOLIC ACID (PGA) MARKET, BY FORM, 2017β2030 (TONS) 90
TABLE 100 AUSTRALIA AND NEW ZEALAND: POLYGLYCOLIC ACID (PGA) MARKET, BY APPLICATION, 2017β2030 (USD THOUSAND) 91
TABLE 101 AUSTRALIA AND NEW ZEALAND: POLYGLYCOLIC ACID (PGA) MARKET, BY APPLICATION, 2017β2030 (TONS) 91
TABLE 102 INDONESIA: POLYGLYCOLIC ACID (PGA) MARKET, BY FORM, 2017β2030 (USD THOUSAND) 92
TABLE 103 INDONESIA: POLYGLYCOLIC ACID (PGA) MARKET, BY FORM, 2017β2030 (TONS) 92
TABLE 104 INDONESIA: POLYGLYCOLIC ACID (PGA) MARKET, BY APPLICATION, 2017β2030 (USD THOUSAND) 92
TABLE 105 INDONESIA: POLYGLYCOLIC ACID (PGA) MARKET, BY APPLICATION, 2017β2030 (TONS) 93
TABLE 106 SOUTH KOREA: POLYGLYCOLIC ACID (PGA) MARKET, BY FORM, 2017β2030 (USD THOUSAND) 93
TABLE 107 SOUTH KOREA: POLYGLYCOLIC ACID (PGA) MARKET, BY FORM, 2017β2030 (TONS) 94
TABLE 108 SOUTH KOREA: POLYGLYCOLIC ACID (PGA) MARKET, BY APPLICATION, 2017β2030 (USD THOUSAND) 94
TABLE 109 SOUTH KOREA: POLYGLYCOLIC ACID (PGA) MARKET, BY APPLICATION, 2017β2030 (TONS) 94
TABLE 110 REST OF ASIA-PACIFIC: POLYGLYCOLIC ACID (PGA) MARKET, BY FORM, 2017β2030 (USD THOUSAND) 95
TABLE 111 REST OF ASIA-PACIFIC: POLYGLYCOLIC ACID (PGA) MARKET, BY FORM, 2017β2030 (TONS) 95
TABLE 112 REST OF ASIA-PACIFIC: POLYGLYCOLIC ACID (PGA) MARKET, BY APPLICATION, 2017β2030 (USD THOUSAND) 96
TABLE 113 REST OF ASIA-PACIFIC: POLYGLYCOLIC ACID (PGA) MARKET, BY APPLICATION, 2017β2030 (TONS) 96
TABLE 114 LATIN AMERICA: POLYGLYCOLIC ACID (PGA) MARKET, BY COUNTRY, 2017β2030 (USD THOUSAND) 97
TABLE 115 LATIN AMERICA: POLYGLYCOLIC ACID (PGA) MARKET, BY COUNTRY, 2017β2030 (TONS) 97
TABLE 116 LATIN AMERICA: POLYGLYCOLIC ACID (PGA) MARKET, BY FORM, 2017β2030 (USD THOUSAND) 97
TABLE 117 LATIN AMERICA: POLYGLYCOLIC ACID (PGA) MARKET, BY FORM, 2017β2030 (TONS) 98
TABLE 118 LATIN AMERICA: POLYGLYCOLIC ACID (PGA) MARKET, BY APPLICATION, 2017β2030 (USD THOUSAND) 98
TABLE 119 LATIN AMERICA: POLYGLYCOLIC ACID (PGA) MARKET, BY APPLICATION, 2017β2030 (TONS) 99
TABLE 120 MEXICO: POLYGLYCOLIC ACID (PGA) MARKET, BY FORM, 2017β2030 (USD THOUSAND) 99
TABLE 121 MEXICO: POLYGLYCOLIC ACID (PGA) MARKET, BY FORM, 2017β2030 (TONS) 99
TABLE 122 MEXICO: POLYGLYCOLIC ACID (PGA) MARKET, BY APPLICATION, 2017β2030 (USD THOUSAND) 100
TABLE 123 MEXICO: POLYGLYCOLIC ACID (PGA) MARKET, BY APPLICATION, 2017β2030 (TONS) 100
TABLE 124 BRAZIL: POLYGLYCOLIC ACID (PGA) MARKET, BY FORM, 2017β2030 (USD THOUSAND) 101
TABLE 125 BRAZIL: POLYGLYCOLIC ACID (PGA) MARKET, BY FORM, 2017β2030 (TONS) 101
TABLE 126 BRAZIL: POLYGLYCOLIC ACID (PGA) MARKET, BY APPLICATION, 2017β2030 (USD THOUSAND) 101
TABLE 127 BRAZIL: POLYGLYCOLIC ACID (PGA) MARKET, BY APPLICATION, 2017β2030 (TONS) 102
TABLE 128 ARGENTINA: POLYGLYCOLIC ACID (PGA) MARKET, BY FORM, 2017β2030 (USD THOUSAND) 102
TABLE 129 ARGENTINA: POLYGLYCOLIC ACID (PGA) MARKET, BY FORM, 2017β2030 (TONS) 103
TABLE 130 ARGENTINA: POLYGLYCOLIC ACID (PGA) MARKET, BY APPLICATION, 2017β2030 (USD THOUSAND) 103
TABLE 131 ARGENTINA: POLYGLYCOLIC ACID (PGA) MARKET, BY APPLICATION, 2017β2030 (TONS) 103
TABLE 132 REST OF LATIN AMERICA: POLYGLYCOLIC ACID (PGA) MARKET, BY FORM, 2017β2030 (USD THOUSAND) 104
TABLE 133 REST OF LATIN AMERICA: POLYGLYCOLIC ACID (PGA) MARKET, BY FORM, 2017β2030 (TONS) 104
TABLE 134 REST OF LATIN AMERICA: POLYGLYCOLIC ACID (PGA) MARKET, BY APPLICATION, 2017β2030 (USD THOUSAND) 105
TABLE 135 REST OF LATIN AMERICA: POLYGLYCOLIC ACID (PGA) MARKET, BY APPLICATION, 2017β2030 (TONS) 105
TABLE 136 MIDDLE EAST AND AFRICA: POLYGLYCOLIC ACID (PGA) MARKET, BY COUNTRY, 2017β2030 (USD THOUSAND) 106
TABLE 137 MIDDLE EAST AND AFRICA: POLYGLYCOLIC ACID (PGA) MARKET, BY COUNTRY, 2017β2030 (TONS) 106
TABLE 138 MIDDLE EAST AND AFRICA: POLYGLYCOLIC ACID (PGA) MARKET, BY FORM, 2017β2030 (USD THOUSAND) 107
TABLE 139 MIDDLE EAST AND AFRICA: POLYGLYCOLIC ACID (PGA) MARKET, BY FORM, 2017β2030 (TONS) 107
TABLE 140 MIDDLE EAST AND AFRICA: POLYGLYCOLIC ACID (PGA) MARKET, BY APPLICATION, 2017β2030 (USD THOUSAND) 107
TABLE 141 MIDDLE EAST AND AFRICA: POLYGLYCOLIC ACID (PGA) MARKET, BY APPLICATION, 2017β2030 (TONS) 108
TABLE 142 SAUDI ARABIA: POLYGLYCOLIC ACID (PGA) MARKET, BY FORM, 2017β2030 (USD THOUSAND) 108
TABLE 143 SAUDI ARABIA: POLYGLYCOLIC ACID (PGA) MARKET, BY FORM, 2017β2030 (TONS) 109
TABLE 144 SAUDI ARABIA: POLYGLYCOLIC ACID (PGA) MARKET, BY APPLICATION, 2017β2030 (USD THOUSAND) 109
TABLE 145 SAUDI ARABIA: POLYGLYCOLIC ACID (PGA) MARKET, BY APPLICATION, 2017β2030 (TONS) 109
TABLE 146 ISRAEL: POLYGLYCOLIC ACID (PGA) MARKET, BY FORM, 2017β2030 (USD THOUSAND) 110
TABLE 147 ISRAEL: POLYGLYCOLIC ACID (PGA) MARKET, BY FORM, 2017β2030 (TONS) 110
TABLE 148 ISRAEL: POLYGLYCOLIC ACID (PGA) MARKET, BY APPLICATION, 2017β2030 (USD THOUSAND) 111
TABLE 149 ISRAEL: POLYGLYCOLIC ACID (PGA) MARKET, BY APPLICATION, 2017β2030 (TONS) 111
TABLE 150 UAE: POLYGLYCOLIC ACID (PGA) MARKET, BY FORM, 2017β2030 (USD THOUSAND) 112
TABLE 151 UAE: POLYGLYCOLIC ACID (PGA) MARKET, BY FORM, 2017β2030 (TONS) 112
TABLE 152 UAE: POLYGLYCOLIC ACID (PGA) MARKET, BY APPLICATION, 2017β2030 (USD THOUSAND) 112
TABLE 153 UAE: POLYGLYCOLIC ACID (PGA) MARKET, BY APPLICATION, 2017β2030 (TONS) 113
TABLE 154 TURKEY: POLYGLYCOLIC ACID (PGA) MARKET, BY FORM, 2017β2030 (USD THOUSAND) 113
TABLE 155 TURKEY: POLYGLYCOLIC ACID (PGA) MARKET, BY FORM, 2017β2030 (TONS) 114
TABLE 156 TURKEY: POLYGLYCOLIC ACID (PGA) MARKET, BY APPLICATION, 2017β2030 (USD THOUSAND) 114
TABLE 157 TURKEY: POLYGLYCOLIC ACID (PGA) MARKET, BY APPLICATION, 2017β2030 (TONS) 114
TABLE 158 EGYPT: POLYGLYCOLIC ACID (PGA) MARKET, BY FORM, 2017β2030 (USD THOUSAND) 115
TABLE 159 EGYPT: POLYGLYCOLIC ACID (PGA) MARKET, BY FORM, 2017β2030 (TONS) 115
TABLE 160 EGYPT: POLYGLYCOLIC ACID (PGA) MARKET, BY APPLICATION, 2017β2030 (USD THOUSAND) 116
TABLE 161 EGYPT: POLYGLYCOLIC ACID (PGA) MARKET, BY APPLICATION, 2017β2030 (TONS) 116
TABLE 162 REST OF MIDDLE EAST AND AFRICA: POLYGLYCOLIC ACID (PGA) MARKET, BY FORM, 2017β2030 (USD THOUSAND) 117
TABLE 163 REST OF MIDDLE EAST AND AFRICA: POLYGLYCOLIC ACID (PGA) MARKET, BY FORM, 2017β2030 (TONS) 117
TABLE 164 REST OF MIDDLE EAST AND AFRICA: POLYGLYCOLIC ACID (PGA) MARKET, BY APPLICATION, 2017β2030 (USD THOUSAND) 117
TABLE 165 REST OF MIDDLE EAST AND AFRICA: POLYGLYCOLIC ACID (PGA) MARKET, BY APPLICATION, 2017β2030 (TONS) 118
14 List of Figures
FIGURE 1 MARKET SYNOPSIS 16
FIGURE 2 MARKET ATTRACTIVENESS ANALYSIS: GLOBAL POLYGLYCOLIC ACID (PGA) MARKET 17
FIGURE 3 GLOBAL POLYGLYCOLIC ACID (PGA) MARKET ANALYSIS BY FORM 18
FIGURE 4 GLOBAL POLYGLYCOLIC ACID (PGA) MARKET ANALYSIS BY APPLICATION 19
FIGURE 5 GLOBAL POLYGLYCOLIC ACID (PGA) MARKET: MARKET STRUCTURE 20
FIGURE 6 NORTH AMERICA MARKET SIZE & MARKET SHARE BY COUNTRY (2018 VS 2030) 21
FIGURE 7 EUROPE MARKET SIZE & MARKET SHARE BY COUNTRY (2018 VS 2030) 22
FIGURE 8 ASIA-PACIFIC & MARKET SHARE BY COUNTRY (2018 VS 2030) 22
FIGURE 9 LATIN AMERICA MARKET SIZE & MARKET SHARE BY COUNTRY (2018 VS 2030) 23
FIGURE 10 MIDDLE EAST & AFRICA MARKET SIZE & MARKET SHARE BY COUNTRY (2018 VS 2030) 23
FIGURE 11 RESEARCH PROCESS OF MRFR 24
FIGURE 12 TOP-DOWN & BOTTOM-UP APPROACH 27
FIGURE 13 MARKET DYNAMICS OVERVIEW 29
FIGURE 14 US SHALE GAS PRODUCTION, 2011 β 2018 30
FIGURE 15 HEALTHCARE SPENDING (% OF GDP), 2017 31
FIGURE 16 DRIVERS IMPACT ANALYSIS 31
FIGURE 17 RESTRAINTS IMPACT ANALYSIS 32
FIGURE 18 SUPPLY CHAIN: POLYGLYCOLIC ACID MARKET 36
FIGURE 19 PORTER'S FIVE FORCES ANALYSIS OF THE GLOBAL ANTIMICROBIAL ADDITIVES MARKET 37
FIGURE 20 GLOBAL POLYGLYCOLIC ACID (PGA) MARKET, BY FORM, 2017β2030 (USD THOUSAND) 40
FIGURE 21 GLOBAL POLYGLYCOLIC ACID (PGA) MARKET, BY FORM, 2017β2030 (TONS) 41
FIGURE 22 GLOBAL POLYGLYCOLIC ACID (PGA) MARKET, BY APPLICATION, 2017β2030 (USD THOUSAND) 46
FIGURE 23 GLOBAL POLYGLYCOLIC ACID (PGA) MARKET, BY APPLICATION, 2017β2030 (TONS) 47
FIGURE 24 GLOBAL POLYGLYCOLIC ACID (PGA) MARKET, BY REGION, 2017β2030 (USD THOUSAND) 54
FIGURE 25 GLOBAL POLYGLYCOLIC ACID (PGA) MARKET, BY REGION, 2017β2030 (TONS) 55
FIGURE 26 MARKET SHARE (%) 120
$9.30 billion
10.01%
North America
2021-2030
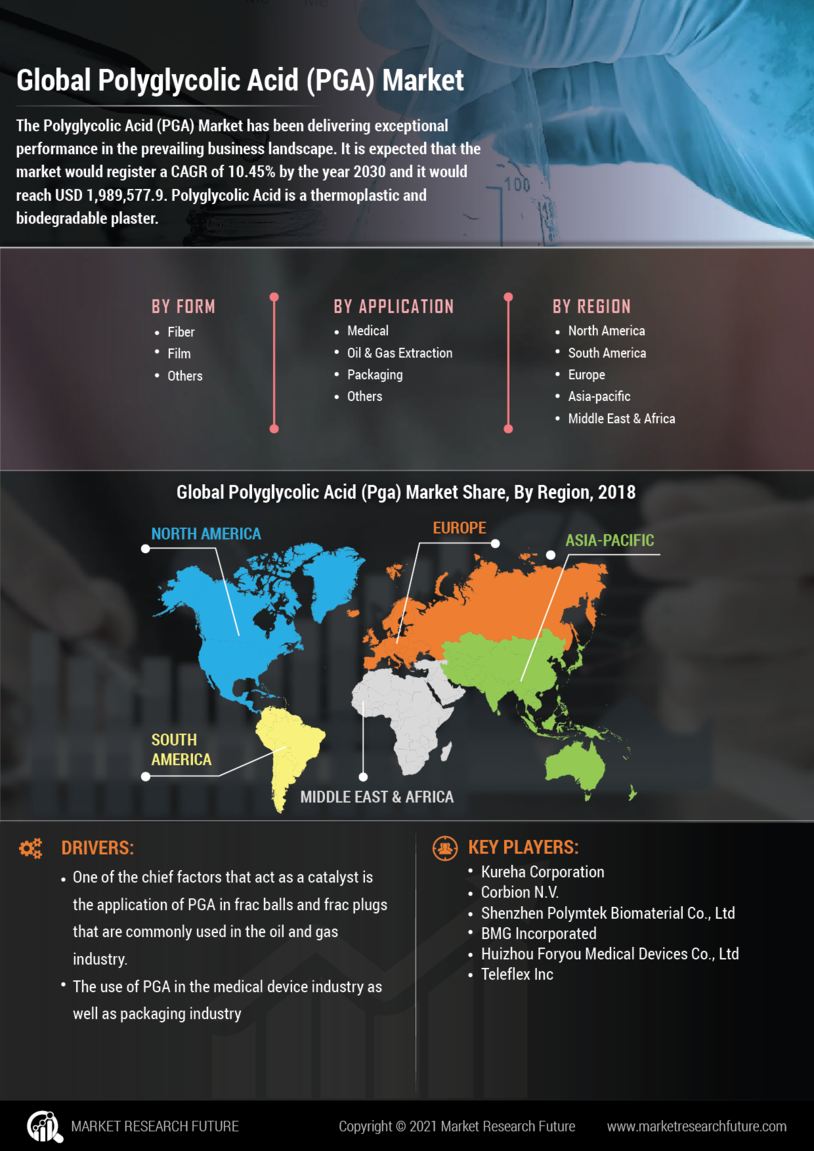
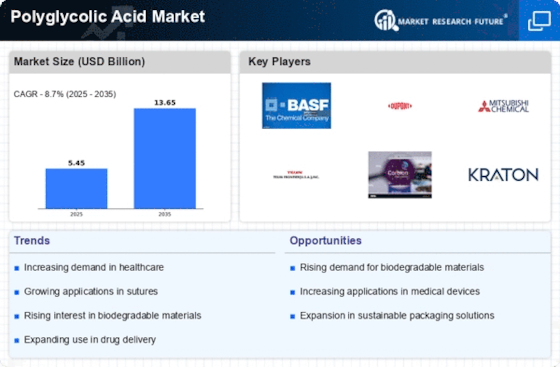
The Polyglycolic Acid (PGA) market has been delivering exceptional performance in the prevailing business landscape. It is expected that the market would register a CAGR of 10.45% by the year 2030 and it would reach USD 1,989,577.9.
Polyglycolic Acid is a thermoplastic and biodegradable plaster. PGA can be obtained by following two processes including glycolic acid’s polycondensation and glycolide’s ring opening polycondensation. It is commonly used as a surgical suture material because of its robust tensile strength, top-notch knotting capability, hydrolytic stability and tissue reactivity.
The demand of polyglycolic acid is rising due to the expanding application of frac balls and frac plugs in extraction processes involved in the oil and gas industry. PGA-based frac plugs are replacing metal plugs because they give rise to low operating costs. Its application is also increasing in the packaging industry and driving its upwards performance. The rapid urbanization and industrialization is likely to increase the need for energy which could further lead to the rise in polyglycolic acid market demand.
The market report captures the growth potential of the global PGA market till 2030. The thorough analysis of the market landscape including competitive intensity has been conducted by focusing on the impact of COVID-19 pandemic. The projections of the polyglycolic acid market demand are based on evaluation of core market dynamics including drivers, opportunities, threats and challenges.
The COVID-19 outbreak has adversely affected the PGA market, just like any other sector and industry. The production activities came to a halt and the demand also declined because of the pandemic. But the market has been quick to adapt to the evolving situation.
In order to overcome the issue, the government and respective authorities proposed creative strategies so that the polyglycolic acid market growth would not be restricted. The key business participants and governments have adopted innovative measures and tactical strategies to support the market. Due to such an approach, the polyglycolic acid market share has been delivering consistent and solid performance and new kinds of opportunities are emerging in the market.
The polyglycolic acid market is influenced by a number of factors that shape its performance. One of the chief factors that act as a catalyst is the application of PGA in frac balls and frac plugs that are commonly used in the oil and gas industry. It is expected that after the relaxation of the COVID-19 guidelines, the demand could further expand in the industry.
Similarly, the use of PGA in the medical device industry as well as packaging industry contributes to the solid polyglycolic acid market share. As polyglycolic acid is used in some of the most important industries, its demand is most likely to increase in the future.
The evaluation of polyglycolic acid market 2019 has revealed that it has been delivering consistent performance. In the prevailing times, there is further opportunity to exploit the rapid industrialization and urbanization of different nations which would increase the demand for energy resulting in the surge in PGA demand as well.
The increase in the number of market players has increased the competitive intensity. High competition could further contribute to the growth of the polyglycolic acid market size. It would also encourage the businesses to focus on innovation and creativity to boost the global market performance.
A major threat that has affected the polyglycolic acid market trends recently is the COVID-19 pandemic. The market was in a slump in 2020 because of diminished demand due to the pandemic. The pandemic has taken the form of a major challenge for the industry and the key players operating in it.
In order to overcome the challenge, the market players have been focusing on implementing new and improved measures. Such a strategic approach would strengthen the stability of the market and its demand.
The integrated polyglycolic acid market analysis has shed light on its growth potential during the forecasted period. The key business players are likely to play a pivotal role to introduced new strategic approaches that would help the industry to stabilize and deliver solid performance globally.
In order to tackle the existing challenges and make the most of the available market opportunities, the key businesses in the market are proposing better strategies. In the future, these strategies would pave the path for the prosperity of the market and the expansion of the polyglycolic acid market size.
Value chain analysis
The market has been generating consistent and solid revenue in the past. The COVID-19 pandemic acted as a key barrier that affected its successful streak. But due to the adoption of new strategies, the demands are gradually growing and stabilizing the market. The market has been showing promising performance currently.
The application of polyglycolic acid in diverse industries such as oil and gas industry, medical equipment industry, etc plays a key role to influence its solid global performance. The consumption of PGA is predicted to increase which would influence its demand and performance at the global level.
The global PGA market can be segmented into film, fiber and others on the basis of form. The firm segment is expected to play a key role and influence the overall demand. In 2018, the fiber market accounted for about 82.8 % of the market share.
During the forecasted period, the demand for fiber is likely to be highest. The key factor that would contribute to high demand is the use of fiber to produce products that are used n the oils and gas industry and medical equipment industry.
PGA is used in diverse industries including medical, oil and gas industry, packaging and others. The use of the product at the industrial level would contribute to solidify the market performance.
The use of PGA in the medical industry in the year 2018 was USD 3,05,590.3 which contributed to its solid performance. The key application areas would mold the industrial performance during the forecasted period significantly.
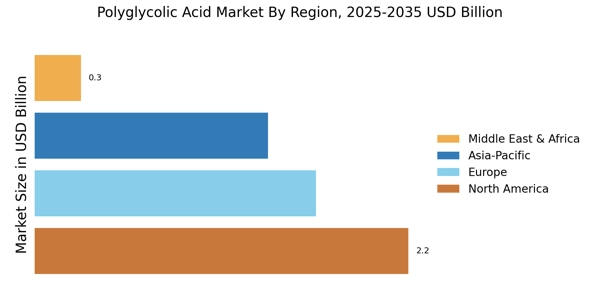
The polyglycolic acid market has presence in diverse regions such as North America, Latin America, Europe Asia-Pacific, Middle East and Africa, and others. Unique factors exist in the regions and influence the market performance.
North America has been dominating the global PGA market performance. It accounted for the largest share of about 60.7 % in 2018. The comprehensive polyglycolic acid market overview indicates that it is likely to play a vital role during the forecasted period.
Competitive intensity in the market
The key players that operate in the industry are:
The players have been playing a key role and contributing to the market growth. Some of the major players are Kureha Corporation, BMG Incorporated, etc. BMG Incorporated is a promising player that has been focusing on innovation to strengthen the production process.
Each and every polyglycolic acid market manufacturer and polyglycolic acid market supplier is working on strengthening the strategic approach in the evolving business landscape. They are playing a key role to stabilize the market in the pandemic times.
The market segmentation table is presented below:
Global Polyglycolic Acid Market, by Form
Global Polyglycolic Acid Market, by Application
Global Polyglycolic Acid Market, by Region
Report Attribute/Metric | Details |
---|---|
Market Size | 2030: USD 1.9 Billion |
CAGR | 10.45%(2020β2030) |
Base Year | 2021 |
Forecast Period | 2022-2030 |
Historical Data | 2019Β &Β 2020 |
Forecast Units | Value (USD Billion) |
Report Coverage | Revenue Forecast, Competitive Landscape, Growth Factors, and Trends |
Segments Covered | By Form, Application and Region |
Geographies Covered | North America, Europe, Asia-Pacific, and Rest of the World (RoW) |
Key Vendors | Kureha Corporation, Corbion N.V., Shenzhen Polymtek Biomaterial Co., Ltd, BMG Incorporated, Huizhou Foryou Medical Devices Co., Ltd, Teleflex Inc |
Key Market Opportunities | There is further opportunity to exploit the rapid industrialization and urbanization of different nations which would increase the demand for energy resulting in the surge in PGA demand as well. |
Key Market Drivers | One of the chief factors that act as a catalyst is |
Frequently Asked Questions (FAQ) :
The rising demand and consumption of frac balls and frac plugs in the oil and gas industry act as the chief driver of the global Polyglycolic Acid market.
North America dominates the market at the global level as a majority of transactions take place in the region.
The market is expected to reach USD 1.9 billion by the year 2030.