POC Blood Gas and Electrolyte Market Segmentation
POC Blood Gas and Electrolyte Market By Product (USD Billion, 2025-2035)
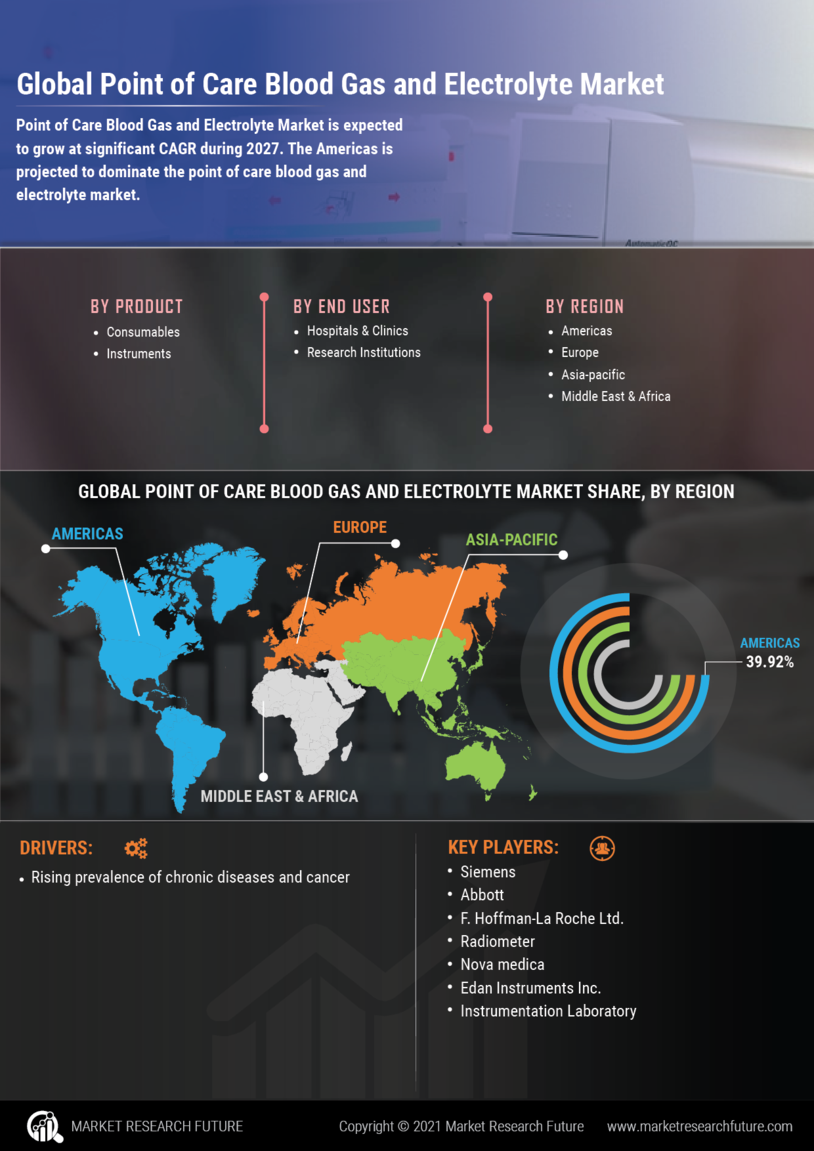
- Consumables
- Instruments
POC Blood Gas and Electrolyte Market By End User (USD Billion, 2025-2035)
- Hospitals & Clinics
- Research Institutions