Market overview
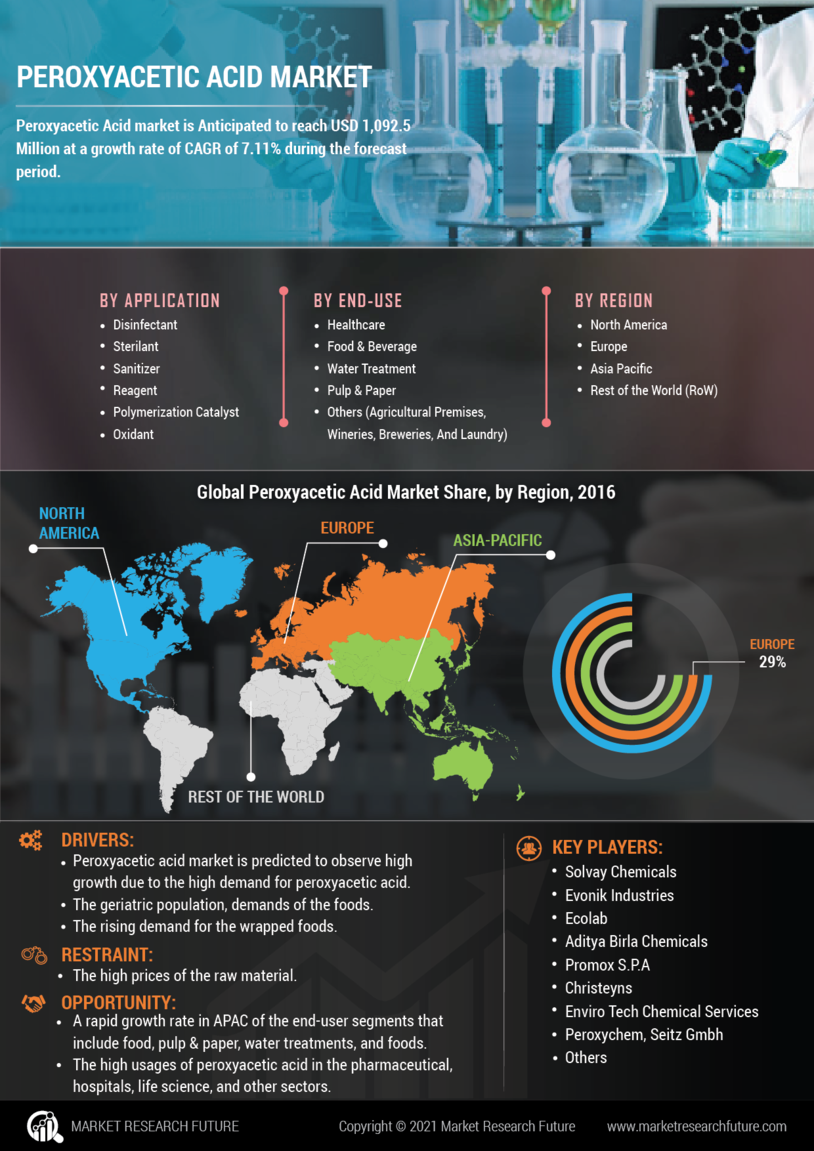
The global Peroxyacetic Acid market is predicted to reach $ 1,092.5 million at a growth rate of CAGR of 7.11% during the forecast period. Peroxyacetic is a chemical which is in solid purified structure, sublime or 1-50% solution which is an accommodation of water and hydrogen peroxide acidic acid. Peroxyacetic Acid has oxidizing agents with a purview of supplications that includes sterilization, disinfection, sanitization, and bleaching. These supplications are easily degradable into the environment without leaving any trace behind. These pliable properties of the chemical make it more suitable for households, end-users, and different families. The supplication of the chemical in the treatment of water, healthcare, and foods & beverages are predicted to expand the Peroxyacetic Acid Market growth.
Peroxyacetic acids are beneficial for cleaning purposes; the antimicrobial peroxyacetic acid is best for cleaning hard surfaces which includes washrooms, sustenance foundations, rural premises, and bathrooms. It is also used in beverage plants, wineries, on nourishment types of equipment, in diary plants, pasteurizers, as a disinfected in therapeutic supplies, for the development of the biofilm in the pulp industries, and in the water purifiers. Peroxyacetic acids are used for the protection of foods to increase the durability of the food.
This report contains all the information on the Peroxyacetic Acid Market growth analysis research and the strength of the Peroxyacetic acids in the market. The report also contains the culmination of dynamics, segmentation, key players, regional analysis, and other important factors. A detailed analysis of the Peroxyacetic acids globally and forecast to 2027 is also included in the report.
Covid 19 Analysis
According to the reports, the covid 19 pandemic has play havoc with the healthcare system throughout the world. The covid 19 outbreak has shown tremendous progress from regional crises to the global pandemic in a blink of an eye. On the one hand where the hospital is submerged with patients due to the outbreak of novel coronavirus and the spread of the disease has stimulated a rush in the stipulation for the disinfected products and cleaning, all this because of the awareness among the people about the cleanliness, safety, and health.
The major factors for the growth of the market include the rising awareness among the people about hygiene maintenance and the rise in the expenditure of healthcare products or peracetic acid products.
Market Dynamic
In the next five years, the global peroxyacetic acid market is predicted to observe high growth due to the high demand for peroxyacetic acid. The geriatric population, demands of the foods, and the high demand for purified water are likely to drive the growth of the market. The rising demand for the wrapped foods is also a major factor for the growth of the market.
Governments of different countries are working to provide appropriate funds for the development of peroxyacetic acid with the help of advanced technologies and machines.
A rapid growth rate in APAC of the end-user segments that include food, pulp & paper, water treatments, and foods are likely to boost the growth of the peroxyacetic acid market. The high usages of peroxyacetic acid in the pharmaceutical, hospitals, life science, and other sectors are the other major factors for the market growth.
The pharmaceutical companies are likely to entrench their plants in APAC, because of the rising demand for medicinal products. Thus, the pharmaceutical companies are exhibiting magnificent growth in the region.
The high prices of the raw material for the peroxyacetic acid are likely to restrain the market growth. Apart from that, the lack of knowledge regarding the peroxyacetic acid product and its usage can be considered as some other factors which can create hurdles in the growth of the peroxyacetic acid market growth.
With the different levels of concentration grades, peracetic acid is a very complex solution. 35% of the peracetic grade is unsteady and it contains combustible characteristics. It is a powerful oxidizing agent, and it is likely to be more sensitive as compare to other low concentration products. Peracetic acid can be very dangerous when comes in contact with other chemicals or any explosive materials.
The manufacturing companies are however contributing to the development of the stabilized peroxyacetic acid to decrease the risk of any above-mentioned things.
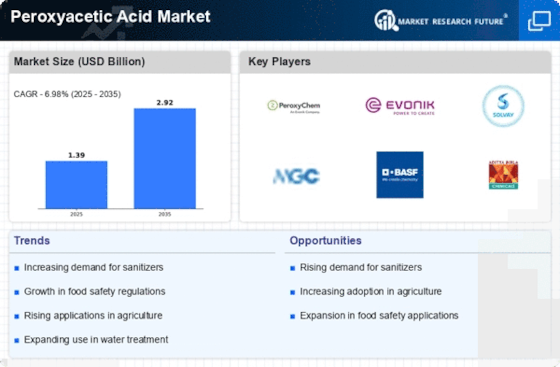
The global peroxyacetic acid market is growing speedily and it is also predicted to show strong future growth because of the increase in the demand from the end-user industries. The global peracetic acid market is expected to grow from USD 813 million in the year 2020 to USD 1,685 million by the end of 2030 at a growth rate of CAGR of 7.6%.
The rapid development of the specific products according to the application in different industries is likely to drive the growth of the market in the coming five years. The current scenario of the market due to the rising awareness among the people regarding hygiene due to the covid 19 pandemic are some vital factors for the growth of the peroxyacetic acid market.
Value Chain Analysis
The global peroxyacetic acid market is predicted to reach $1,092.5 million by the end of 2027. Peroxyacetic acid has accounted for the maximum market shares while registering a CAGR of 8.37% during the forecast period.
On the basis of type, the peroxyacetic acid is segmented into three types, including disinfectant, sterile, and sanitizer. Based on application, the market is segmented into healthcare, food, pulp & paper, water treatment, and others which includes agriculture and laundry. The food section holds 27% of the market shares on the basis of the application.
Segmentation Overview
New applications are predicted to launch by the key manufacturers and few sample trials are going on to test the new product. The current rise in the demand for peroxyacetic acid for the water plants for the water treatments is likely to drive the growth of the global
peroxyacetic acid market.
On the basis of the application, the peroxyacetic acid market is segmented into disinfectant, sterilant, sanitizer, and others which include a reagent, polymerization catalyst, and oxidant.
On the basis of the end-user, the peroxyacetic acid market is segmented into pulp & paper, healthcare, treatment of water, food, and others.
Regional Analysis
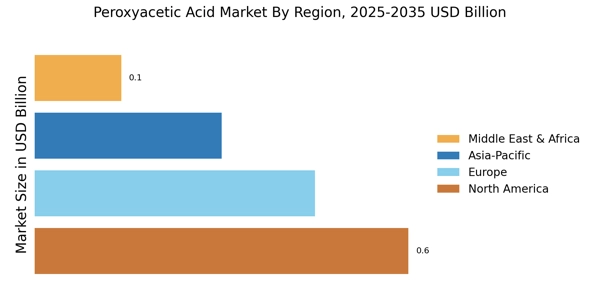
On the basis of the regions, the European counties held the largest shares of the peroxyacetic acid market, a share of 29% and it is predicted to reach $325.1 million by the end of 2027 from $135.5 million in the year 2015. On the other hand, the Asia pacific markers are predicted to grow at a CAGR of 8.02% from 2016 to 2027.
Based on the reports of the US International Trade Commission, developing countries like India and China are likely to consume the largest water capacity for agriculture and industry consumption, municipal and domestic consumption. The availability of easily obtainable raw material and cheap labor has raised the foreign investments in the APAC due to the rise of the demand.
Competitive landscape
The launches of the new advanced technologies, R&D activities, and acquisitions are the major key strategies embraced by the key players in the global peroxyacetic acid market. The key strategies include mergers, joint ventures, launches of the products and R&D, to boost the growth of the global peroxyacetic acid market size.
Major key players
Report Overview
The following report comprises of –
Recent Developments
Based on application
Frequently Asked Questions (FAQ) :
the global peroxyacetic acid market is predicted to reach $1,092.5 million by the end of 2027.
The peroxyacetic acid market achieve a CAGR of 7.11% during the forecast period of 2014 to 2027.
The industries where the peroxyacetic acid market would easily gain acceptance are food industries, healthcare industries, pulp & paper industries, agriculture industries, laundry industries, and water treatment industries.
1 Report Prologue
2 Introduction
2.1 Definition
2.2 Scope Of The Study
2.2.1 Research Objective
2.2.2 Assumptions
2.2.3 Limitations
2.3 Market Structure
3 Research Methodology
3.1 Research Process
3.2 Primary Research
3.3 Secondary Research
3.4 Market Size Estimation
3.5 Forecast Model
4 Market Dynamics
4.1 Introduction
4.2 Growth Drivers
4.2.1 Increasing Usage Of Peroxyacetic Acid Over Other Biocides
4.2.2 Increasing Population Will Accelerate Food Demand
4.3 Restraints
4.3.1 Price Fluctation Of Raw Material
4.4 Mega Trends
4.4.1 Increasing Demand For Packaged Food
4.5 Macroeconomic Indicators
5 Market Factor Analysis
5.1 Porter's 5 Forces Analysis
5.1.1 Threat Of New Entrants
5.1.2 Bargaining Power Of Suppliers
5.1.3 Bargaining Power Of Buyers
5.1.4 Threat Of Substitute
5.1.5 Segment Rivalry
5.2 Value Chain Analysis
6 Global Peroxyacetic Acid Market: Trade Data
6.1 Import By Region
6.2 Export By Region
7 Global Peroxyacetic Acid Market, By Type
7.1 Introduction
7.2 Market Size (Sub Segments)
7.2.1 Disinfectant
7.2.1.1 North America
7.2.1.2 Europe
7.2.1.3 Asia-Pacific
7.2.2 Sanitizer
7.2.2.1 North America
7.2.2.2 Europe
7.2.2.3 Asia-Pacific
7.2.3 Sterilant
7.2.3.1 North America
7.2.3.2 Europe
7.2.3.3 Asia-Pacific
8 Global Peroxyacetic Acid Market, By Application
8.1 Introduction
8.2 Market Size (Sub Segments)
8.2.1 Food
8.2.1.1 North America
8.2.1.2 Europe
8.2.1.3 Asia-Pacific
8.2.2 Healthcare
8.2.2.1 North America
8.2.2.2 Europe
8.2.2.3 Asia-Pacific
8.2.3 Water Treatment
8.2.3.1 North America
8.2.3.2 Europe
8.2.3.3 Asia-Pacific
8.2.4 Pulp & Paper
8.2.4.1 North America
8.2.4.2 Europe
8.2.4.3 Asia-Pacific
8.2.5 Others (Agriculture & Laundry)
8.2.5.1 North America
8.2.5.2 Europe
8.2.5.3 Asia-Pacific
9 Global Peroxyacetic Acid Market, By Region
9.1 Market Size By Region
9.1.1 North America
9.1.1.1 The United States
9.1.1.2 Canada
9.1.2 Europe
9.1.2.1 Germany
9.1.2.2 United Kingdom
9.1.2.3 France
9.1.2.4 Spain
9.1.2.5 Italy
9.1.2.6 Rest Of Europe
9.1.3 Asia-Pacific
9.1.3.1 China
9.1.3.2 Japan
9.1.4 Middle East
9.1.5 Africa
9.1.6 South America
10 Buyers And Suppliers’ Profile
10.1 Suppliers/Manufacturer/Distributors Of Peroxyacetic Acid By Region
10.2 Buyers Of Peroxyacetic Acid By Region
11 Company Profile
11.1 Solvay Chemicals
11.1.1 Company Overview
11.1.2 Product/Business Segment Overview
11.1.3 Financial Overview
11.1.4 Key Development
11.2 Evonik Industries
11.2.1 Company Overview
11.2.2 Product/Business Segment Overview
11.2.3 Financial Overview
11.2.4 Key Development
11.3 Ecolab
11.3.1 Company Overview
11.3.2 Product/Business Segment Overview
11.3.3 Financial Overview
11.3.4 Key Development
11.4 Aditya Birla Chemicals
11.4.1 Company Overview
11.4.2 Product/Business Segment Overview
11.4.3 Financial Overview
11.5 Promox S.P.A
11.5.1 Company Overview
11.5.2 Product/Business Segment Overview
11.5.3 Financial Overview
11.5.4 Key Developments
11.6 Christeyns
11.6.1 Company Overview
11.6.2 Product/Business Segment Overview
11.6.2.3 Professional Cleaning
11.6.3 Financial Overview
11.6.4 Key Developments
11.7 Enviro Tech Chemical Services
11.7.1 Company Overview
11.7.2 Product/Business Segment Overview
11.7.3 Financial Overview
11.7.4 Key Developments
11.8 Peroxychem
11.8.1 Company Overview
11.8.2 Product/Business Segment Overview
11.8.3 Financial Overview
11.8.4 Key Development
11.9 Seitz Gmbh
11.9.1 Company Profile
11.9.2 Product/Business Segment Overview
11.9.3 Financial Updates
11.9.4 Key Development
12 Conclusion
13 List of Tables
TABLE 1 WORLD POPULATION BY MAJOR REGIONS (2020 TO 2030) (MILLION) 25
TABLE 2 GLOBAL DISINFECTANT MARKET: BY REGION, 2020-2027 (USD MILLION) 41
TABLE 3 GLOBAL DISINFECTANT MARKET: BY REGION, 2020-2027 (KT) 42
TABLE 4 NORTH AMERICA DISINFECTANT MARKET: BY COUNTRY, 2020-2027 (USD MILLION) 43
TABLE 5 NORTH AMERICA DISINFECTANT MARKET: BY COUNTRY, 2020-2027 (KT) 43
TABLE 6 EUROPE DISINFECTANT MARKET: BY COUNTRY, 2020-2027 (USD MILLION) 44
TABLE 7 EUROPE DISINFECTANT MARKET: BY COUNTRY, 2020-2027 (KT) 45
TABLE 8 ASIA-PACIFIC DISINFECTANT MARKET: BY COUNTRY, 2020-2027 (USD MILLION) 46
TABLE 9 ASIA-PACIFIC DISINFECTANT MARKET: BY COUNTRY, 2020-2027 (KT) 46
TABLE 10 GLOBAL SANITIZER MARKET: BY REGIONS, 2020-2027 (USD MILLION) 47
TABLE 11 GLOBAL SANITIZER MARKET: BY REGIONS, 2020-2027 (KT) 48
TABLE 12 NORTH AMERICA SANITIZER MARKET: BY COUNTRY, 2020-2027 (USD MILLION) 49
TABLE 13 NORTH AMERICA SANITIZER MARKET: BY COUNTRY, 2020-2027 (KT) 49
TABLE 14 EUROPE SANITIZER MARKET: BY COUNTRY, 2020-2027 (USD MILLION) 50
TABLE 15 EUROPE SANITIZER MARKET: BY COUNTRY, 2020-2027 (KT) 51
TABLE 16 ASIA-PACIFIC SANITIZER MARKET: BY COUNTRY, 2020-2027 (USD MILLION) 52
TABLE 17 ASIA-PACIFIC SANITIZER MARKET: BY COUNTRY, 2020-2027 (KT) 52
TABLE 18 GLOBAL STERILANT MARKET: BY REGION, 2020-2027 (USD MILLION) 53
TABLE 19 GLOBAL STERILANT MARKET: BY REGION, 2020-2027 (KT) 54
TABLE 20 NORTH AMERICA STERILANT MARKET: BY COUNTRY, 2020-2027 (USD MILLION) 55
TABLE 21 NORTH AMERICA STERILANT MARKET: BY COUNTRY, 2020-2027 (KT) 55
TABLE 22 EUROPE STERILANT MARKET: BY COUNTRY, 2020-2027 (USD MILLION) 56
TABLE 23 EUROPE STERILANT MARKET: BY COUNTRY, 2020-2027 (KT) 57
TABLE 24 ASIA-PACIFIC STERILANT MARKET: BY COUNTRY, 2020-2027 (USD MILLION) 58
TABLE 25 ASIA-PACIFIC STERILANT MARKET: BY COUNTRY, 2020-2027 (KT) 58
TABLE 26 GLOBAL FOOD MARKET: BY REGIONS, 2020-2027 (USD MILLION) 60
TABLE 27 GLOBAL FOOD MARKET: BY REGIONS, 2020-2027 (KT) 61
TABLE 28 NORTH AMERICA FOOD MARKET: BY COUNTRY, 2020-2027 (USD MILLION) 62
TABLE 29 NORTH AMERICA FOOD MARKET: BY COUNTRY, 2020-2027 (KT) 62
TABLE 30 EUROPE FOOD MARKET: BY COUNTRY, 2020-2027 (USD MILLION) 63
TABLE 31 EUROPE FOOD MARKET: BY COUNTRY, 2020-2027 (KT) 64
TABLE 32 ASIA-PACIFIC FOOD MARKET: BY COUNTRY, 2020-2027 (USD MILLION) 65
TABLE 33 ASIA-PACIFIC FOOD MARKET: BY COUNTRY, 2020-2027 (KT) 65
TABLE 34 GLOBAL HEALTHCARE MARKET: BY REGION, 2020-2027 (USD MILLION) 66
TABLE 35 GLOBAL HEALTHCARE MARKET: BY REGION, 2020-2027 (KT) 67
TABLE 36 NORTH AMERICA HEALTHCARE MARKET: BY COUNTRY, 2020-2027 (USD MILLION) 68
TABLE 37 NORTH AMERICA HEALTHCARE MARKET: BY COUNTRY, 2020-2027 (KT) 68
TABLE 38 EUROPE HEALTHCARE MARKET: BY COUNTRY, 2020-2027 (USD MILLION) 69
TABLE 39 EUROPE HEALTHCARE MARKET: BY COUNTRY, 2020-2027 (KT) 70
TABLE 40 ASIA-PACIFIC HEALTHCARE MARKET: BY COUNTRY, 2020-2027 (USD MILLION) 71
TABLE 41 ASIA-PACIFIC HEALTHCARE MARKET: BY COUNTRY, 2020-2027 (KT) 71
TABLE 42 GLOBAL WATER TREATMENT MARKET: BY REGIONS, 2020-2027 (USD MILLION) 72
TABLE 43 GLOBAL WATER TREATMENT MARKET: BY REGIONS, 2020-2027 (KT) 73
TABLE 44 NORTH AMERICA WATER TREATMENT MARKET: BY COUNTRY, 2020-2027 (USD MILLION) 74
TABLE 45 NORTH AMERICA WATER TREATMENT MARKET: BY COUNTRY, 2020-2027 (KT) 74
TABLE 46 EUROPE WATER TREATMENT MARKET: BY COUNTRY, 2020-2027 (USD MILLION) 75
TABLE 47 EUROPE WATER TREATMENT MARKET: BY COUNTRY, 2020-2027 (KT) 76
TABLE 48 ASIA-PACIFIC WATER TREATMENT MARKET: BY COUNTRY, 2020-2027 (USD MILLION) 77
TABLE 49 ASIA-PACIFIC WATER TREATMENT MARKET: BY COUNTRY, 2020-2027 (KT) 77
TABLE 50 GLOBAL PULP & PAPER MARKET: BY REGION, 2020-2027 (USD MILLION) 78
TABLE 51 GLOBAL PULP & PAPER MARKET: BY REGION, 2020-2027 (USD MILLION) 79
TABLE 52 NORTH AMERICA PULP & PAPER MARKET: BY COUNTRY, 2020-2027 (USD MILLION) 80
TABLE 53 NORTH AMERICA PULP & PAPER MARKET: BY COUNTRY, 2020-2027 (KT) 80
TABLE 54 EUROPE PULP & PAPER MARKET: BY COUNTRY, 2020-2027 (USD MILLION) 81
TABLE 55 EUROPE PULP & PAPER MARKET: BY COUNTRY, 2020-2027 (KT) 82
TABLE 56 ASIA-PACIFIC PULP & PAPER MARKET: BY COUNTRY, 2020-2027 (USD MILLION) 83
TABLE 57 ASIA-PACIFIC PULP & PAPER MARKET: BY COUNTRY, 2020-2027 (KT) 83
TABLE 58 OTHERS (AGRICULTURE & LAUNDRY) MARKET: BY REGION, 2020-2027 (USD MILLION) 84
TABLE 59 OTHERS (AGRICULTURE & LAUNDRY) MARKET: BY REGION, 2020-2027 (KT) 85
TABLE 60 NORTH AMERICA OTHERS (AGRICULTURE & LAUNDRY) MARKET: BY COUNTRY, 2020-2027 (USD MILLION) 86
TABLE 61 NORTH AMERICA OTHERS (AGRICULTURE & LAUNDRY) MARKET: BY COUNTRY, 2020-2027 (KT) 86
TABLE 62 EUROPE OTHERS (AGRICULTURE & LAUNDRY) MARKET: BY COUNTRY, 2020-2027 (USD MILLION) 87
TABLE 63 EUROPE OTHERS (AGRICULTURE & LAUNDRY) MARKET: BY COUNTRY, 2020-2027 (KT) 88
TABLE 64 ASIA-PACIFIC OTHERS (AGRICULTURE & LAUNDRY) MARKET: BY COUNTRY, 2020-2027 (USD MILLION) 89
TABLE 65 ASIA-PACIFIC OTHERS (AGRICULTURE & LAUNDRY) MARKET: BY COUNTRY, 2020-2027 (KT) 89
TABLE 66 NORTH AMERICA PEROXYACETIC ACID MARKET, BY COUNTRY (USD MILLION) 90
TABLE 67 NORTH AMERICA PEROXYACETIC ACID MARKET, BY COUNTRY (KT) 91
TABLE 68 NORTH AMERICA PEROXYACETIC ACID MARKET, BY TYPES (MILLION USD) 91
TABLE 69 NORTH AMERICA PEROXYACETIC ACID MARKET, BY TYPES (KT) 91
TABLE 70 NORTH AMERICA PEROXYACETIC ACID MARKET, BY APPLICATION (MILLION USD) 92
TABLE 71 NORTH AMERICA PEROXYACETIC ACID MARKET, BY APPLICATION (KT) 92
TABLE 72 UNITED STATES: PEROXYACETIC ACID MARKET, BY TYPE (USD MILLION) 93
TABLE 73 UNITED STATES: PEROXYACETIC ACID MARKET, BY TYPE (KT) 93
TABLE 74 UNITED STATES: PEROXYACETIC ACID MARKET, BY APPLICATION (USD MILLION) 93
TABLE 75 UNITED STATES: PEROXYACETIC ACID MARKET, BY APPLICATION (KT) 94
TABLE 76 CANADA: PEROXYACETIC ACID MARKET, BY TYPES (USD MILLION) 94
TABLE 77 CANADA: PEROXYACETIC ACID MARKET, BY TYPES (KT) 95
TABLE 78 CANADA: PEROXYACETIC ACID MARKET, BY APPLICATION (USD MILLION) 95
TABLE 79 CANADA: PEROXYACETIC ACID MARKET, BY APPLICATION (KT) 95
TABLE 80 EUROPE: PEROXYACETIC ACID MARKET, BY COUNTRY (USD MILLION) 96
TABLE 81 EUROPE: PEROXYACETIC ACID MARKET, BY COUNTRY (KT) 97
TABLE 82 EUROPE: PEROXYACETIC ACID MARKET, BY TYPE (USD MILLION) 97
TABLE 83 EUROPE: PEROXYACETIC ACID MARKET, BY TYPE (KT) 97
TABLE 84 EUROPE: PEROXYACETIC ACID MARKET, BY APPLICATION (USD MILLION) 98
TABLE 85 EUROPE: PEROXYACETIC ACID MARKET, BY APPLICATION (KT) 98
TABLE 86 GERMANY: PEROXYACETIC ACID MARKET, BY TYPES (USD MILLION) 99
TABLE 87 GERMANY: PEROXYACETIC ACID MARKET, BY TYPES (KT) 99
TABLE 88 GERMANY: PEROXYACETIC ACID MARKET, BY APPLICATION (USD MILLION) 99
TABLE 89 GERMANY: PEROXYACETIC ACID MARKET, BY APPLICATION (KT) 100
TABLE 90 UNITED KINGDOM: PEROXYACETIC ACID MARKET, BY TYPES (USD MILLION) 100
TABLE 91 UNITED KINGDOM: PEROXYACETIC ACID MARKET, BY TYPES (KT) 101
TABLE 92 UNITED KINGDOM: PEROXYACETIC ACID MARKET, BY APPLICATION (USD MILLION) 101
TABLE 93 UNITED KINGDOM: PEROXYACETIC ACID MARKET, BY APPLICATION (KT) 101
TABLE 94 FRANCE: PEROXYACETIC ACID MARKET, BY TYPE (USD MILLION) 102
TABLE 95 FRANCE: PEROXYACETIC ACID MARKET, BY TYPE (KT) 102
TABLE 96 FRANCE: PEROXYACETIC ACID MARKET, BY APPLICATION (USD MILLION) 102
TABLE 97 FRANCE: PEROXYACETIC ACID MARKET, BY APPLICATION (KT) 103
TABLE 98 SPAIN: PEROXYACETIC ACID MARKET, BY TYPE (USD MILLION) 103
TABLE 99 SPAIN: PEROXYACETIC ACID MARKET, BY TYPE (KT) 104
TABLE 100 SPAIN: PEROXYACETIC ACID MARKET, BY APPLICATION (USD MILLION) 104
TABLE 101 SPAIN: PEROXYACETIC ACID MARKET, BY APPLICATION (KT) 104
TABLE 102 ITALY: PEROXYACETIC ACID MARKET, BY TYPE (USD MILLION) 105
TABLE 103 ITALY: PEROXYACETIC ACID MARKET, BY TYPE (KT) 105
TABLE 104 ITALY: PEROXYACETIC ACID MARKET, BY APPLICATION (USD MILLION) 106
TABLE 105 ITALY: PEROXYACETIC ACID MARKET, BY APPLICATION (KT) 106
TABLE 106 REST OF EUROPE: PEROXYACETIC ACID MARKET, BY TYPE (USD MILLION) 106
TABLE 107 REST OF EUROPE: PEROXYACETIC ACID MARKET, BY TYPE (KT) 107
TABLE 108 REST OF EUROPE: PEROXYACETIC ACID MARKET, BY APPLICATION (USD MILLION) 107
TABLE 109 REST OF EUROPE: PEROXYACETIC ACID MARKET, BY APPLICATION (KT) 108
TABLE 110 ASIA-PACIFIC: PEROXYACETIC ACID MARKET, BY COUNTRY (USD MILLION) 109
TABLE 111 ASIA-PACIFIC: PEROXYACETIC ACID MARKET, BY COUNTRY (KT) 109
TABLE 112 ASIA-PACIFIC: PEROXYACETIC ACID MARKET, BY TYPE (USD MILLION) 109
TABLE 113 ASIA-PACIFIC: PEROXYACETIC ACID MARKET, BY TYPE (KT) 110
TABLE 114 ASIA-PACIFIC: PEROXYACETIC ACID MARKET, BY APPLICATION (USD MILLION) 110
TABLE 115 ASIA-PACIFIC: PEROXYACETIC ACID MARKET, BY APPLICATION (USD MILLION) 110
TABLE 116 CHINA: PEROXYACETIC ACID MARKET, BY TYPE (USD MILLION) 111
TABLE 117 CHINA: PEROXYACETIC ACID MARKET, BY TYPE (KT) 111
TABLE 118 CHINA: PEROXYACETIC ACID MARKET, BY APPLICATION (USD MILLION) 112
TABLE 119 CHINA: PEROXYACETIC ACID MARKET, BY APPLICATION (KT) 112
TABLE 120 JAPAN: PEROXYACETIC ACID MARKET, BY TYPE (USD MILLION) 112
TABLE 121 JAPAN: PEROXYACETIC ACID MARKET, BY TYPE (KT) 113
TABLE 122 JAPAN: PEROXYACETIC ACID MARKET, BY APPLICATION (USD MILLION) 113
TABLE 123 JAPAN: PEROXYACETIC ACID MARKET, BY APPLICATION (KT) 114
TABLE 124 MIDDLE EAST: PEROXYACETIC ACID MARKET, BY REGION (USD MILLION) 114
TABLE 125 MIDDLE EAST: PEROXYACETIC ACID MARKET, BY REGION (KT) 114
TABLE 126 MIDDLE EAST: PEROXYACETIC ACID MARKET, BY TYPE (USD MILLION) 115
TABLE 127 MIDDLE EAST: PEROXYACETIC ACID MARKET, BY TYPE (KT) 115
TABLE 128 MIDDLE EAST: PEROXYACETIC ACID MARKET, BY APPLICATION (USD MILLION) 115
TABLE 129 MIDDLE EAST: PEROXYACETIC ACID MARKET, BY APPLICATION (KT) 116
TABLE 130 AFRICA: PEROXYACETIC ACID MARKET, BY REGION (USD MILLION) 116
TABLE 131 AFRICA: PEROXYACETIC ACID MARKET, BY REGION (USD KT) 116
TABLE 132 AFRICA: PEROXYACETIC ACID MARKET, BY TYPE (USD MILLION) 116
TABLE 133 AFRICA: PEROXYACETIC ACID MARKET, BY TYPE (KT) 117
TABLE 134 AFRICA: PEROXYACETIC ACID MARKET, BY APPLICATION (USD MILLION) 117
TABLE 135 AFRICA: PEROXYACETIC ACID MARKET, BY APPLICATION (KT) 118
TABLE 136 SOUTH AMERICA: PEROXYACETIC ACID MARKET, BY REGION (USD MILLION) 118
TABLE 137 SOUTH AMERICA: PEROXYACETIC ACID MARKET, BY REGION (KT) 118
TABLE 138 SOUTH AMERICA: PEROXYACETIC ACID MARKET, BY TYPE (USD MILLION) 118
TABLE 139 SOUTH AMERICA: PEROXYACETIC ACID MARKET, BY TYPE (KT) 119
TABLE 140 SOUTH AMERICA: PEROXYACETIC ACID MARKET, BY APPLICATION (USD MILLION) 119
TABLE 141 SOUTH AMERICA: PEROXYACETIC ACID MARKET, BY APPLICATION (USD MILLION) 119
14 List of Figures
FIGURE 1 TOP DOWN & BOTTOM DOWN APPROACH 22
FIGURE 2 ACETIC ACID PRICES FOR NORTHEAST ASIA (2020-2027) 26
FIGURE 3 US PACKAGED FOOD INDUSTRY MARKET SIZE (2020-2027) 27
FIGURE 4 FOOD PRODUCTION INDEX (2004-2006 = 100) 27
FIGURE 5 INDUSTRY, VALUE ADDED (% OF GDP) 28
FIGURE 6 URBAN POPULATION (% OF TOTAL) 28
FIGURE 7 IMPROVED WATER SOURCE, RURAL (% OF RURAL POPULATION WITH ACCESS) 29
FIGURE 8 IMPROVED WATER SOURCE, URBAN (% OF URBAN POPULATION WITH ACCESS) 29
FIGURE 9 IMPROVED WATER SOURCE (% OF POPULATION WITH ACCESS) 30
FIGURE 10 GDP GROWTH (ANNUAL %) 30
FIGURE 11 INDUSTRY, VALUE ADDED (% OF GDP) 31
FIGURE 12 PORTER’S FIVE FORCES 32
FIGURE 13 PEROXYACETIC ACID VALUE CHAIN ANALYSIS 35
FIGURE 14 MARKET SIZE BY TYPE, 2020-2027 (USD MILLION) 40
FIGURE 15 GLOBAL DISINFECTANT MARKET SHARE FOR PEROXYACETIC ACID: BY REGIONS, 2020 (% SHARE) 41
FIGURE 16 NORTH AMERICA DISINFECTANT MARKET SHARE FOR PEROXYACETIC ACID: BY REGION, 2020 (% SHARE) 42
FIGURE 17 EUROPE DISINFECTANT MARKET SHARE FOR PEROXYACETIC ACID: BY REGIONS, 2020 (% SHARE) 44
FIGURE 18 ASIA-PACIFIC DISINFECTANT MARKET SHARE FOR PEROXYACETIC ACID: BY REGION, 2020 (% SHARE) 45
FIGURE 19 GLOBAL SANITIZER MARKET SHARE FOR PEROXYACETIC ACID: BY REGIONS, 2020 (% SHARE) 47
FIGURE 20 NORTH AMERICA SANITIZER MARKET SHARE FOR PEROXYACETIC ACID: BY REGIONS, 2020 (% SHARE) 48
FIGURE 21 EUROPE SANITIZER MARKET SHARE FOR PEROXYACETIC ACID: BY REGION, 2020 (% SHARE) 50
FIGURE 22 ASIA-PACIFIC SANITIZER MARKET SHARE FOR PEROXYACETIC ACID: BY REGION, 2020 (% SHARE) 51
FIGURE 23 GLOBAL STERILANT MARKET SHARE FOR PEROXYACETIC ACID: BY REGION, 2020 (% SHARE) 53
FIGURE 24 NORTH AMERICA STERILANT MARKET SHARE FOR PEROXYACETIC ACID: BY REGION, 2020 (% SHARE) 54
FIGURE 25 EUROPE STERILANT MARKET SHARE FOR PEROXYACETIC ACID: BY REGIONS, 2020 (% SHARE) 56
FIGURE 26 ASIA-PACIFIC STERILANT MARKET SHARE FOR PEROXYACETIC ACID: BY REGIONS, 2020 (% SHARE) 57
FIGURE 27 PEROXYACETIC ACID MARKET SIZE BY APPLICATION (USD MILLION) (2020-2027) 59
FIGURE 28 GLOBAL FOOD MARKET SHARE FOR PEROXYACETIC ACID: BY REGION, 2020 (% SHARE) 60
FIGURE 29 NORTH AMERICA FOOD MARKET SHARE FOR PEROXYACETIC ACID: BY COUNTRY, 2020 (% SHARE) 61
FIGURE 30 EUROPE FOOD MARKET SHARE FOR PEROXYACETIC ACID: BY COUNTRY, 2020 (% SHARE) 63
FIGURE 31 ASIA-PACIFIC FOOD MARKET SHARE FOR PEROXYACETIC ACID: BY COUNTRY, 2020 (% SHARE) 64
FIGURE 32 GLOBAL HEALTHCARE MARKET SHARE FOR PEROXYACETIC ACID: BY REGION, 2020 (% SHARE) 66
FIGURE 33 NORTH AMERICA HEALTHCARE MARKET SHARE FOR PEROXYACETIC ACID: BY COUNTRY, 2020 (% SHARE) 67
FIGURE 34 EUROPE HEALTHCARE MARKET SHARE FOR PEROXYACETIC ACID: BY COUNTRY, 2020 (% SHARE) 69
FIGURE 35 ASIA-PACIFIC HEALTHCARE MARKET SHARE FOR PEROXYACETIC ACID: BY COUNTRY, 2020 (% SHARE) 70
FIGURE 36 GLOBAL WATER TREATMENT MARKET SHARE FOR PEROXYACETIC ACID: BY REGION, 2020 (% SHARE) 72
FIGURE 37 NORTH AMERICA WATER TREATMENT MARKET SHARE FOR PEROXYACETIC ACID: BY COUNTRY, 2020 (% SHARE) 73
FIGURE 38 EUROPE WATER TREATMENT MARKET SHARE FOR PEROXYACETIC ACID: BY COUNTRY, 2020 (% SHARE) 75
FIGURE 39 ASIA-PACIFIC WATER TREATMENT MARKET SHARE FOR PEROXYACETIC ACID: BY COUNTRY, 2020 (% SHARE) 76
FIGURE 40 GLOBAL PULP & PAPER MARKET SHARE FOR PEROXYACETIC ACID: BY REGION, 2020 (% SHARE) 78
FIGURE 41 NORTH AMERICA PULP & PAPER MARKET SHARE FOR PEROXYACETIC ACID: BY COUNTRY, 2020 (% SHARE) 79
FIGURE 42 EUROPE PULP & PAPER MARKET SHARE FOR PEROXYACETIC ACID: BY COUNTRY, 2020 (% SHARE) 81
FIGURE 43 ASIA-PACIFIC PULP & PAPER MARKET SHARE FOR PEROXYACETIC ACID: BY COUNTRY, 2020 (% SHARE) 82
FIGURE 44 OTHERS (AGRICULTURE & LAUNDRY) MARKET SHARE FOR PEROXYACETIC ACID: BY REGION, 2020 (% SHARE) 84
FIGURE 45 NORTH AMERICA OTHERS (AGRICULTURE & LAUNDRY) MARKET SHARE FOR PEROXYACETIC ACID: BY COUNTRY, 2020 (% SHARE) 85
FIGURE 46 EUROPE OTHERS (AGRICULTURE & LAUNDRY) MARKET SHARE FOR PEROXYACETIC ACID: BY COUNTRY, 2020 (% SHARE) 87
FIGURE 47 ASIA-PACIFIC OTHERS (AGRICULTURE & LAUNDRY)MARKET SHARE FOR PEROXYACETIC ACID: BY COUNTRY, 2020 (% SHARE) 88
FIGURE 48 NORTH AMERICA MARKET SHARE FOR PEROXYACETIC ACID, BY COUNTRY IN 2020 (% SHARE) 90
FIGURE 49 EUROPE MARKET SHARE FOR PEROXYACETIC ACID, BY COUNTRY IN 2020 (% SHARE) 96
FIGURE 50 ASIA-PACIFIC MARKET SHARE FOR PEROXYACETIC ACID, BY COUNTRY IN 2020 (% SHARE) 108
FIGURE 51 REGIONAL TRENDS – MARKET SIZE & GROWTH RATE 10